-

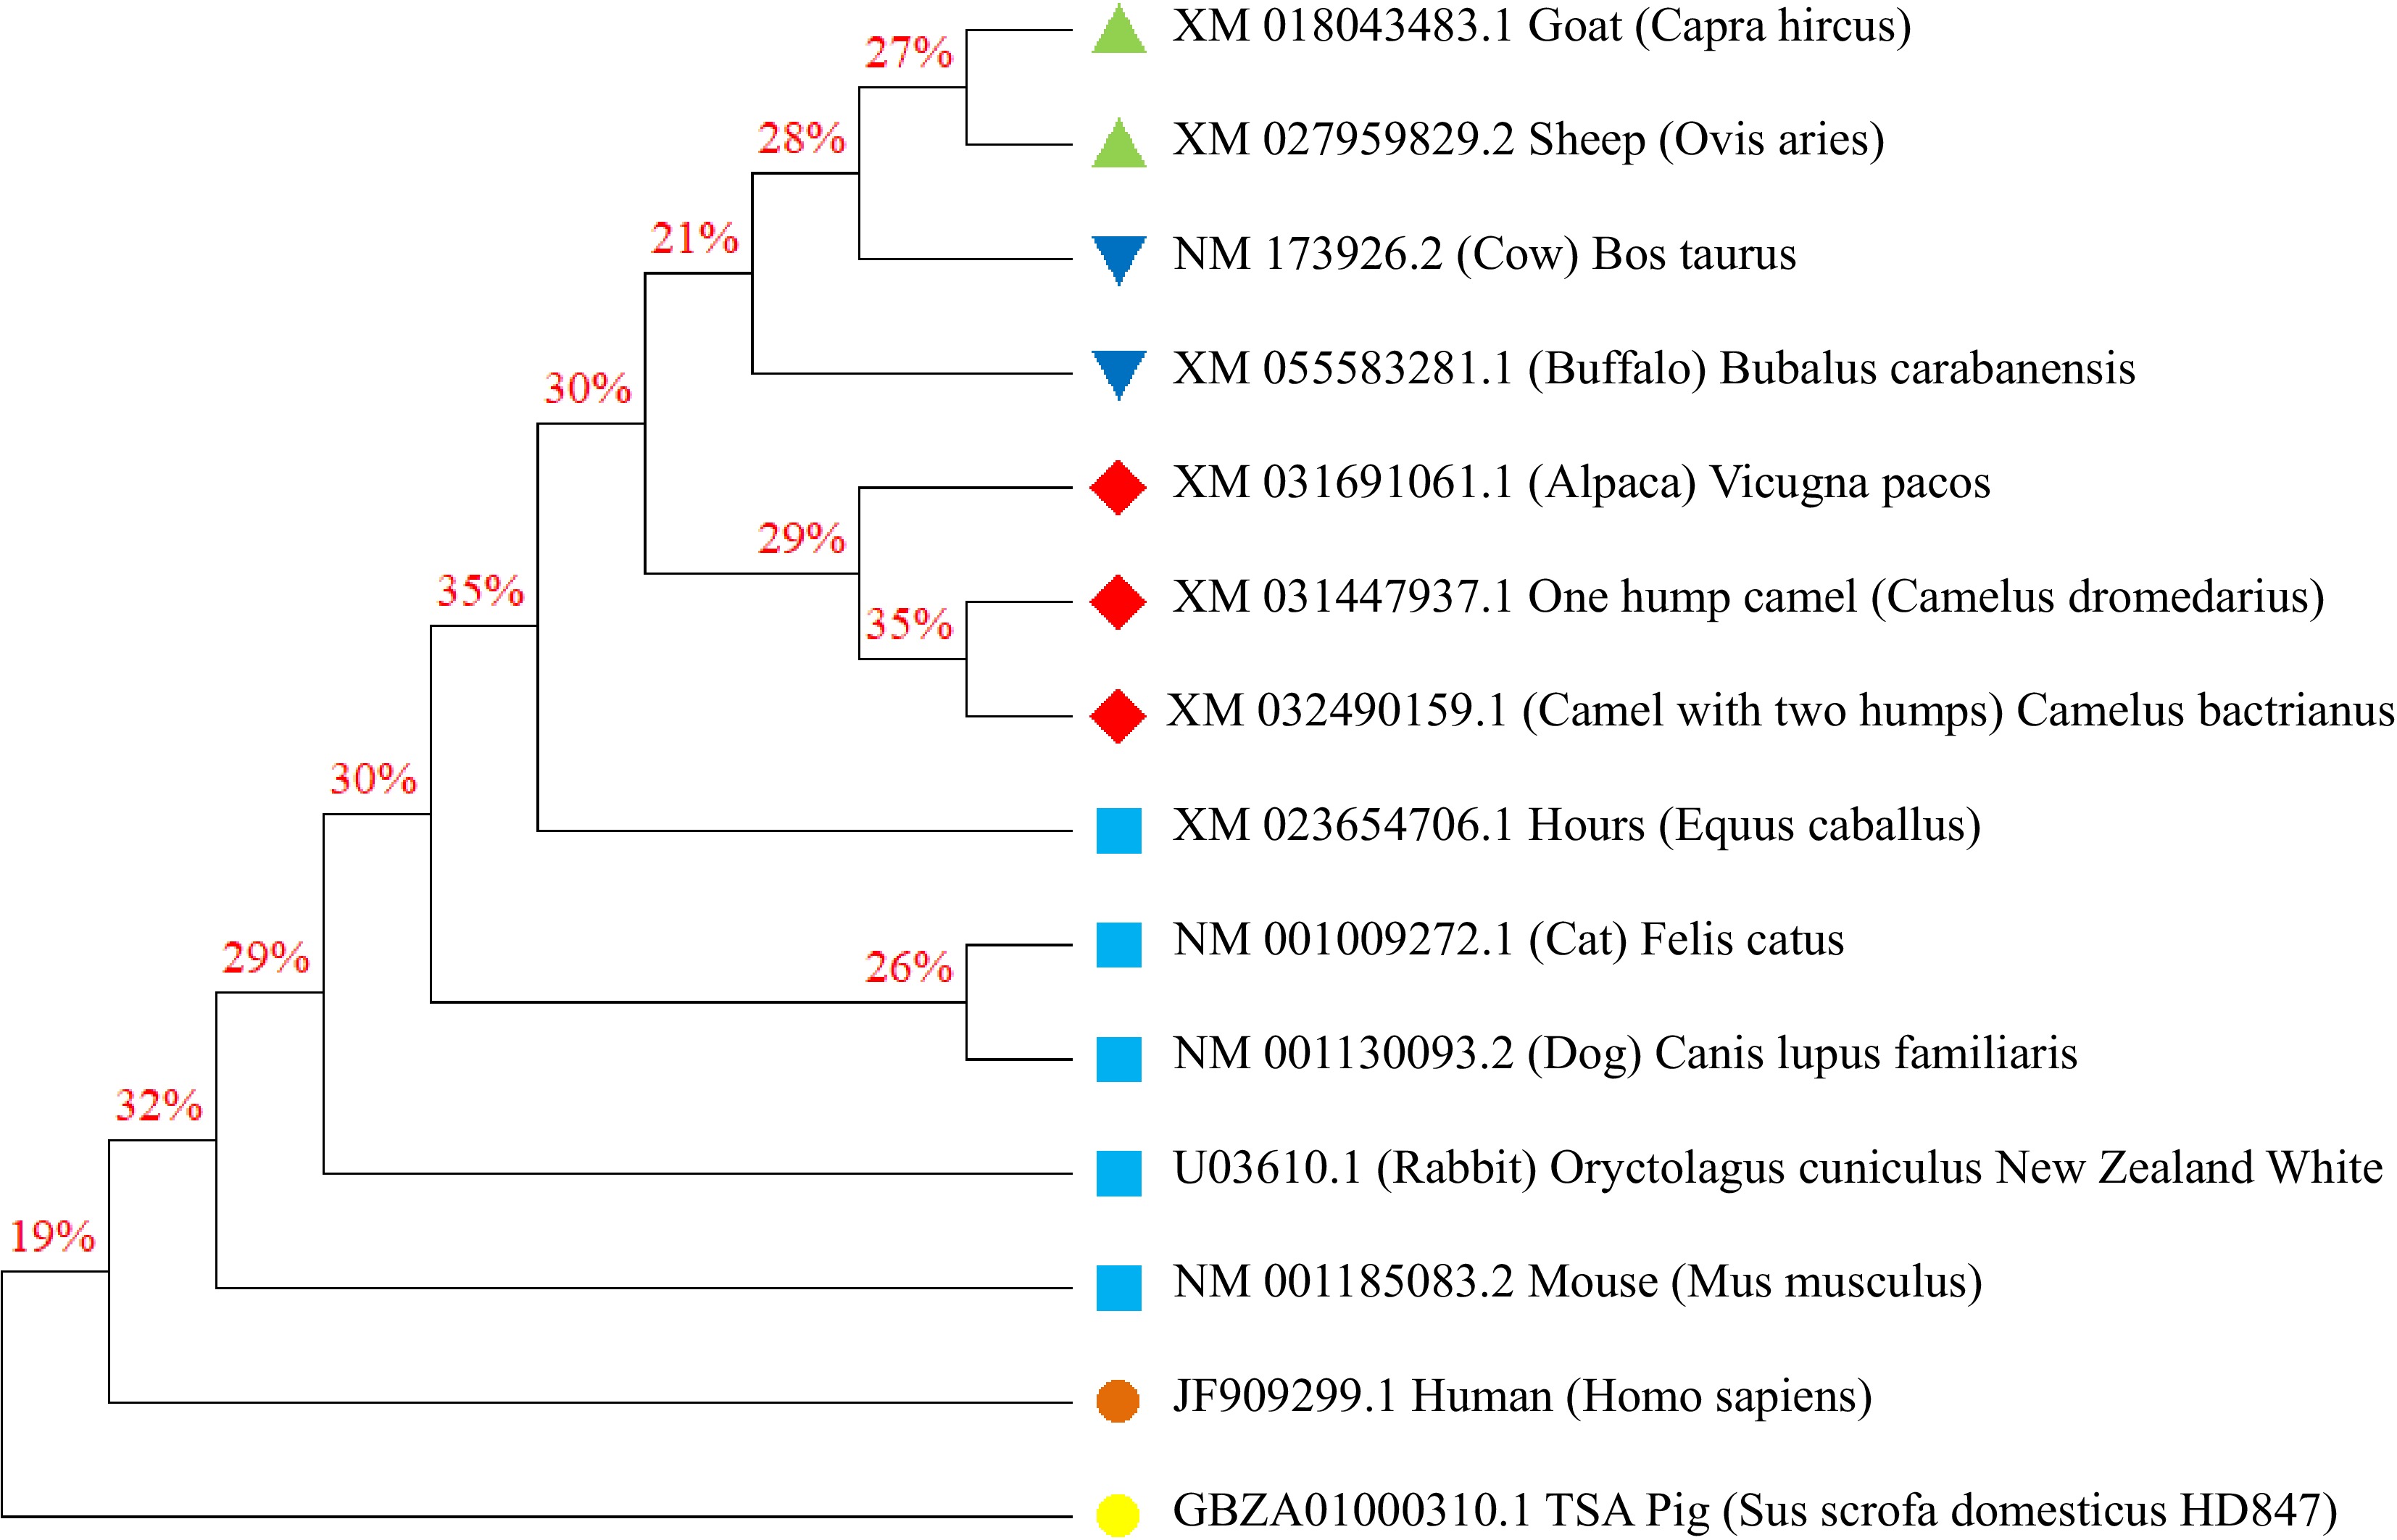
Figure 1.
Phylogenetic analysis of insulin in different mammals.
-

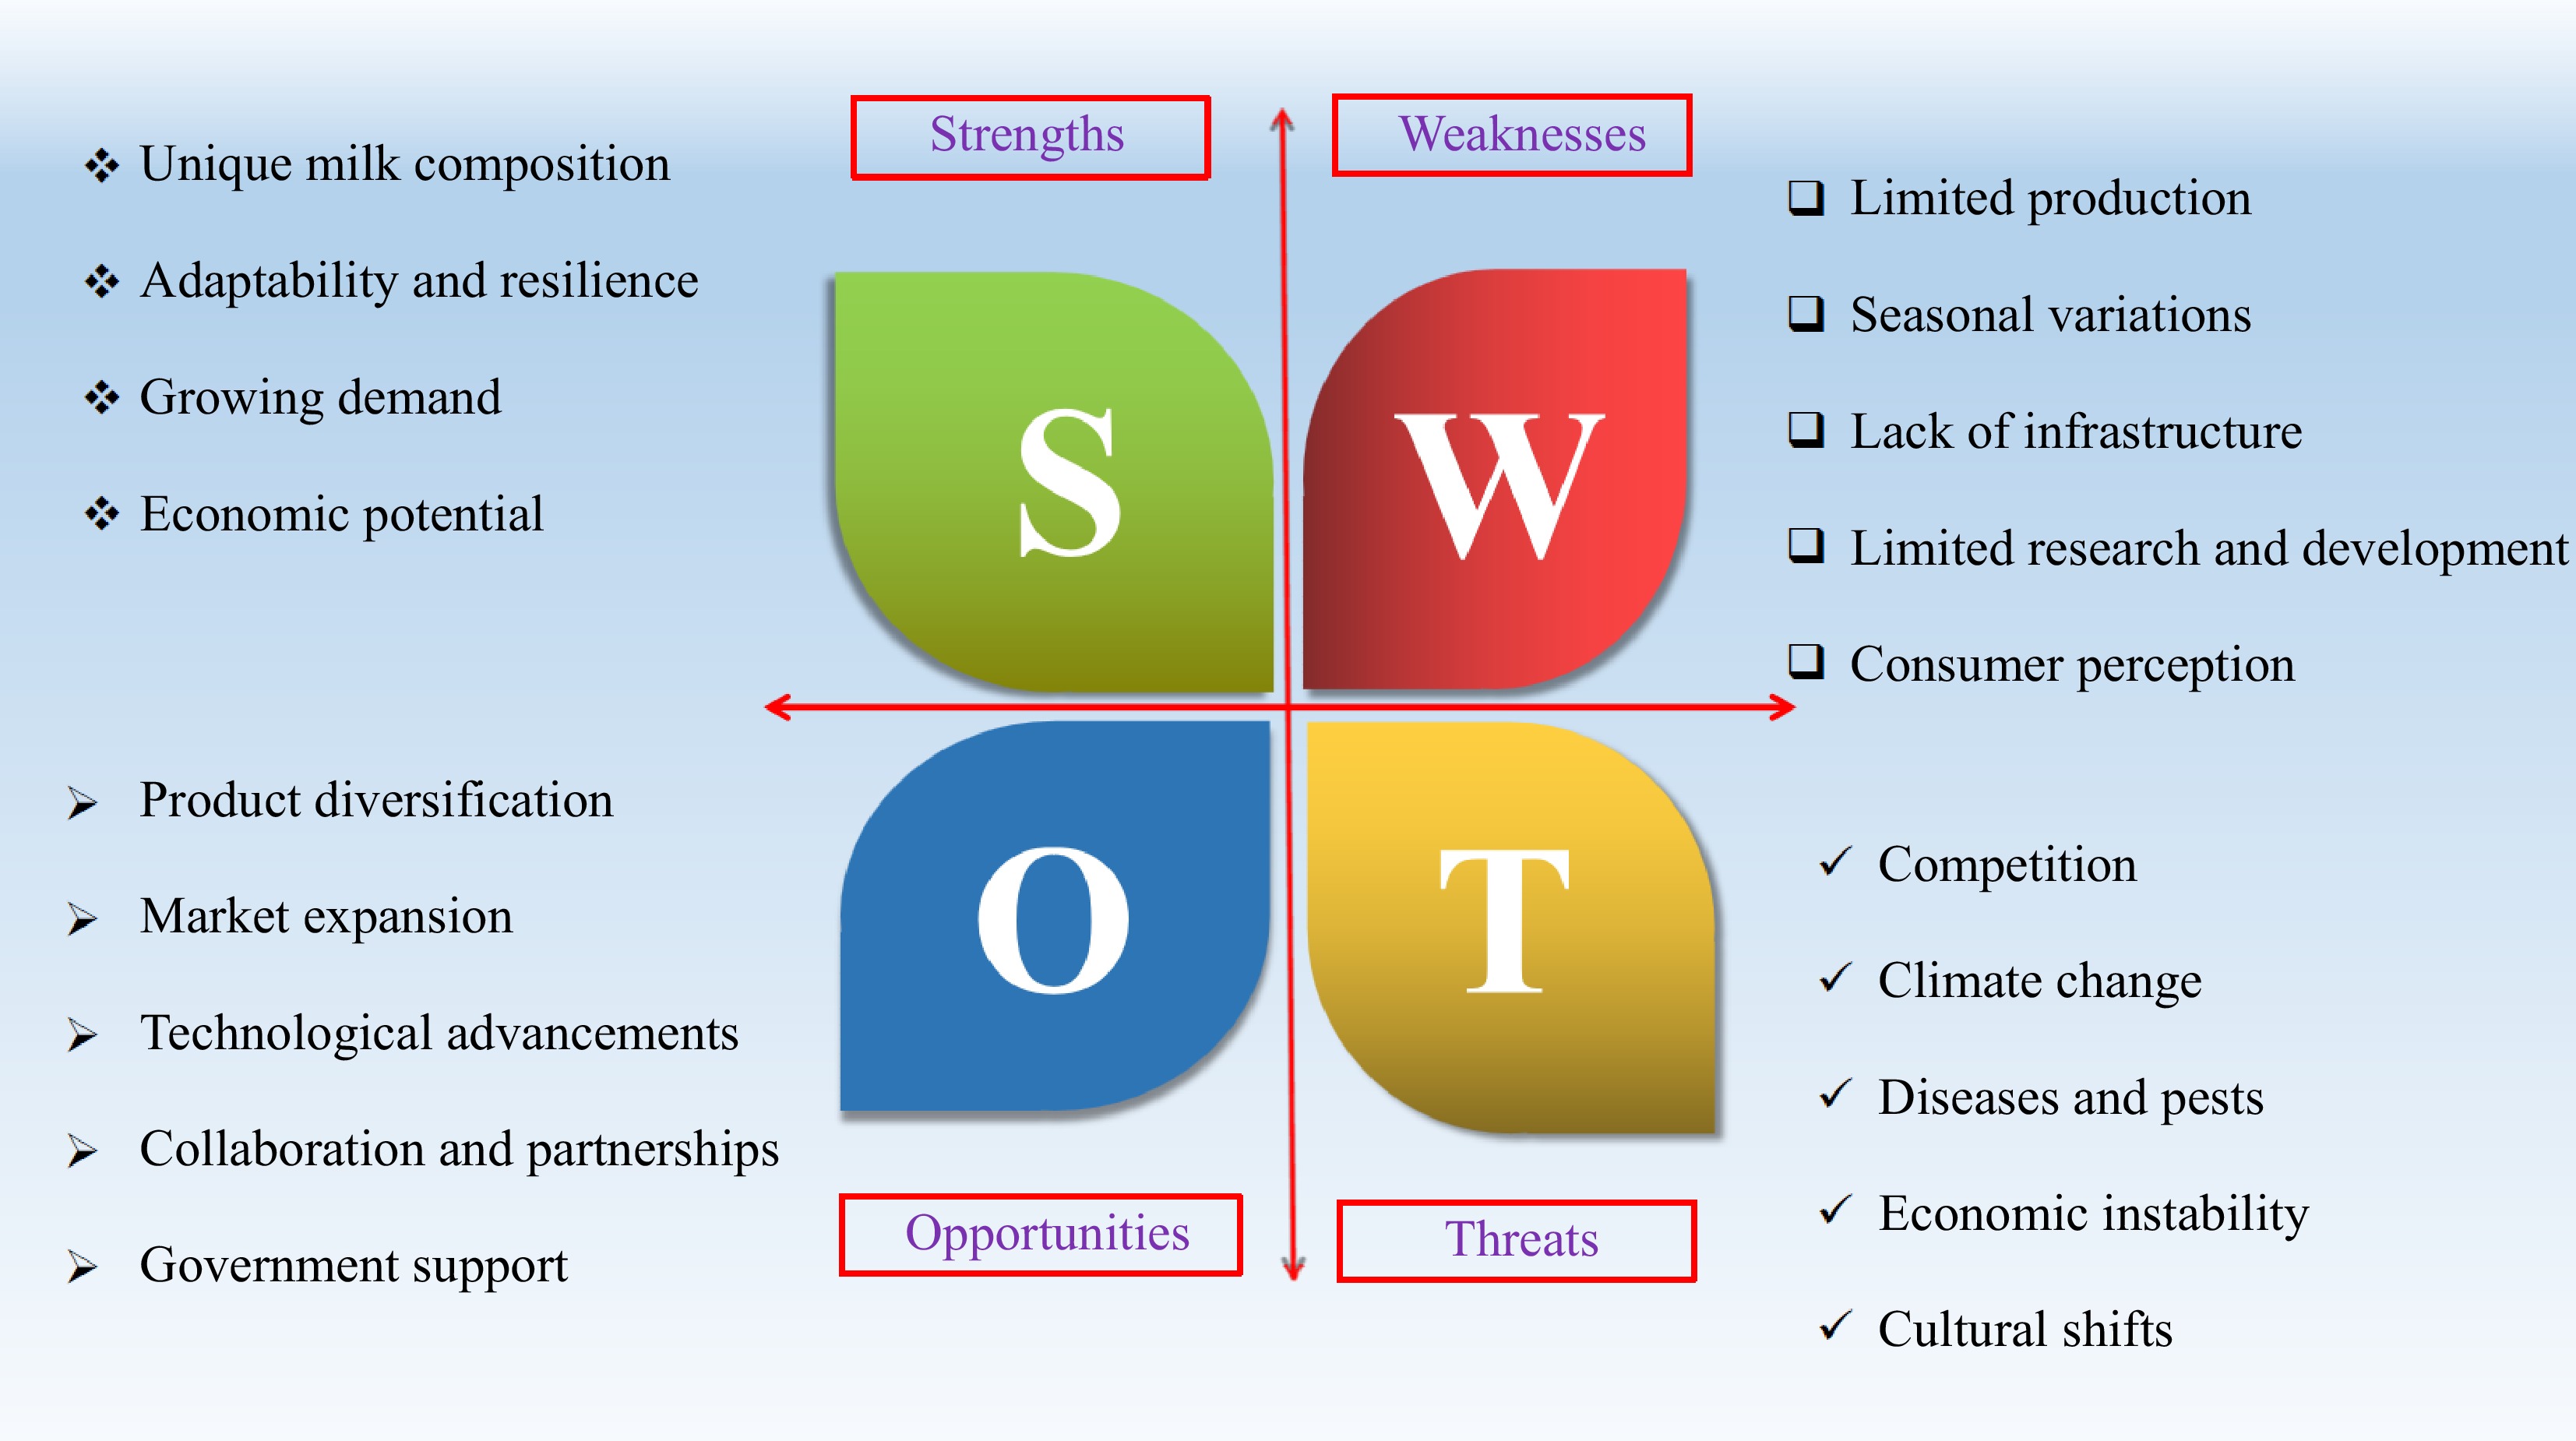
Figure 2.
SWOT Analysis overview of camels and camel milk.
-
Composition Camel milk Cow's milk Ref. Water content (%) 87–91 85–87 [22,24,56] Total solids (%) 9–13 12.7–13 Milk solids-not-fat (MSNF) (%) 8.45 9.0 Fat (%) 1.2–5 3–5 Protein (%) 2.7–4.5 2.7–4.7 Lactose (%) 2.4–5.8 3.7–5.2 Minerals Higher content of calcium, potassium, phosphorus, magnesium Lower content of calcium, potassium, phosphorus, magnesium Ash (%) 0.6–0.9 0.7–0.8 Vitamins Similar content of vitamins C, B, A, and D Similar content of vitamins C, B, A, and D pH 6.5–6.7 6.6–6.8 Casein Different casein profiles with unique types and ratios (e.g., higher alpha-s1 casein) Different casein profiles with distinct types and ratios Enzyme activity Unique enzymes (e.g., higher lysozyme activity, lactoperoxidase) Varied enzyme activity (e.g., lactase, lipase) Immunoglobulins Higher content of immunoglobulins (e.g., IgG, IgA) Lower content of immunoglobulins Insulin (IU/ml) 40.50–58.67 17.01 Energy (kcal) 66.1–88.9 76.2 * Please note that the values mentioned in the table are approximate ranges and can vary depending on various factors such as breed, age, diet, and other environmental conditions. Additionally, camel milk's composition can vary significantly based on the region and season. Table 1.
Comparison of chemical compositions of camel and cow milk.
-
Parameters Camel milk Cow milk Ref. Total caseins % 65−70 80 [8,24] κ- casein (g/L) 0.1−2.4 4.39 β-casein (g/L) 5.5−29.0 32.7−39.0 α casein (g/L) 2.89 12.79 α-S1-casein (g/L) 2.4−10.3 3.80−3.97 α-S2-casein (g/L) 0.3−3.9 10.0−10.3 Micelle size (μm) 3.2−5.6 4.3−8.4 * Please note that the values mentioned in the table are approximate ranges and can vary depending on various factors such as breed, age, diet, and other environmental conditions. Additionally, camel milk's composition can vary significantly based on the region and season. Table 2.
Comparison of casein fractions of camel and cow milk.
-
Parameters Camel milk Cow milk Ref. Total whey protein % 9.3–10 7.3–8 [9,
30,
33]Whey acidic protein (mg/L) 15.7–16 – β-lactoalbumin (mg/L) 3.5 1.2 Serum albumin (g/L) 0.46 0.36 Lactoferrin (mg/L) 200–728 80–500 Immunoglobulins (g/L) 1.5 0.5–1.0 Lysozyme (μg/100 mL) 228–500 7–37 Peptidoglycan recognition proteins (PGRPs) (mg/L) 370 – β-lactoglobulin (mg/L) – 1.3–3.5 α-lactalbumin (mg/L)) > 5.000 600–1,700 Immunoglobulins (kDa) Heavy chains Light chains Heavy chains Light chains IgG (whole molecule) 60 29 55 26 IgM 80 27 75 22.5 IgA 55.5 22.5 61 24 * Please note that the values mentioned in the table are approximate ranges and can vary depending on various factors such as breed, age, diet, and other environmental conditions. Additionally, camel milk's composition can vary significantly based on the region and season. Table 3.
Comparison of bioactive whey fractions of camel and cow milk.
-
Parameters (g/100 g) Camel milk Cow milk Ref. Histidine 2.9 1.4 [19,34] Serine 2.2 5.9 Cysteine 0.3 − Arginine 10.6 3.9 Glycine 2.2 2.3 Aspartic acid 10.2 10.7 Glutamic acid 29.2 7.4 Threonine 8 2.7 Alanine 3.1 5.1 Praline 17.8 14 Lysine 10 4.7 Tyrosine 0.9 0.3 Methionine 3.7 1.1 Valine 10.3 8.1 * Please note that the values mentioned in the table are approximate ranges and can vary depending on various factors such as breed, age, diet, and other environmental conditions. Additionally, camel milk's composition can vary significantly based on the region and season. Table 4.
Amino acids content of camel and cow milk.
-
Parameters Camel milk Cow milk Ref. Iron (mg/L) 1.3–2.5 0.3–0.8 [19,33] Calcium (mg/100 g) 100–160 100–140 Phosphate (mg/L) 580–1,040 650–1,100 Potassium (mg/L) 600–2,100 1,350–1,550 Zinc (g/L) 4.5–5 3.5–5.5 Copper (g/L) 1.3–1.8 0.1–0.2 Magnesium (mg/L) 75–160 100–150 Manganese (mg/L) 0.08–0.2 0.04–0.2 Sodium (mg/L) 360–620 350–600 * Please note that the values mentioned in the table are approximate ranges and can vary depending on various factors such as breed, age, diet, and other environmental conditions. Additionally, camel milk's composition can vary significantly based on the region and season. Table 5.
The mineral content of camel and cow milk.
-
Parameters Camel milk Cow milk Ref. β- Carotene (μg %) − 99.60 [19,37] Vitamin A (mg/L) 0.1–0.15 0.17–0.38 Vitamin D (mg/L) ND 0.5 Vitamin E (mg/L) 0.53 0.2–1.0 Vitamin B1 (mg/L) 0.33–0.6 0.28–0.9 Niacin (mg/L) 4.60 0.5–0.8 Vitamin C (mg/L) 24–36 3–23 Pantothenic acid (mg/L) 0.88 2.6–4.9 Vitamin B12 (mg/L) 0.002 0.002–0.007 Folic acid (mg/L) 0.004 0.01–0.1 Vitamin B2 (mg/L) 0.42–0.8 1.2–2 Vitamin B6 (mg/L) 0.52 0.4–0.63 * Please note that the values mentioned in the table are approximate ranges and can vary depending on various factors such as breed, age, diet, and other environmental conditions. Additionally, camel milk's composition can vary significantly based on the region and season. Table 6.
The vitamins content of camel and cow milk.
Figures
(2)
Tables
(6)