-
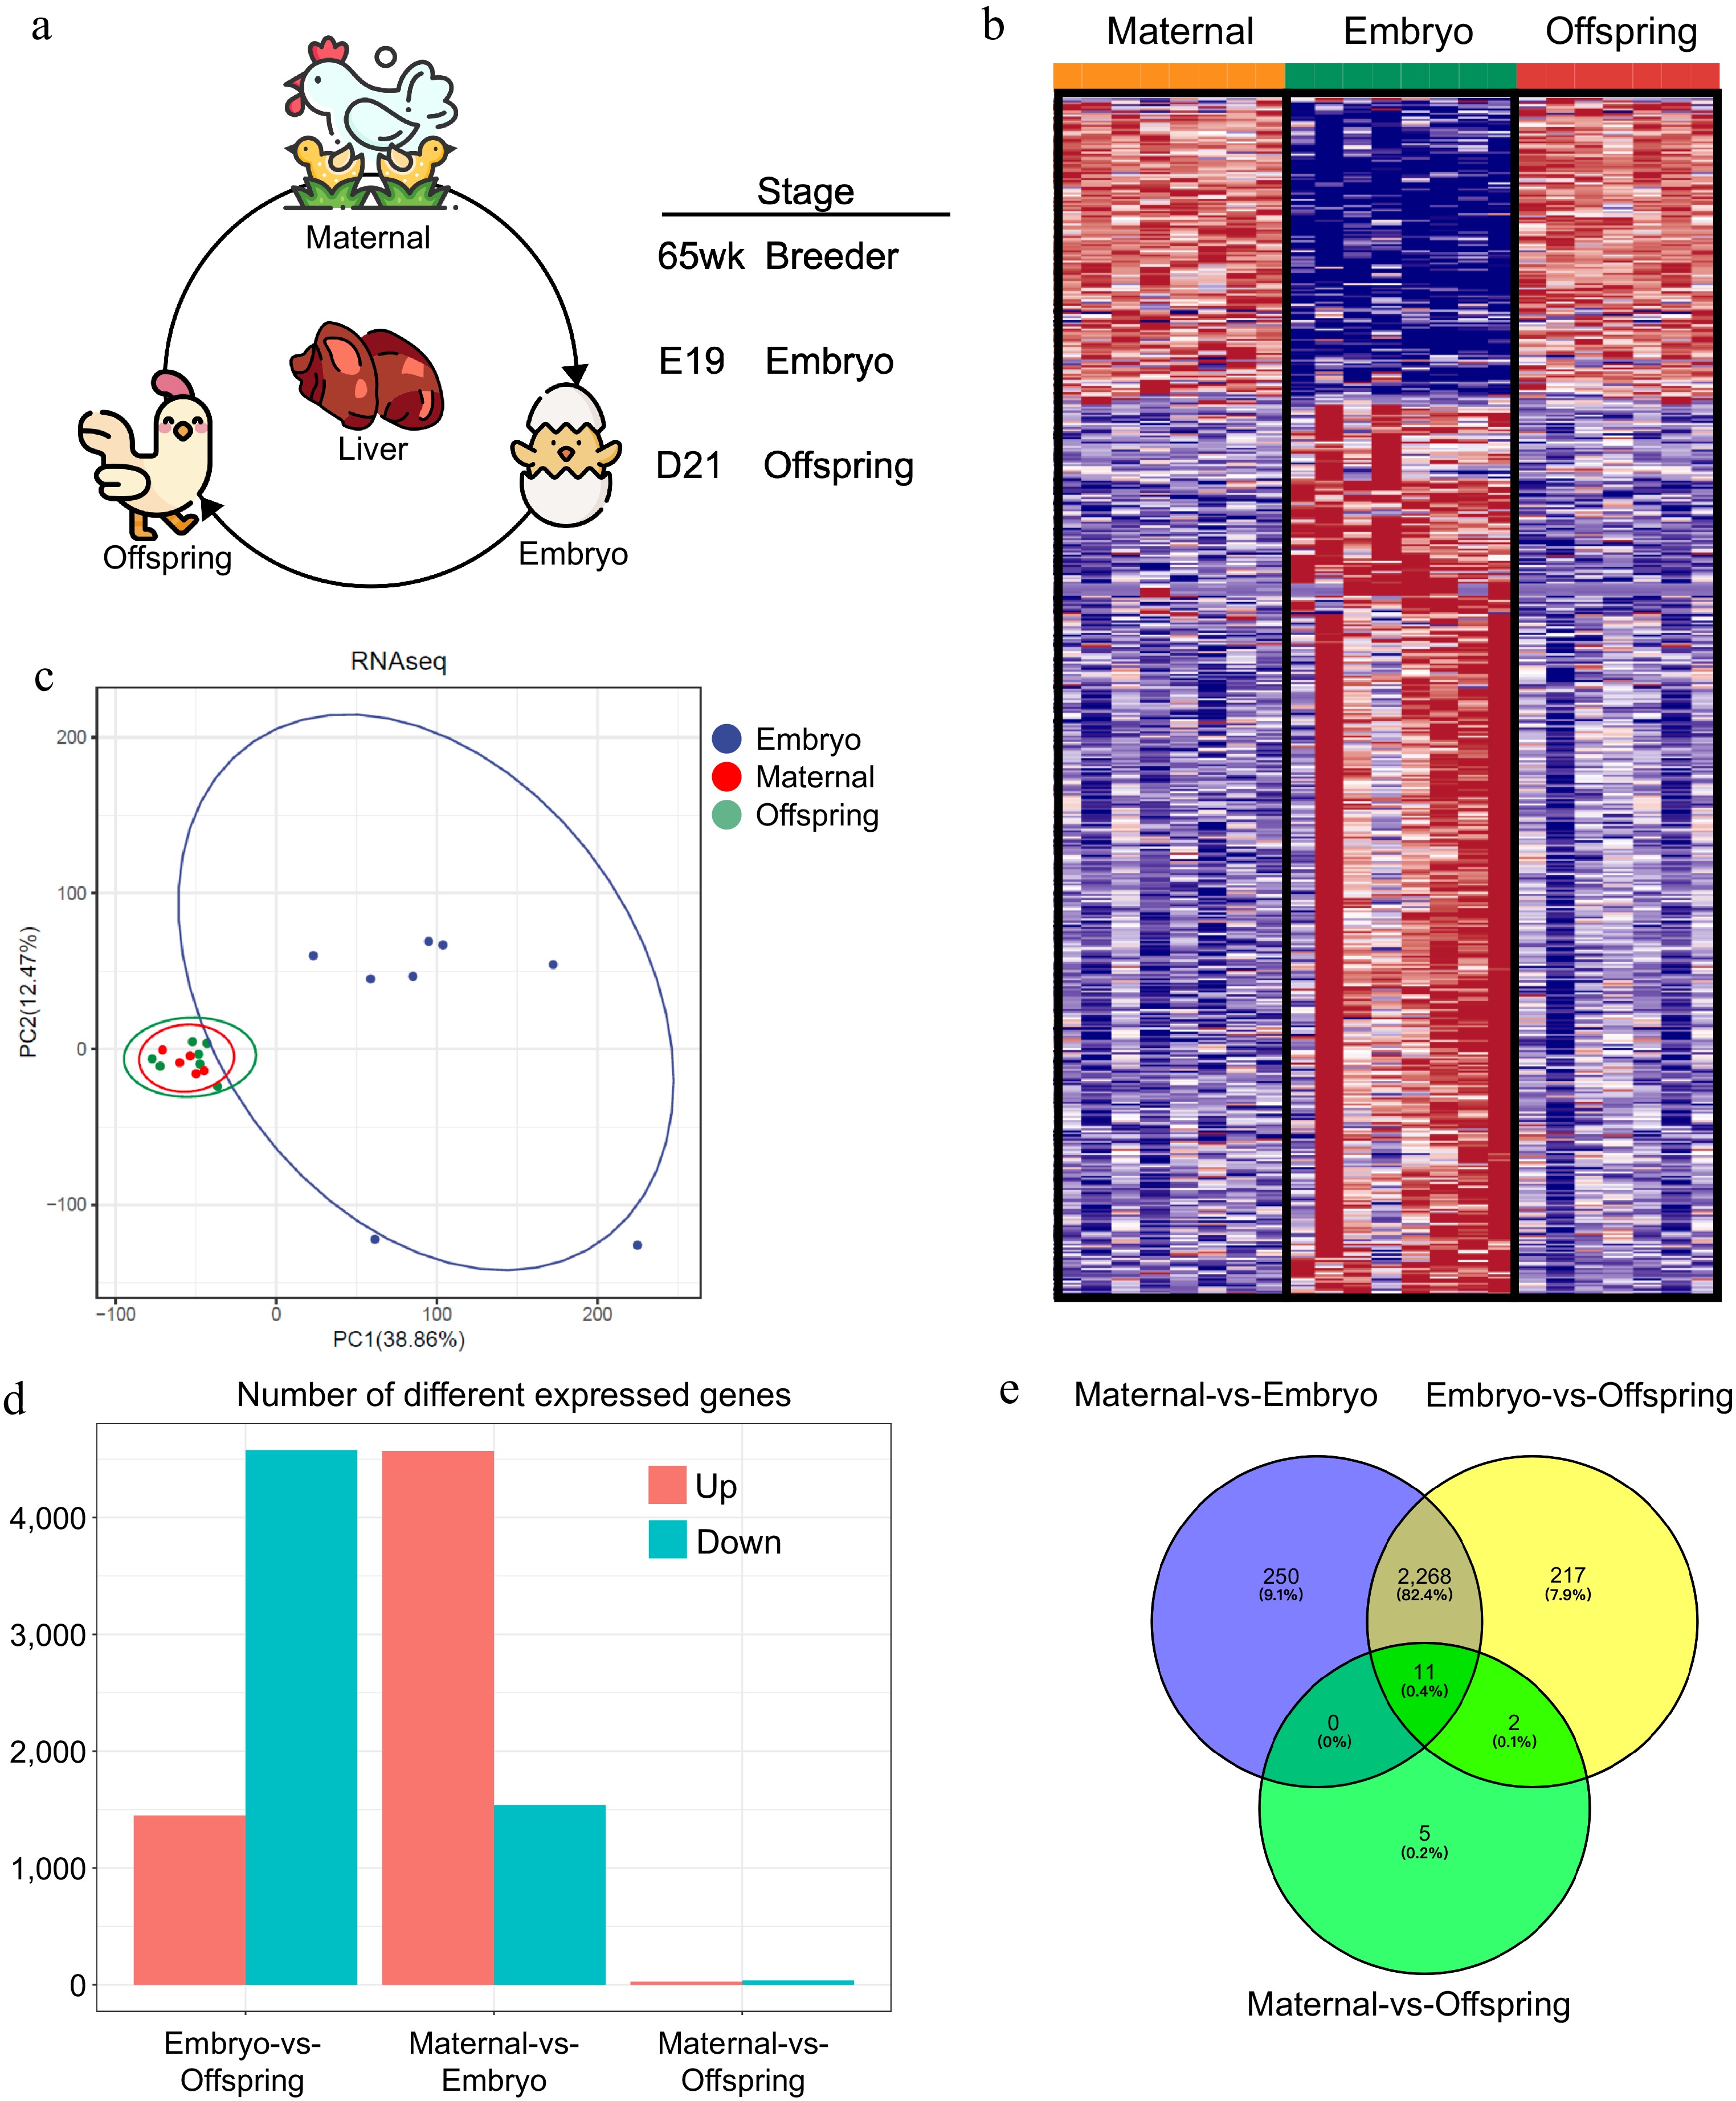
Figure 1.
Liver transcriptome profiles of maternal, embryo, and offspring stages. (a) Workflow diagram, (b) differential gene expression profiles across the three stages, (c) PCoA plot of sample distribution, (d) number of differentially expressed genes between stages, (e) Venn diagram of differentially expressed genes.
-
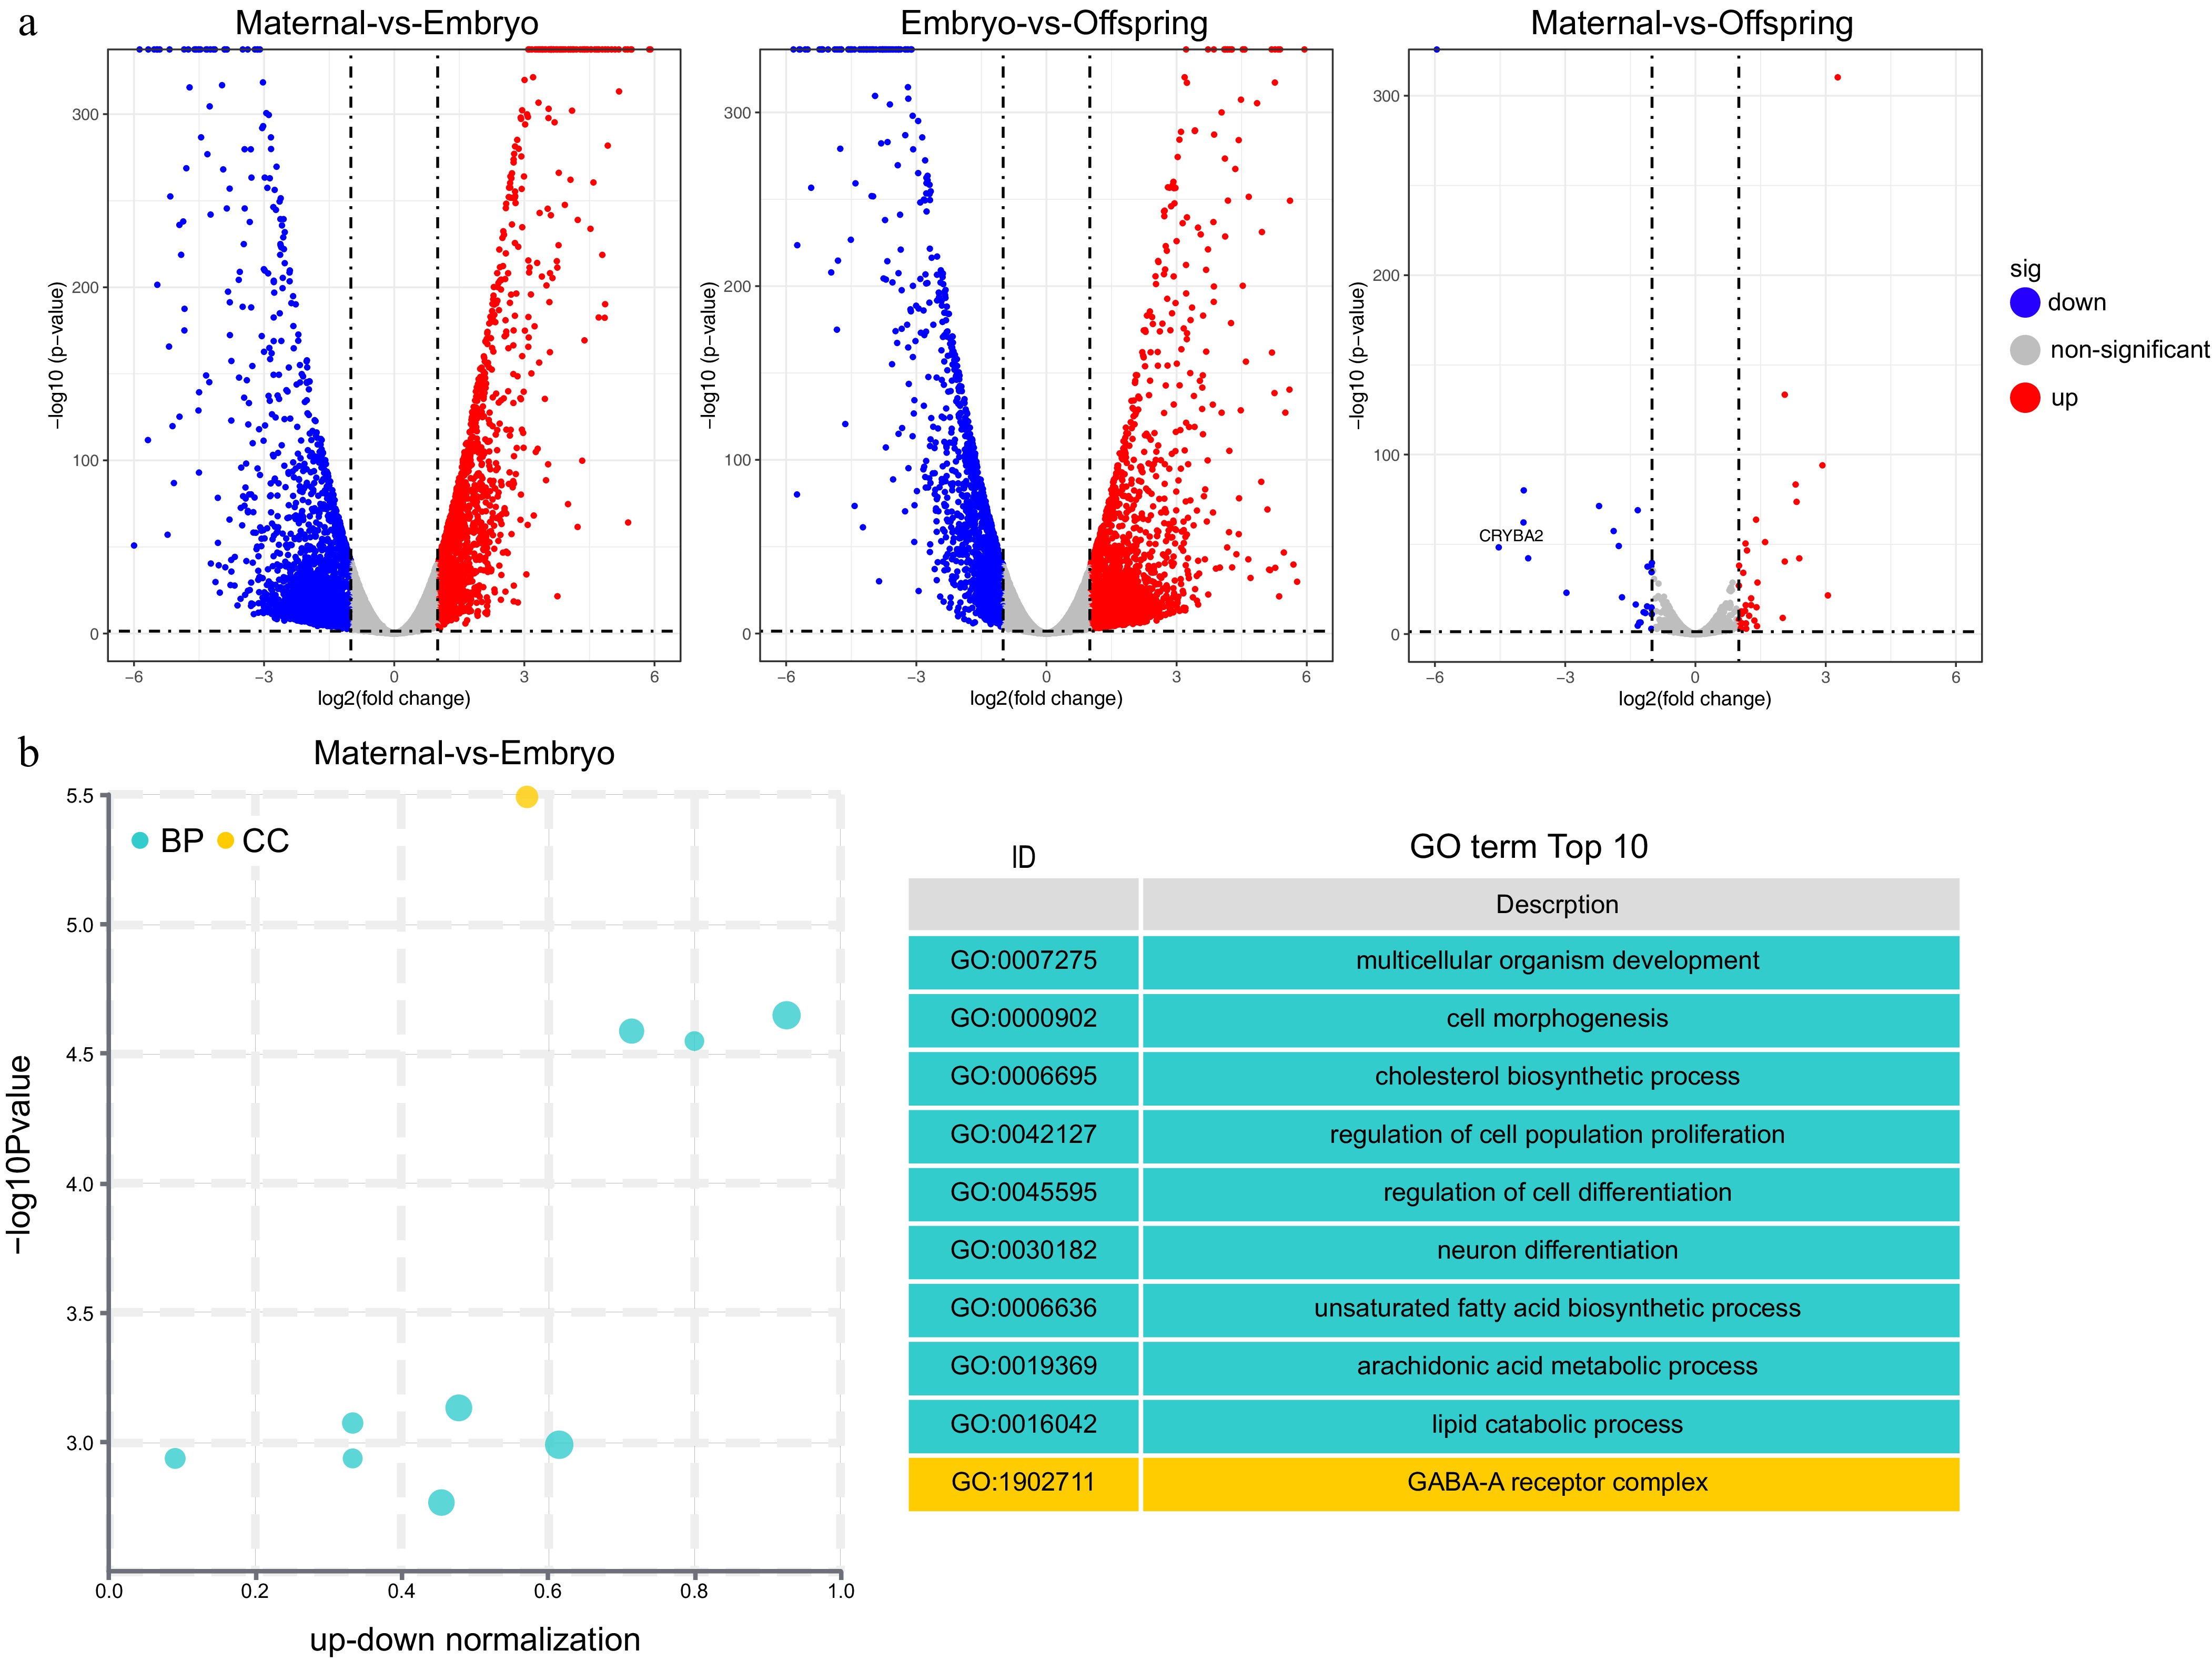
Figure 2.
GO enrichment analysis of differentially expressed genes (DEGs). (a) Volcano plot, (b) top 10 GO pathways enriched in DEGs between maternal and embryo stages. The cyan color represents GO's Biological Process (BP) pathways, while the yellow color represents GO's Cellular Component (CC) pathways.
-
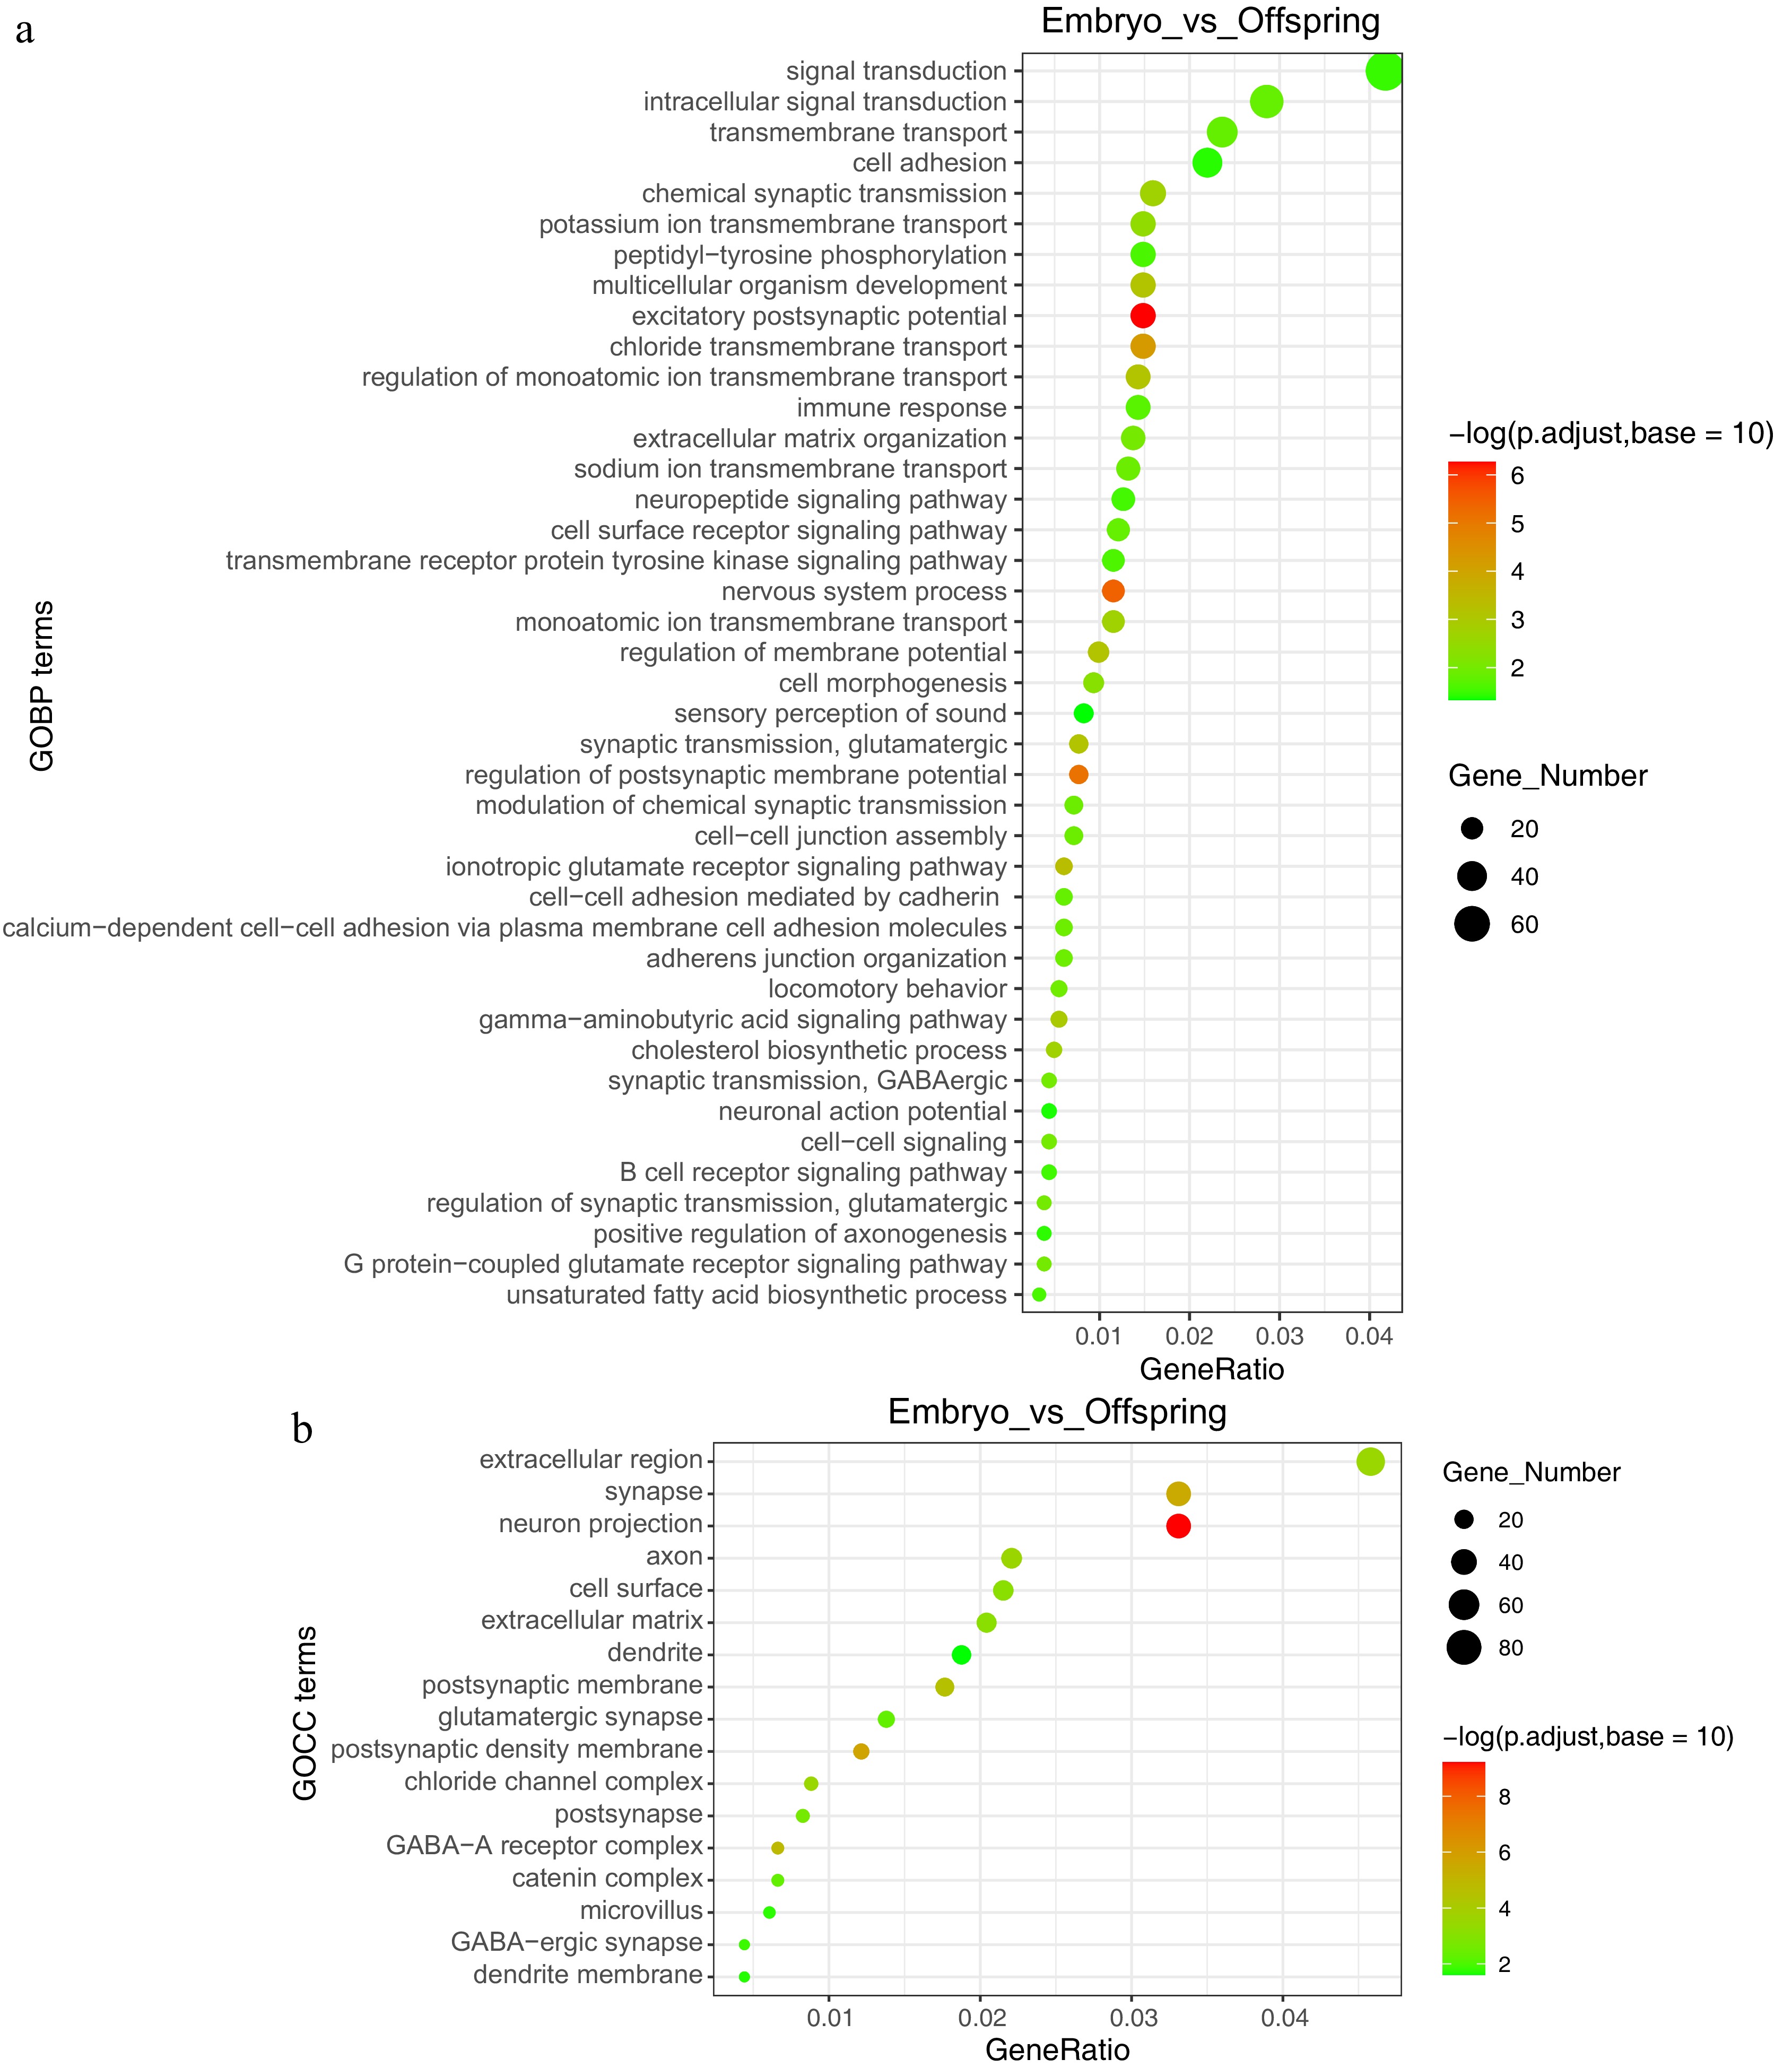
Figure 3.
GO functional annotation analysis of embryo vs offspring stages. (a) Enriched functions at the GOBP (Gene Ontology Biological Process) level, (b) enriched functions at the GOCC (Gene Ontology Cellular Component) level.
-
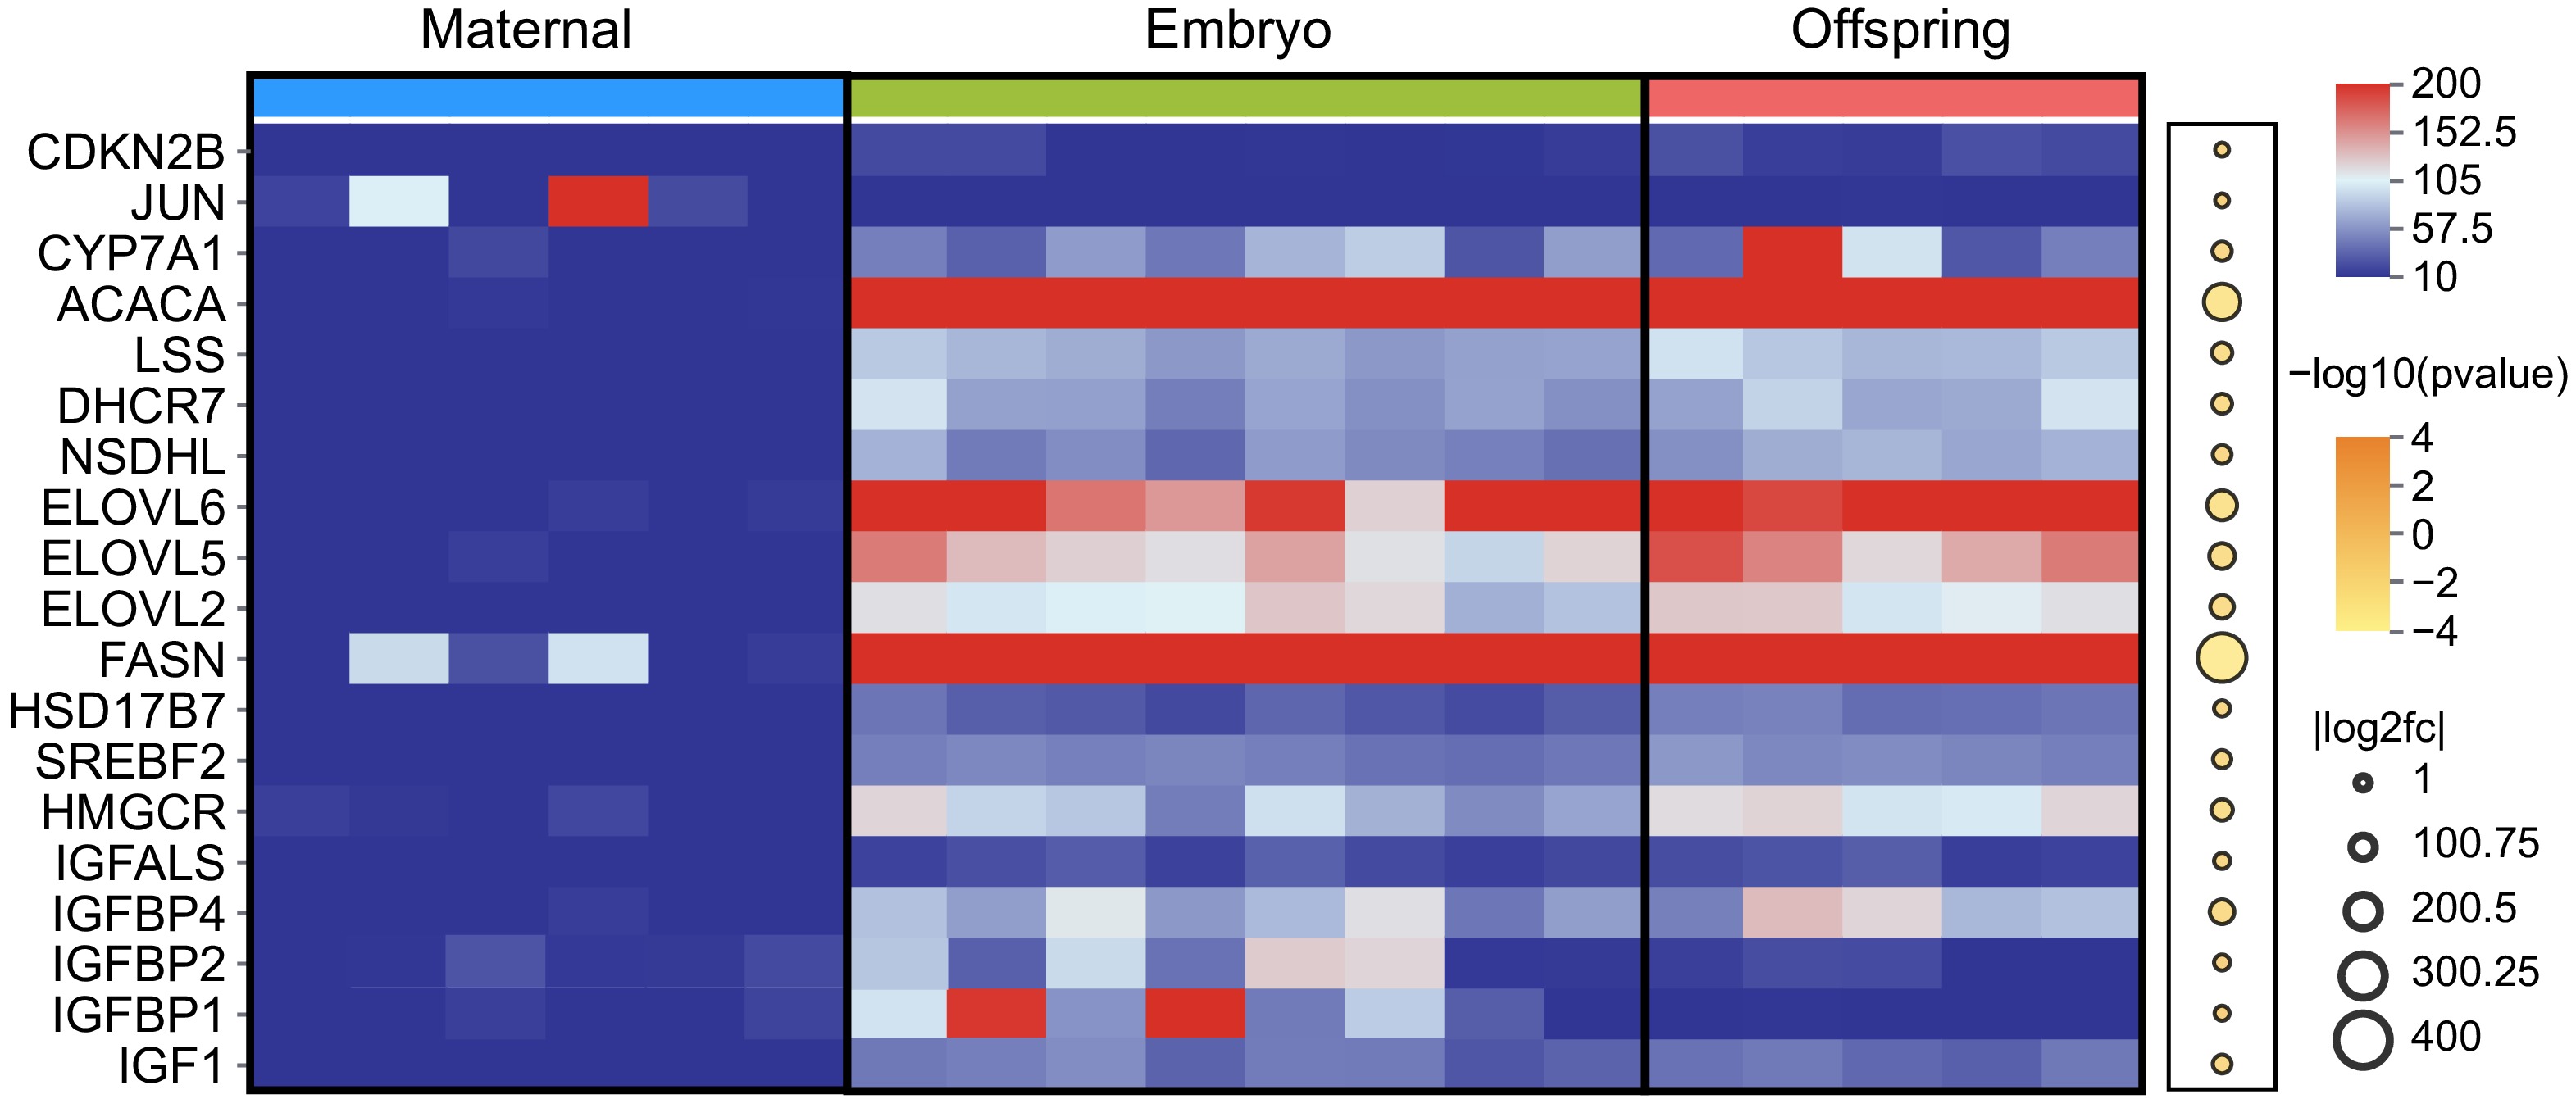
Figure 4.
Expression of DEGs in maternal, embryo, and offspring liver tissues. The red and blue squares represent FPKM values, with darker red indicating higher expression levels. Upregulated DEGs are marked in dark yellow, while downregulated DEGs are shown in white.
-
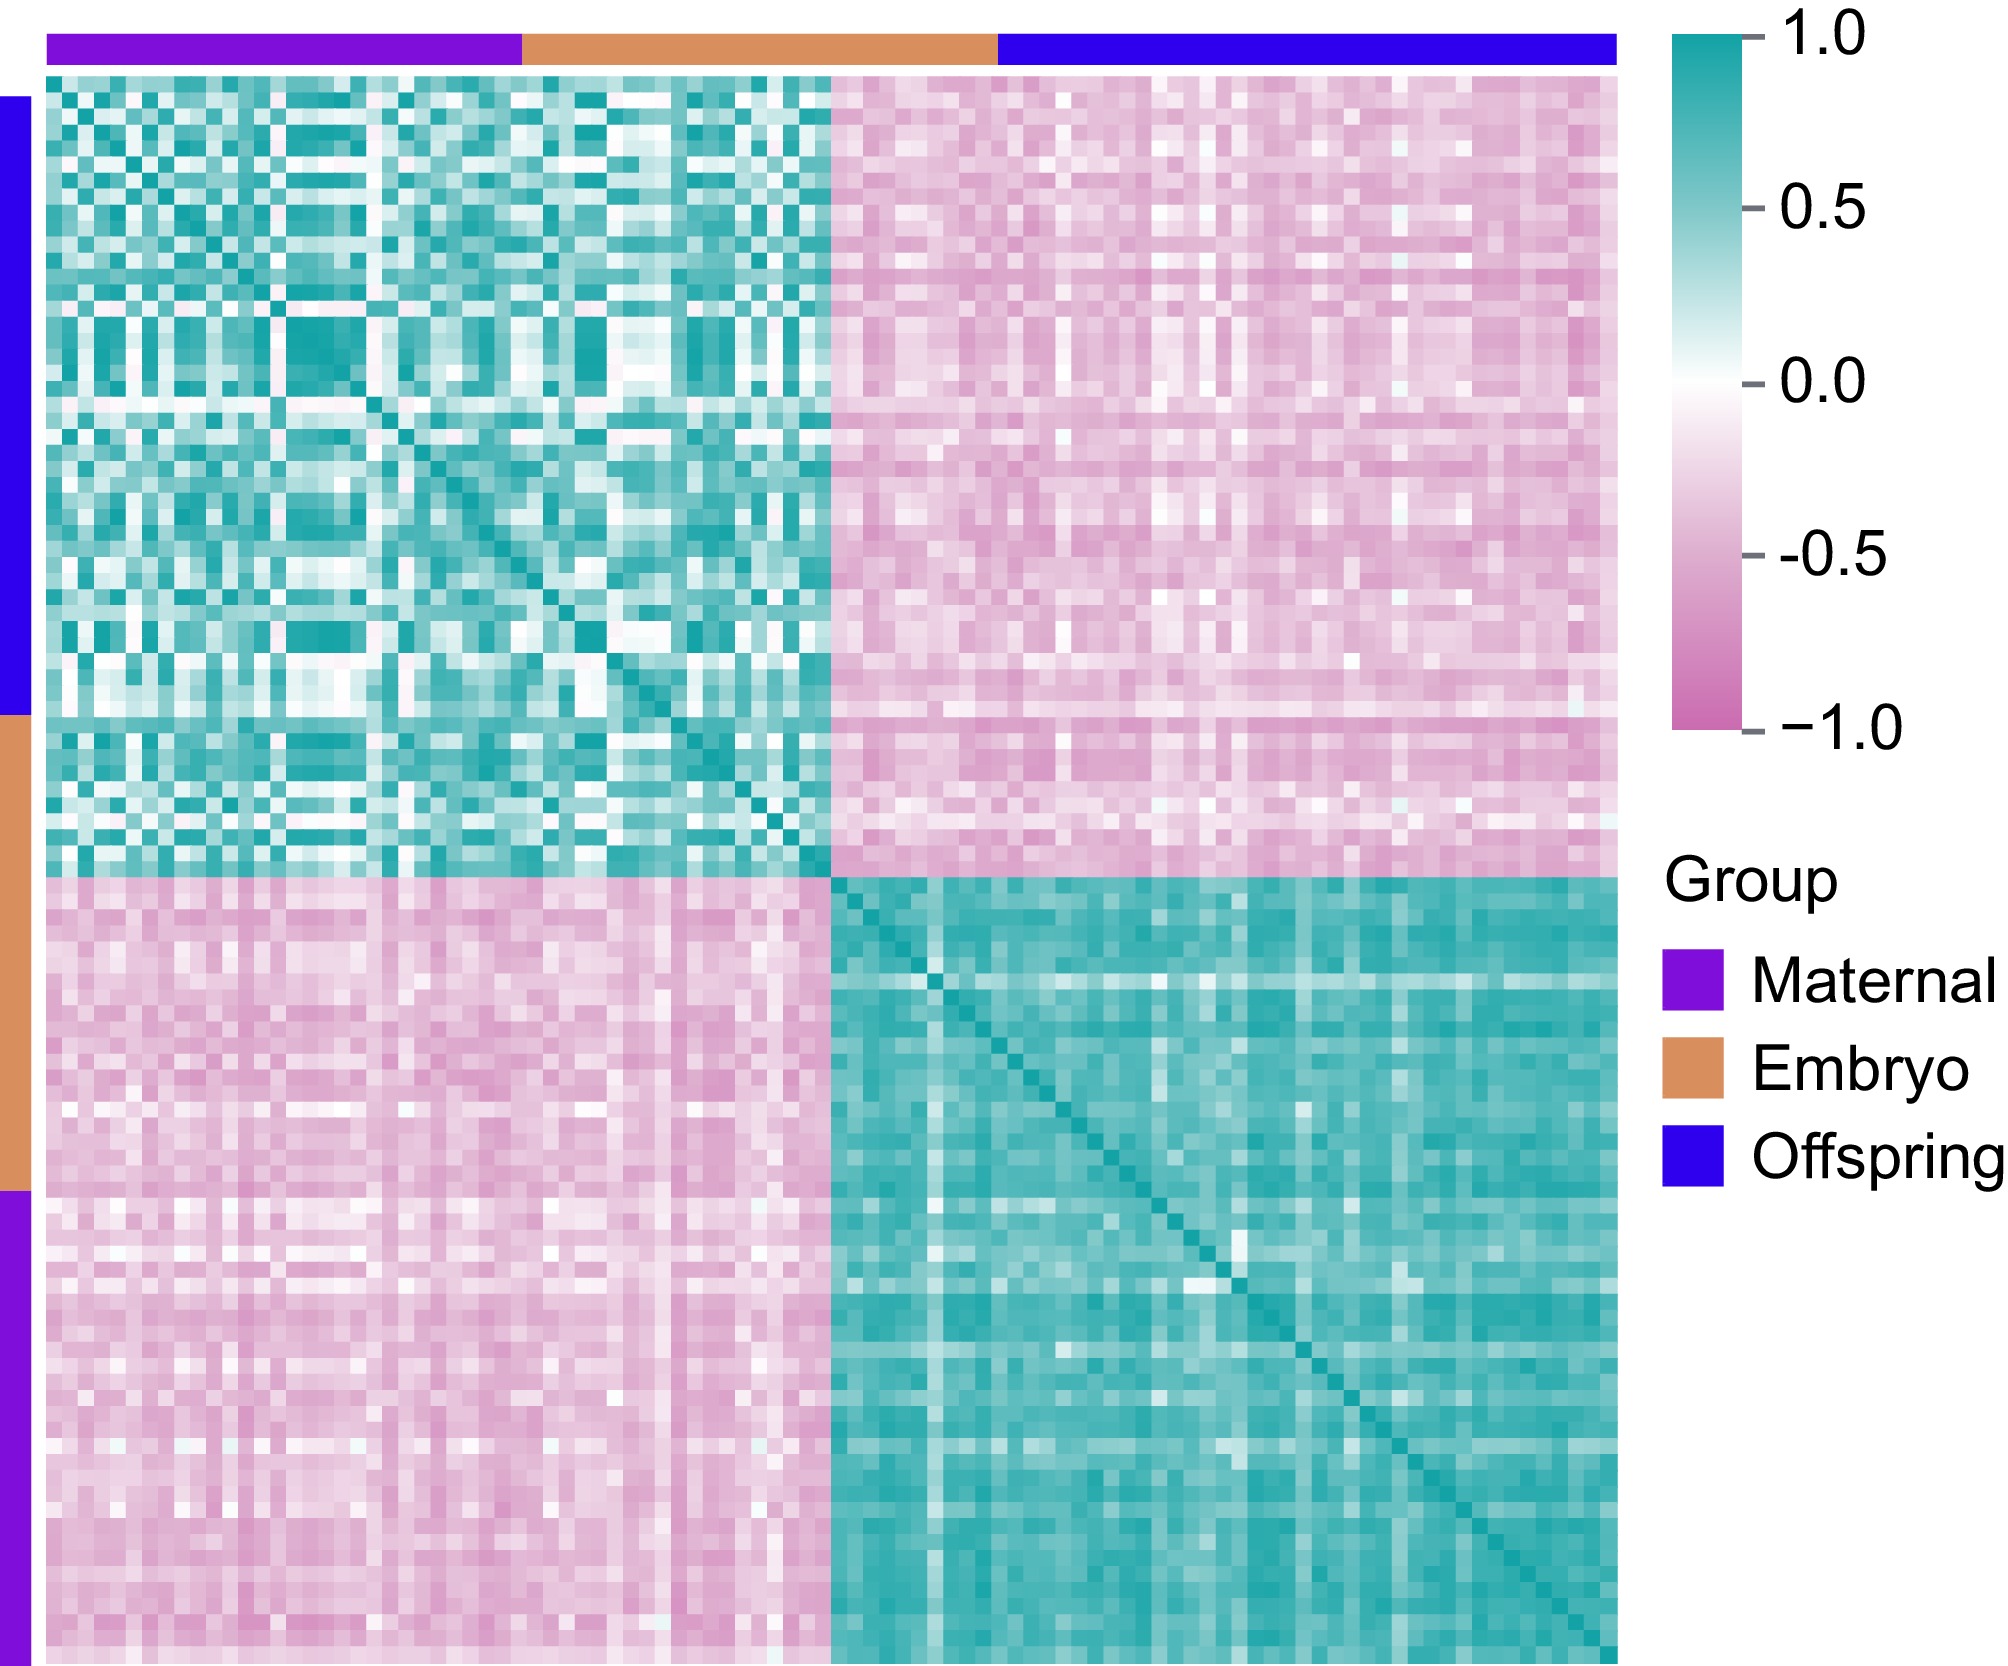
Figure 5.
Correlation analysis of DEGs in maternal, embryo, and offspring stages. Pink represents negative correlations, while cyan indicates positive correlations.
-
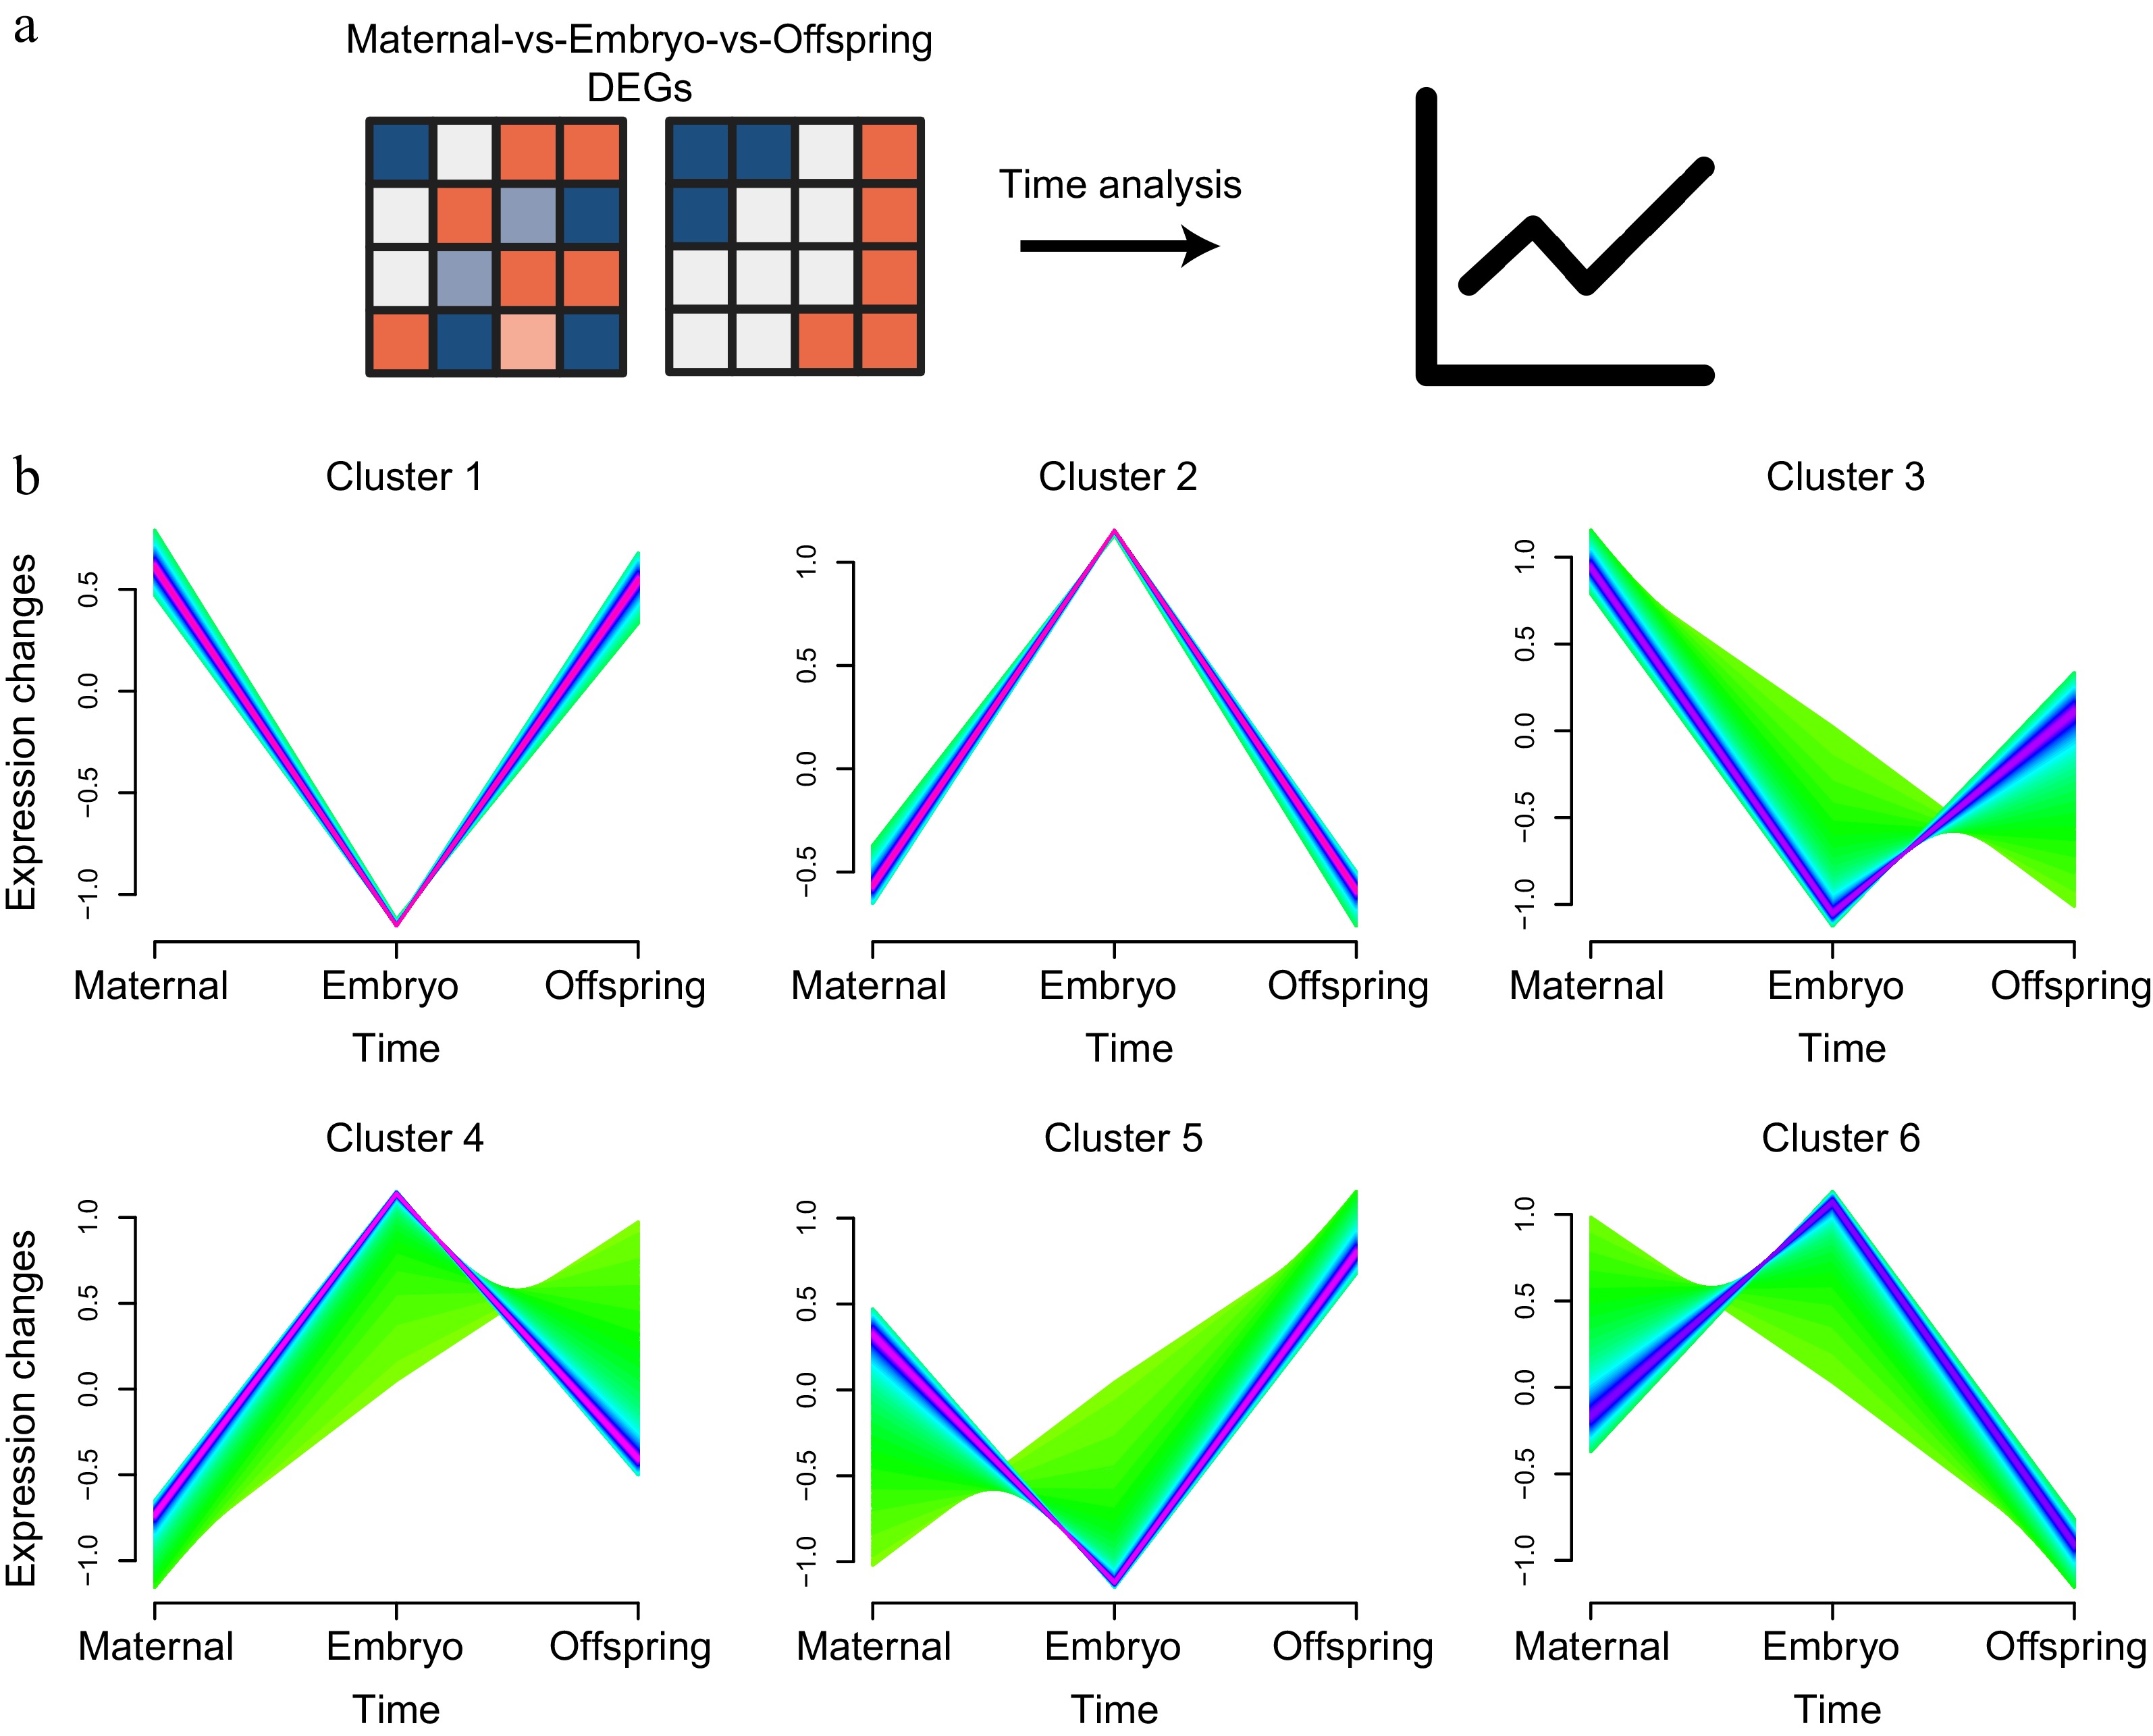
Figure 6.
Time analysis of liver expression profiles across maternal, embryo, and offspring stages. (a) Workflow diagram of the time analysis. (b) Cluster analysis of DEGs across the three stages, showing six distinct clusters.
-
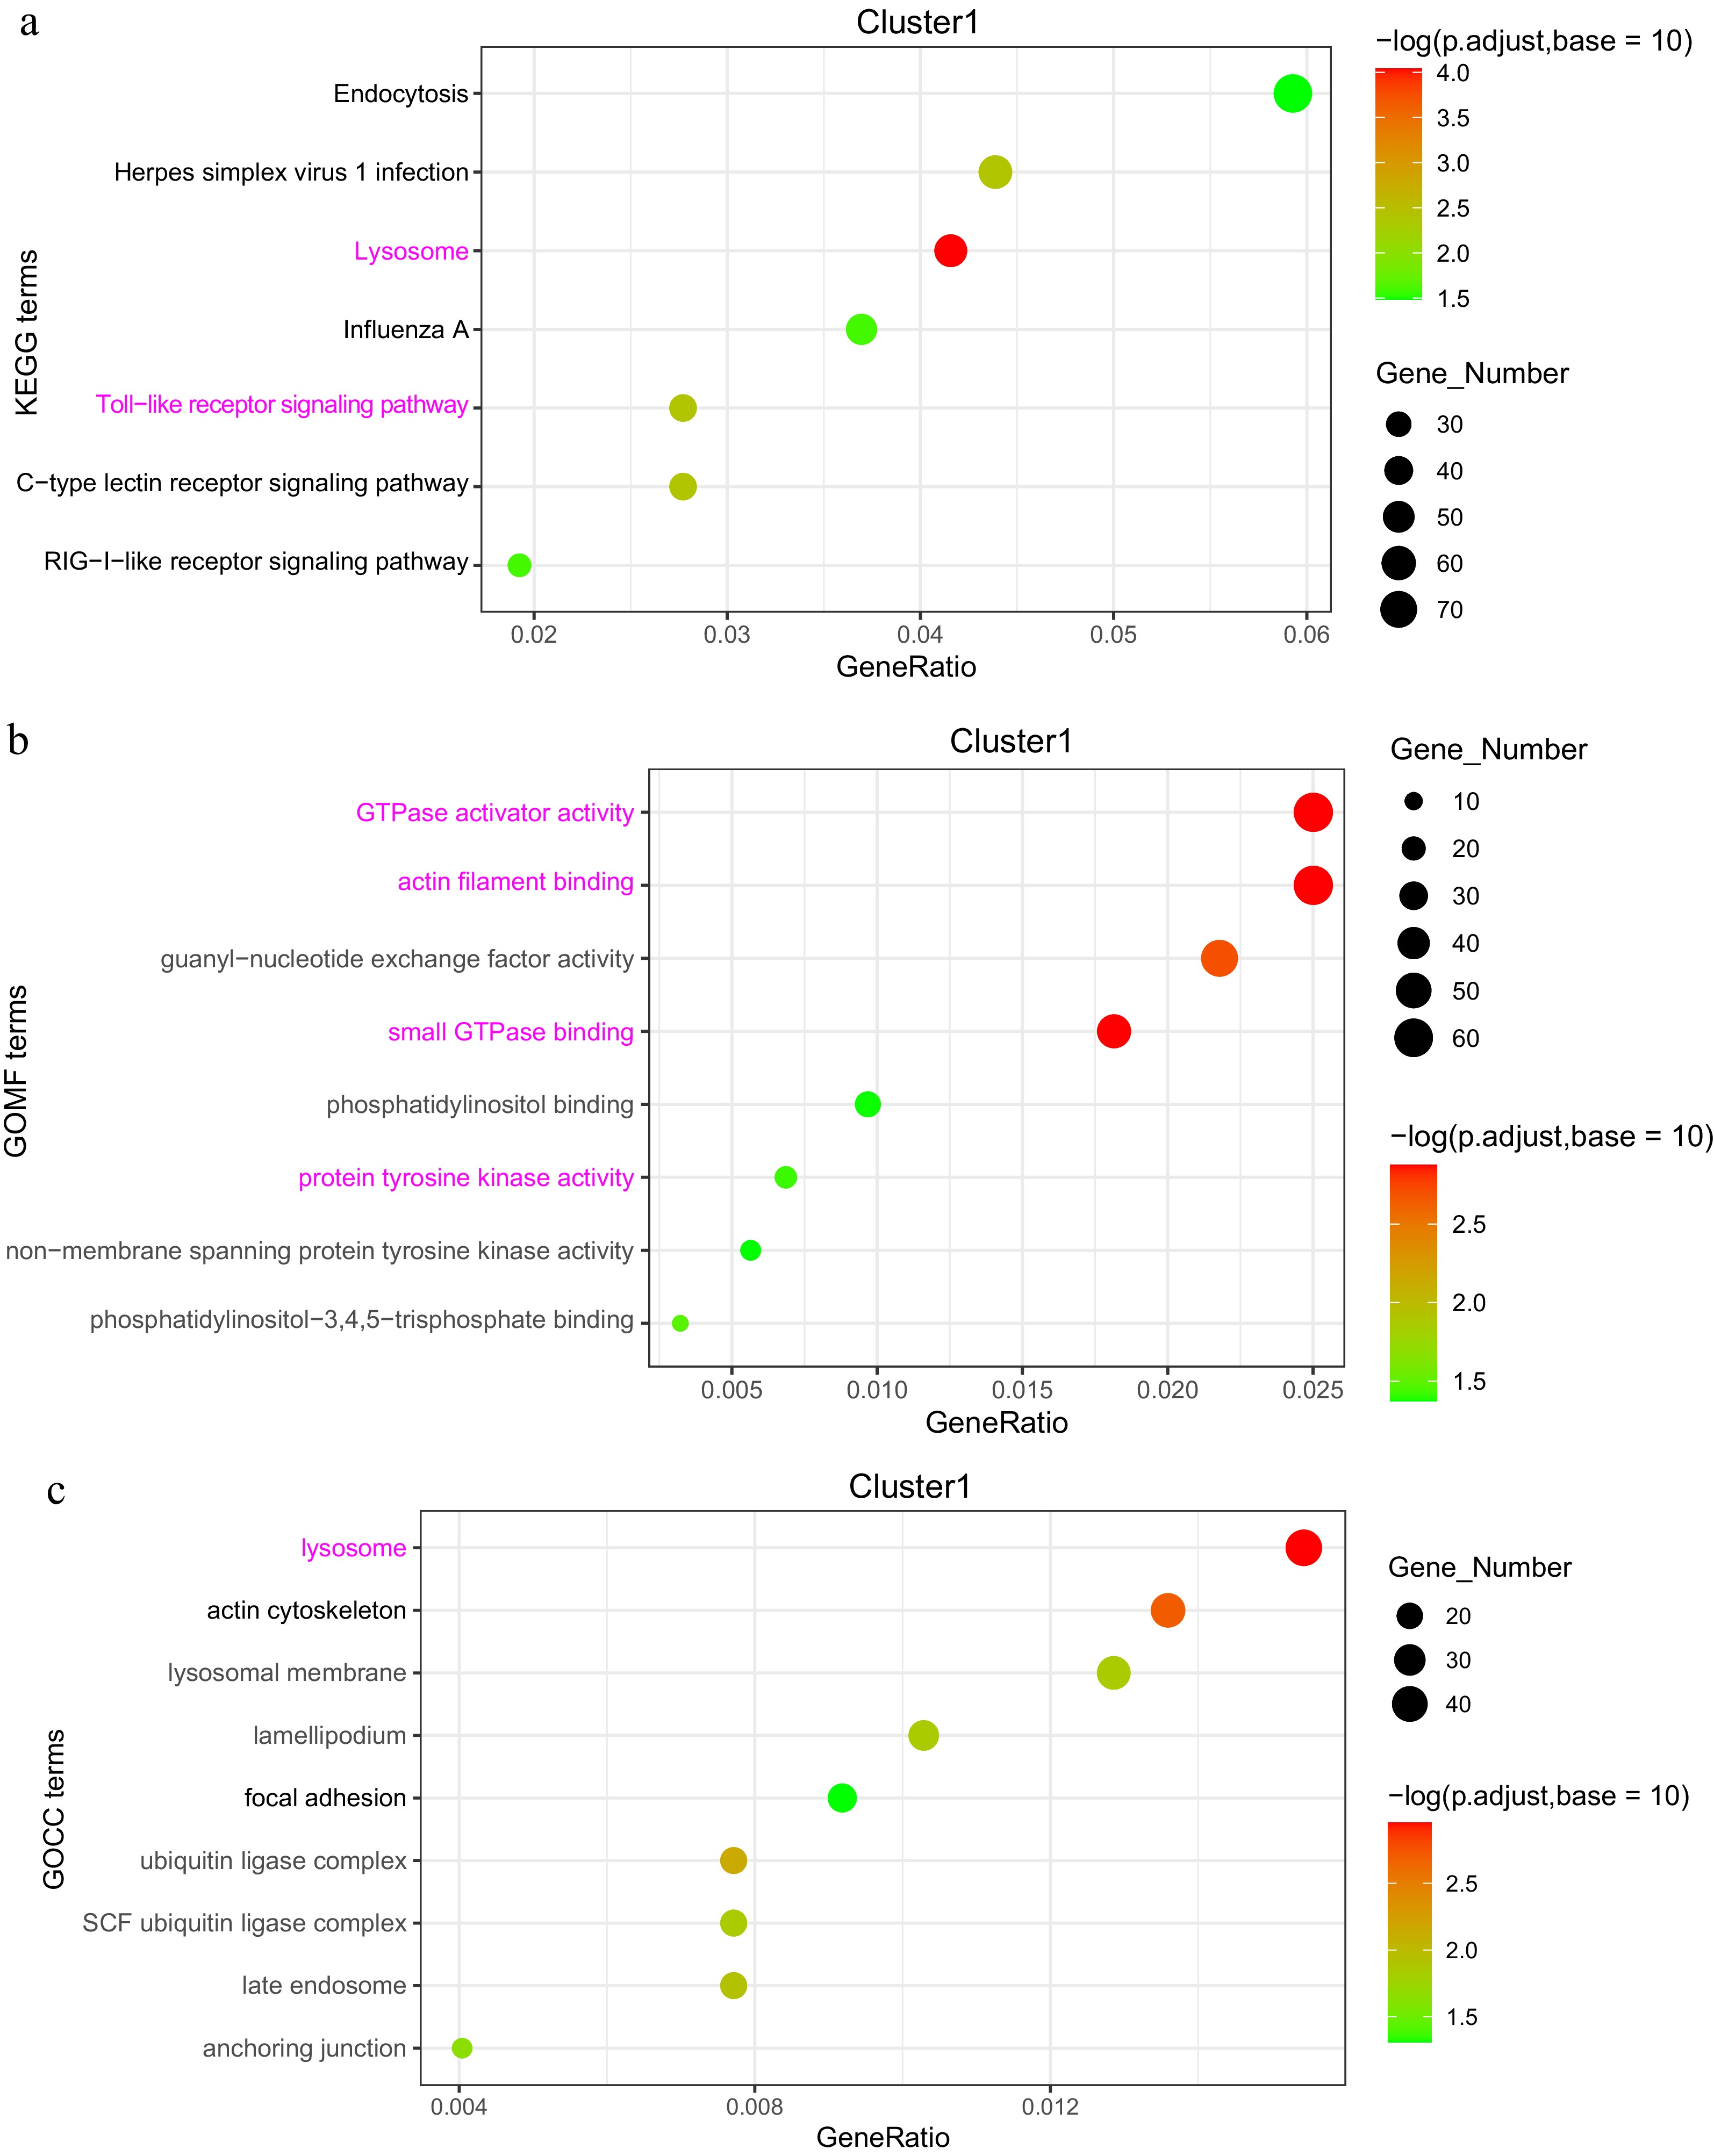
Figure 7.
Analysis of DEGs in the 'high-low-high' expression pattern (Cluster 1). (a) KEGG enrichment analysis of DEGs. (b) GOMF (Gene Ontology Molecular Function) enrichment analysis of DEGs. (c) GOCC (Gene Ontology Cellular Component) enrichment analysis of DEGs.
-
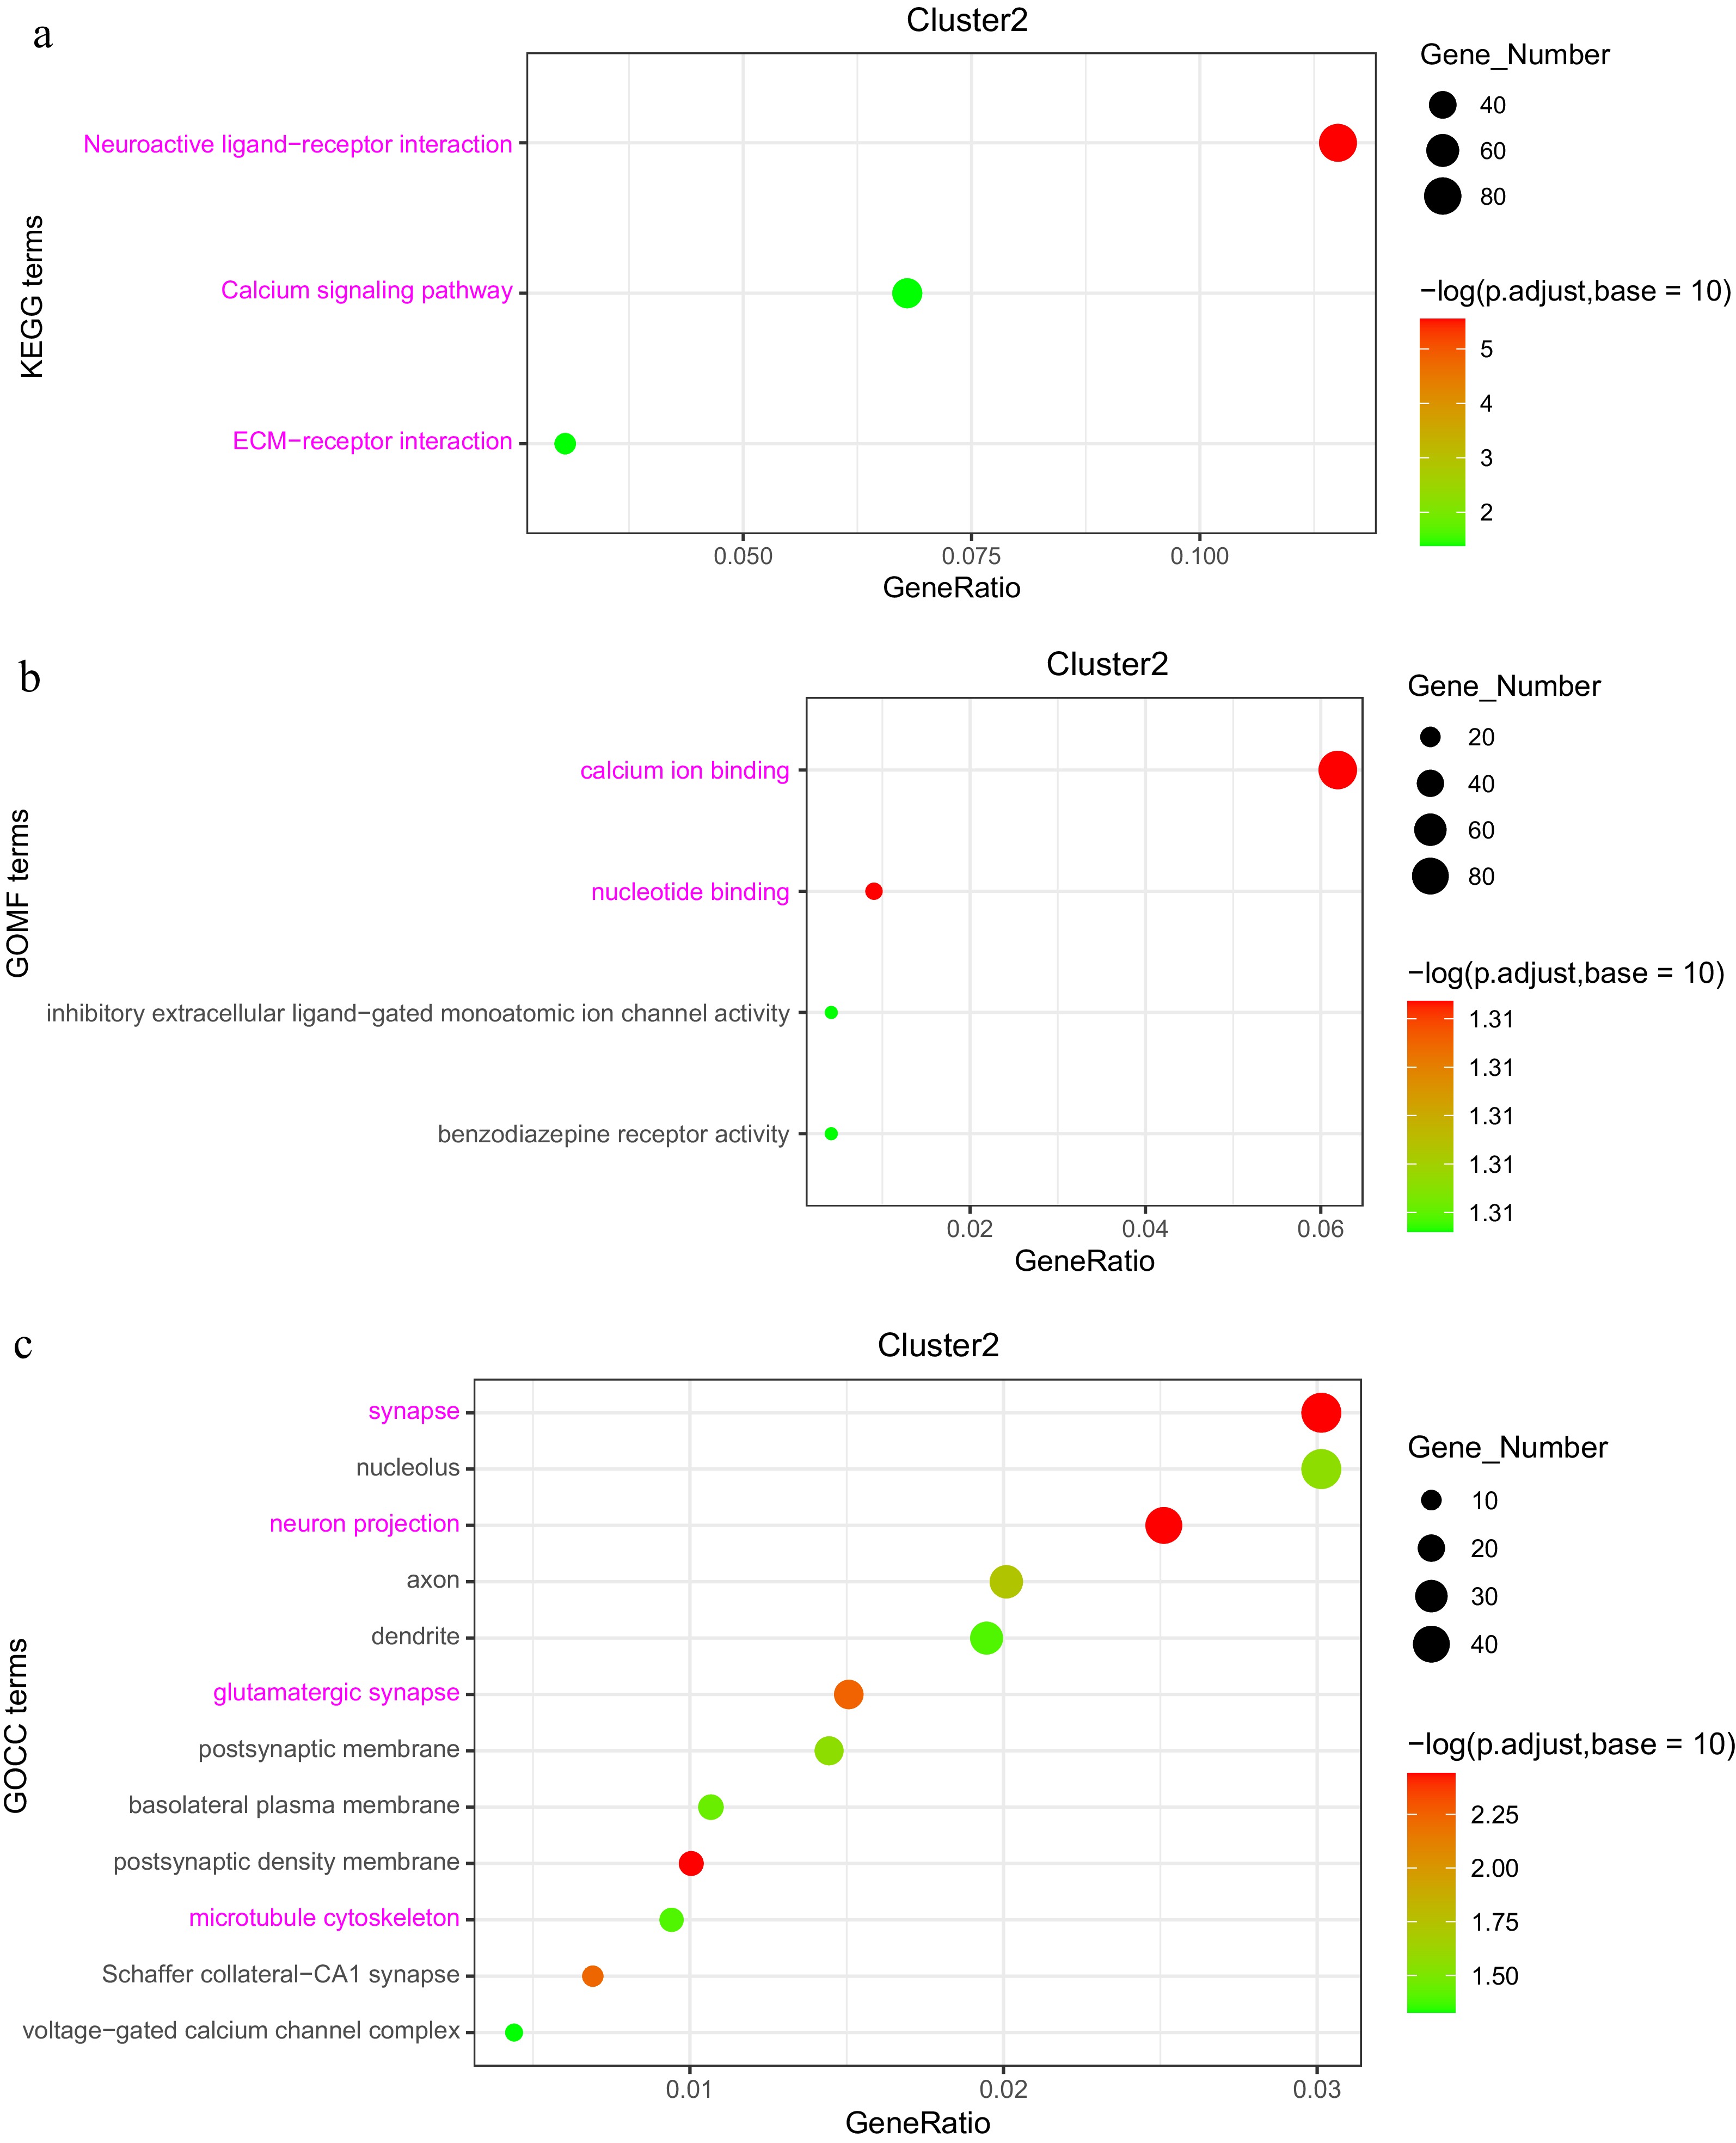
Figure 8.
Analysis of DEGs in the 'low-high-low' expression pattern (Cluster 2). (a) KEGG enrichment analysis of DEGs. (b) GOMF (Gene Ontology Molecular Function) enrichment analysis of DEGs. (c) GOCC (Gene Ontology Cellular Component) enrichment analysis of DEGs.
-
Sample name Clean_reads Raw_bases Q20 Q30 GC_content HISAT mapped HISAT Uniquely mapped Breeder1 38362812 11040224580 96.53% 93.16% 51.99% 88.5% 75.78% Breeder2 37847708 10940622840 96.28% 92.59% 56.15% 72.49% 52.58% Breeder3 34672132 9846336276 96.52% 93.10% 51.41% 89.35% 77.37% Breeder4 40482362 11592999936 96.48% 93.04% 51.51% 89.92% 76.84% Breeder5 37196291 10296891108 96.86% 93.68% 49.86% 92.12% 82.17% Breeder6 40958805 12072458664 96.59% 93.12% 59.16% 59.57% 32.85% Breeder7 35709829 10510141572 96.47% 92.96% 56.03% 75.07% 55.02% Breeder8 33669242 9914908752 96.79% 93.69% 51.39% 90.98% 78.82% Embryo1 40485557 11654523972 95.90% 91.83% 52.50% 89.67% 74.26% Embryo2 37432078 11069231292 96.48% 93.04% 51.34% 88.79% 74.68% Embryo3 39065142 11126909556 96.26% 92.59% 51.62% 88.44% 75.25% Embryo4 35508865 10322469360 96.30% 92.65% 51.73% 90.69% 77.44% Embryo5 37076246 10837283688 96.46% 92.94% 52.48% 89.48% 74.28% Embryo6 39932521 11473593264 96.23% 92.53% 51.41% 89.88% 77.24% Embryo7 43619518 12556149732 96.36% 92.82% 51.46% 90.88% 76.31% Embryo8 36859302 10562648292 96.14% 92.44% 53.36% 76.34% 58.07% Offspring1 35823274 10444364028 96.48% 93.12% 50.66% 91.04% 78.7% Offspring2 38678468 11108159496 96.39% 92.82% 53.96% 81.18% 63.04% Offspring3 38105455 11117678544 96.33% 92.70% 55.17% 79.53% 62.3% Offspring4 38509142 11038901832 95.75% 91.71% 51.52% 88.96% 74.73% Offspring5 38362812 11040224580 96.53% 93.16% 51.99% 88.5% 75.78% Offspring6 37847708 10940622840 96.28% 92.59% 56.15% 72.49% 52.58% Offspring7 34672132 9846336276 96.52% 93.10% 51.41% 89.35% 77.37% Table 1.
RNA-seq read statistics.
-
Compare group Down Up Total Liver Maternal-vs-Embryo 1540 4569 6109 Embryo-vs-Offspring 1449 4578 6027 Maternal-vs-Offspring 26 38 64 Table 2.
Pairwise comparison of up and downregulated DEGs between maternal, embryo and offspring chickens in liver.
-
Gene Log2FC p−value Regulation IGFBP1 −3.4921 < 0.0001 down ABI3BP −4.4975 < 0.0001 down MT3 −4.7465 < 0.0001 down DIO3 −4.8438 < 0.0001 down CHRNA7 −5.4058 < 0.0001 down TTLL2 −5.4702 < 0.0001 down NEGR1 −6.8204 < 0.0001 down SREBF2 −2.9490 6.11E-303 down PDK4 −2.8915 3.08E-300 down IRF1 −3.0829 4.15E-299 down IGFBP1, Insulin-like Growth Factor Binding Protein 1; ABI3BP, ABI Family Member 3 Binding Protein; MT3, Metallothionein 3; DIO3, Deiodinase Iodothyronine Type III; CHRNA7, Cholinergic Receptor Nicotinic Alpha 7 Subunit; TTLL2, Tubulin Tyrosine Ligase Like 2; NEGR1, Neuronal Growth Regulator 1; SREBF2, Sterol Regulatory Element Binding Transcription Factor 2; PDK4, Pyruvate Dehydrogenase Kinase 4; IRF1, Interferon Regulatory Factor 1. Table 3.
Maternal-vs-embryo Top 10 DEGs.
-
Gene Log2FC p−value Regulation MT3 5.1899 < 0.0001 up ABI3BP 4.5664 < 0.0001 up IGFBP1 4.1745 < 0.0001 up HMGCR −3.1252 < 0.0001 down IGFALS −3.7697 < 0.0001 down IGFBP4 −3.8229 < 0.0001 down FASN −5.1979 < 0.0001 down IGF1 −6.3826 < 0.0001 down CDKN2B −6.4335 < 0.0001 down ELOVL2 −6.2947 < 0.0001 down MT3, Metallothionein 3; ABI3BP, ABI Family Member 3 Binding Protein; IGFBP1, Insulin-like growth factor-binding protein 1; HMGCR, 3-Hydroxy-3-Methylglutaryl-CoA Reductase; IGFALS, Insulin-like growth factor-binding protein; acid labile subunit; IGFBP4, Insulin-like growth factor-binding protein 4; FASN, Fatty Acid Synthase; IGF1, Insulin-like growth factor 1; CDKN2B, Cyclin Dependent Kinase Inhibitor 2B; ELOVL2,ELOVL Fatty Acid Elongase 2. Table 4.
Embryo-vs-Offspring Top 10 DEGs.
Figures
(8)
Tables
(4)