-

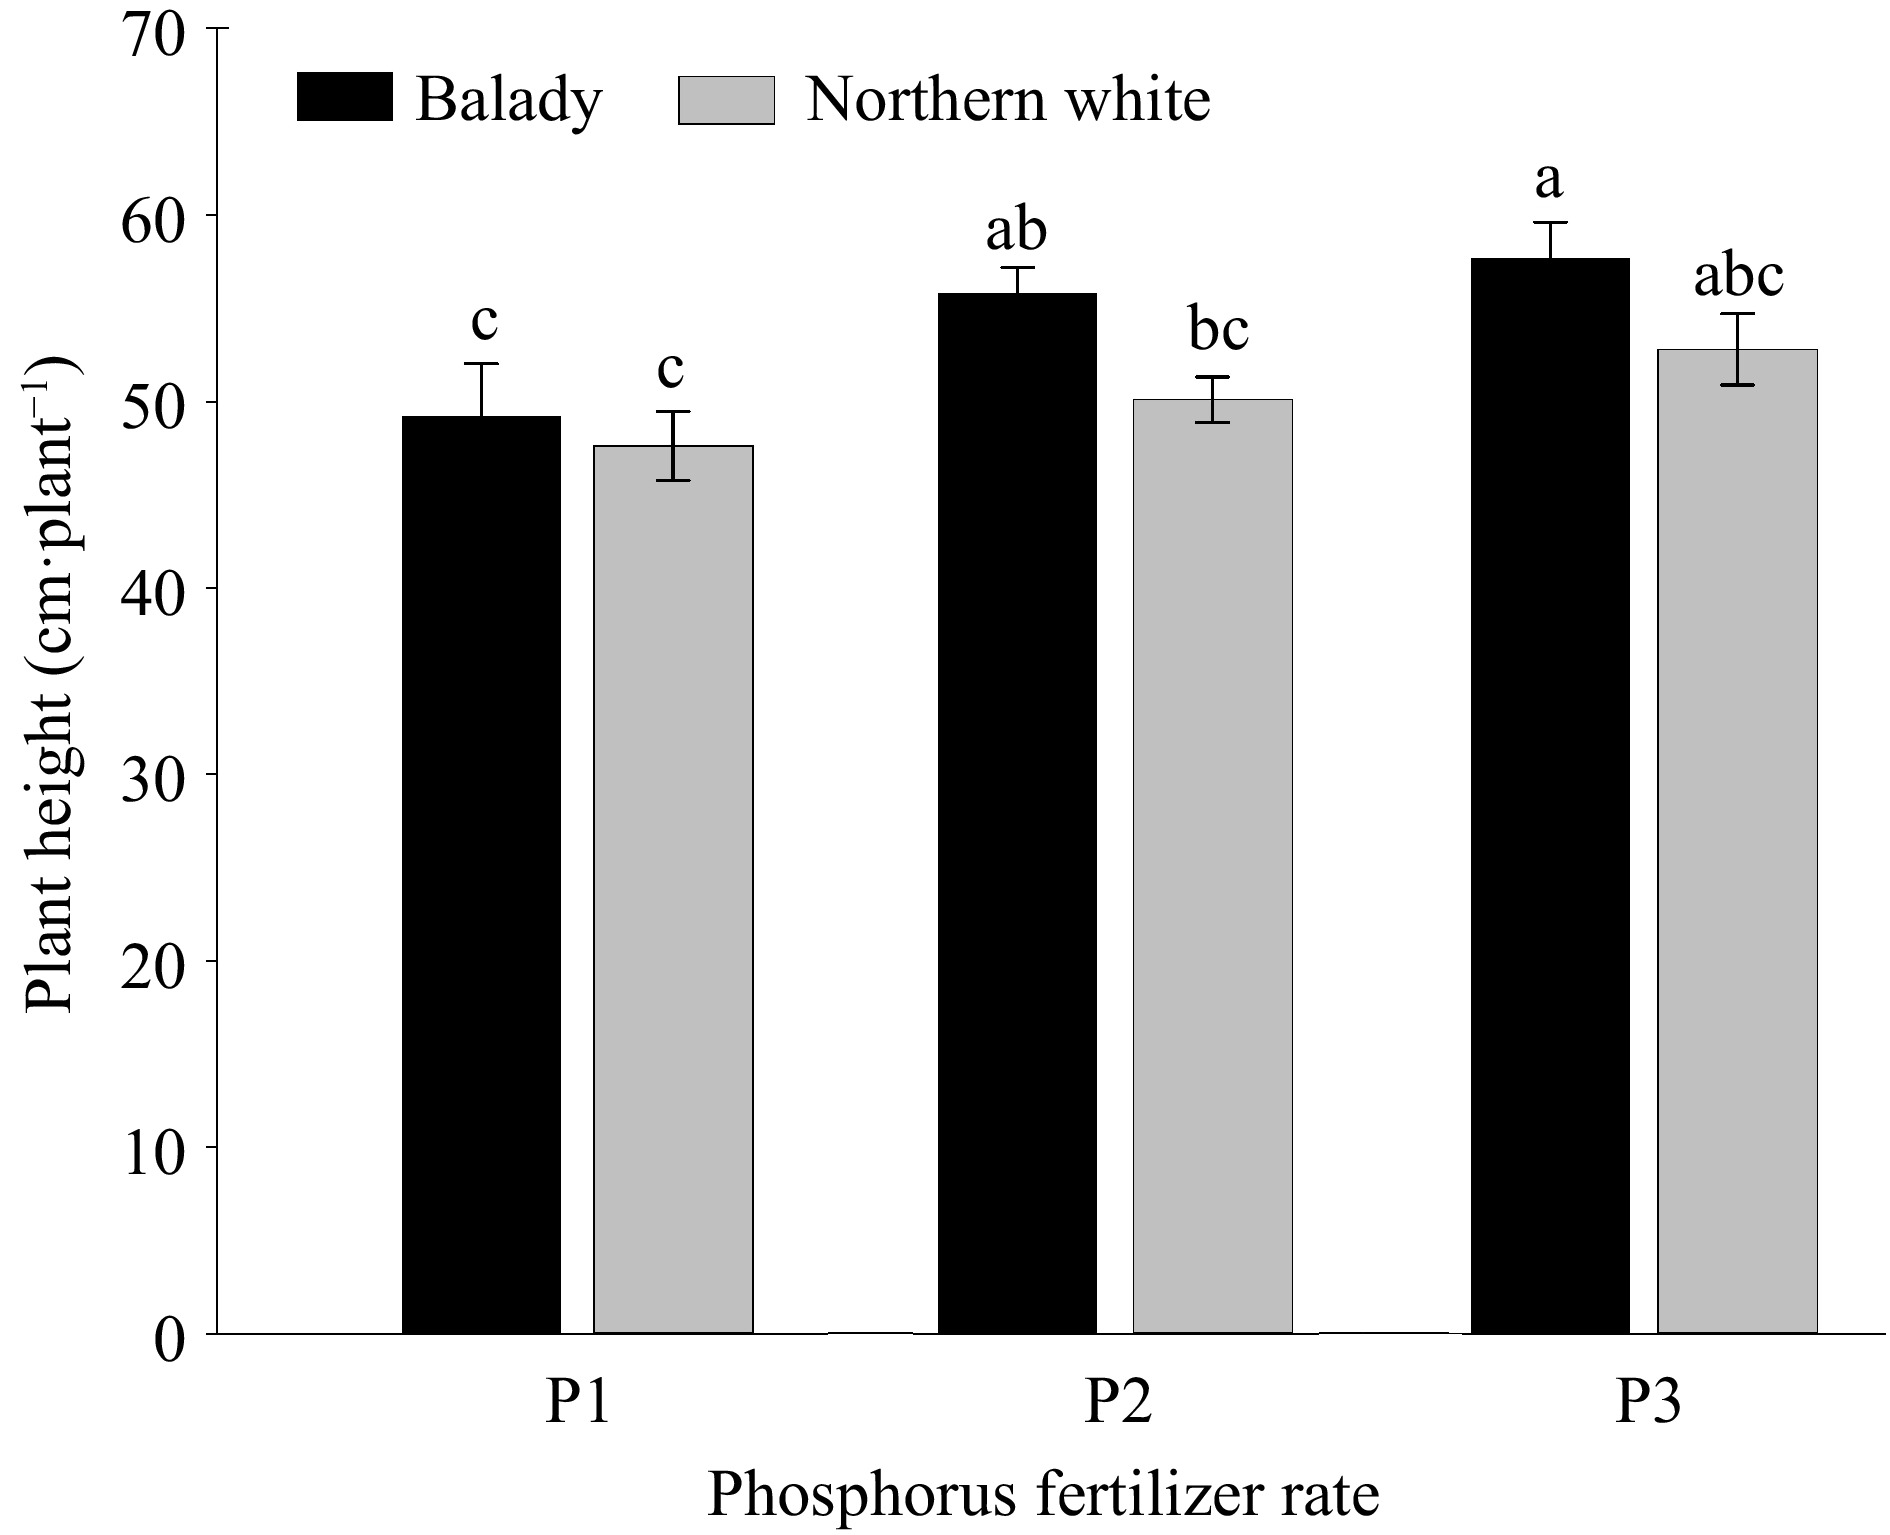
Figure 1.
Plant height of two garlic varieties ('Balady' and 'Northern White') grown under different P fertilizer rates [0 (control) (P1), 43.6 (P2) and 87.2 (P3) kg P ha−1)] in calcareous soil. Data represents ± SE. Different letters indicate significant differences at p ≤ 0.05.
-

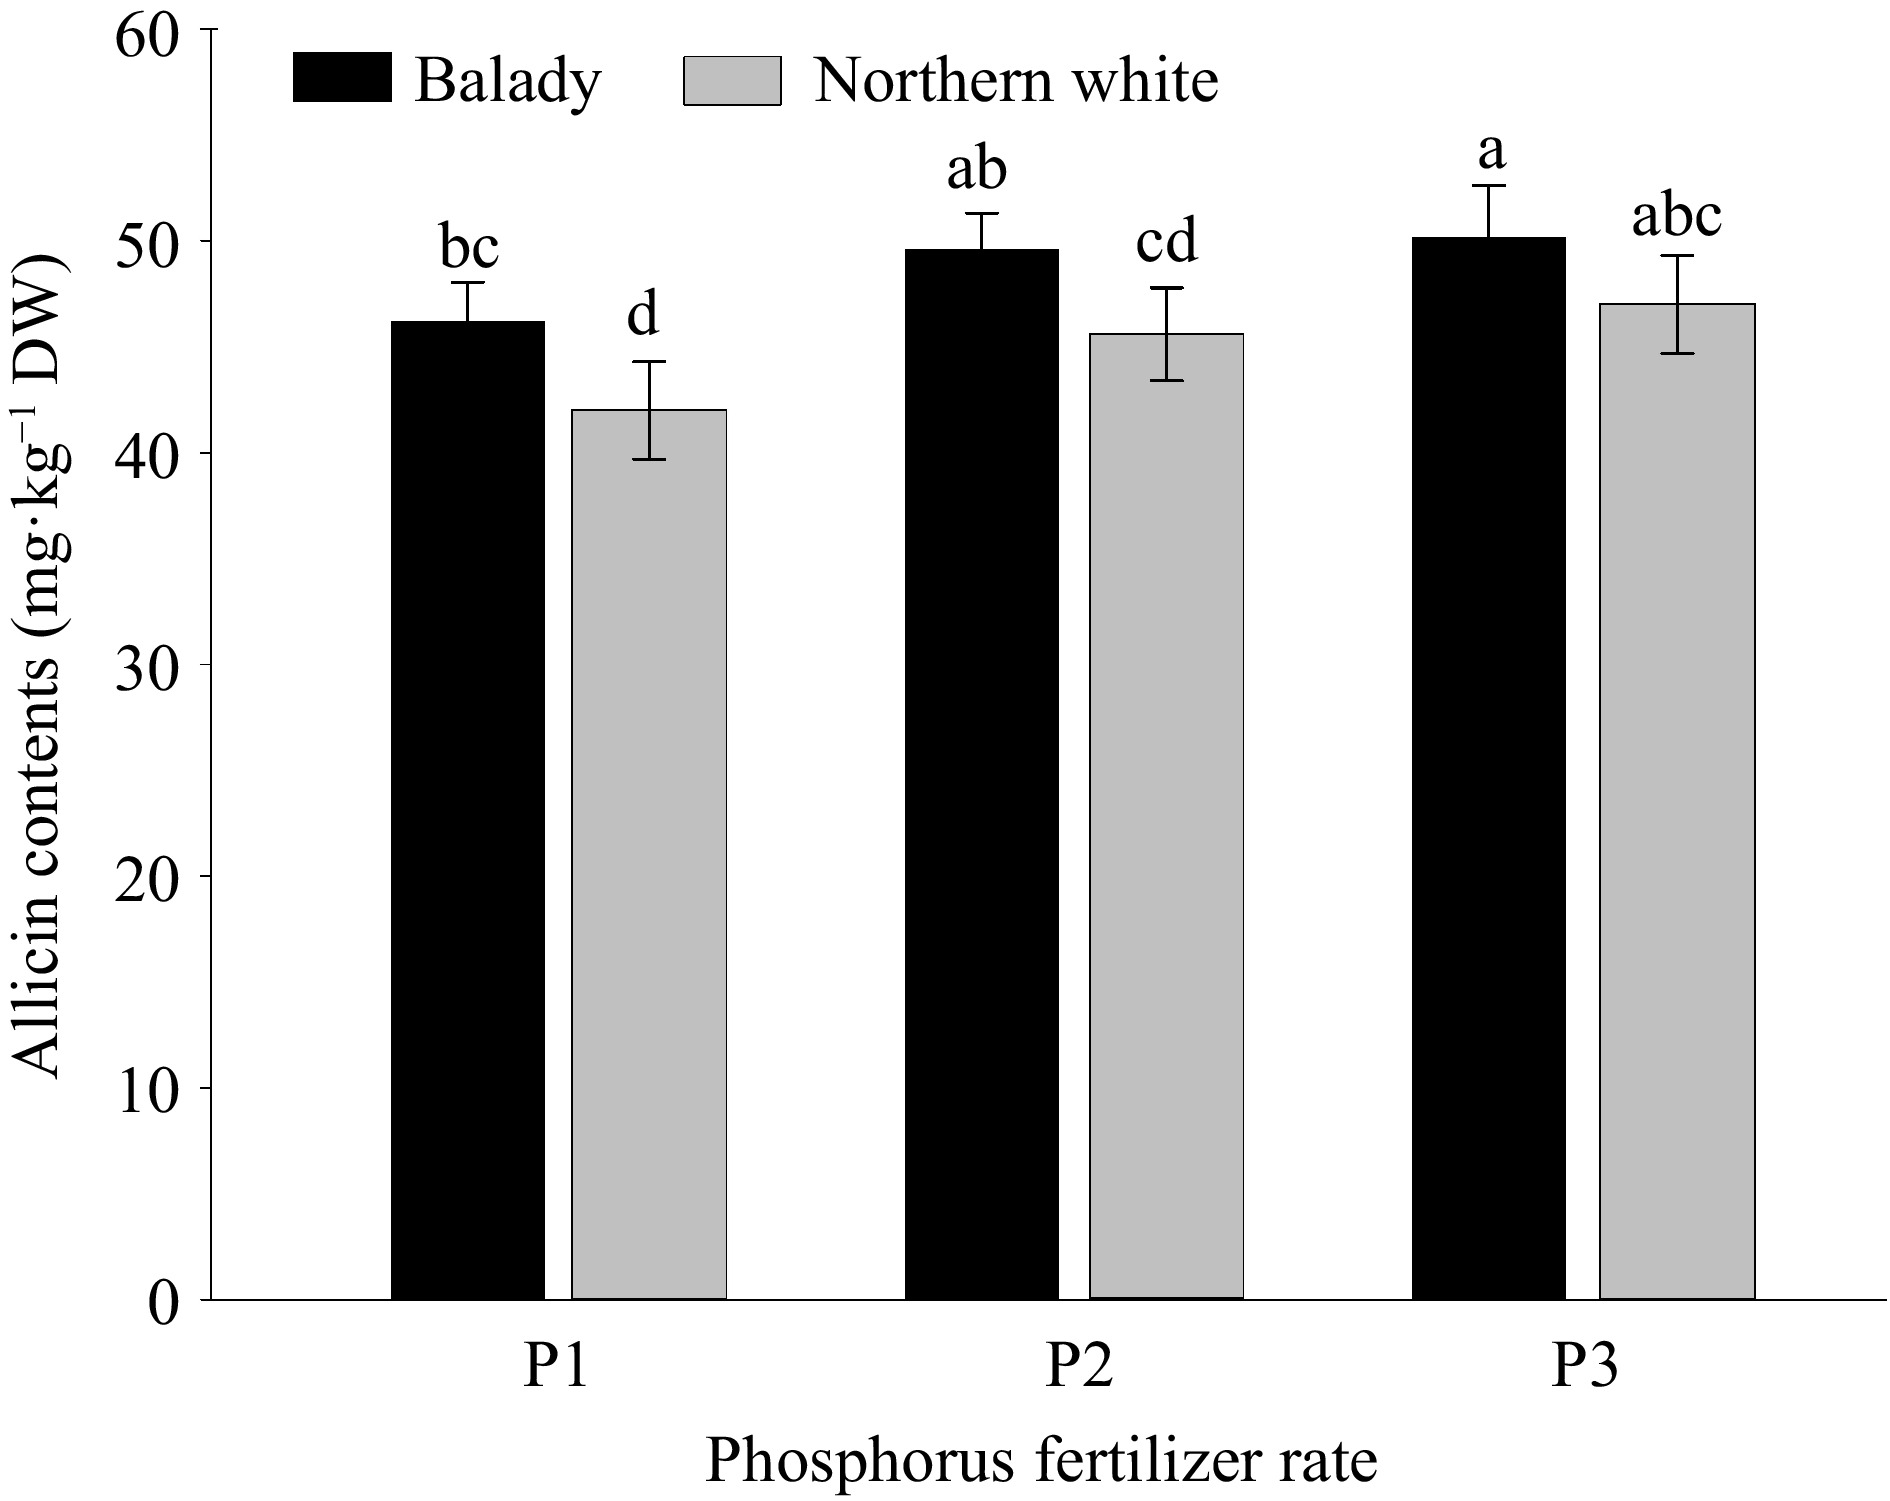
Figure 2.
Allicin contents in cloves of two garlic varieties ('Balady' and 'Northern White') grown under different P fertilizer rates [0 (control) (P1), 43.6 (P2) and 87.2 (P3) kg P ha−1)] in calcareous soil. Data represents ± SE. Different letters indicate significant differences at p ≤ 0.05.
-
Texture pH Salinity EC
(dS·m−1)OM CaCO3 Total
NAvailable (mg·kg−1) P K Ca Mg Na Silty clay 8.2 0.8 1.1% 16.7% 0.8% 6.0 156 171 51 0.61 EC, electrical conductivity; OM, organic matter. Table 1.
Physical and chemical properties of the experimental soil before planting (0−25 cm).
-
Phosphorus rate Variety Bulb yield
(ton·ha−1)Mean bulb weight (g) Cloves no. bulb−1 P1 'Balady' 8.01 ± 0.50 d 25.4 ± 1.4 c 6.33 ± 0.9 c 'Northern White' 7.40 ± 0.13 d 23.9 ± 1.6 c 6.20 ± 0.5 c P2 'Balady' 10.5 ± 0.26 b 31.0 ± 3.0 ab 7.93 ± 0.7 ab 'Northern White' 9.31 ± 0.62 c 27.7 ± 2.0 bc 7.57 ± 0.6 b P3 'Balady' 11.9 ± 0.31 a 34.1 ± 3.0 a 8.53 ± 0.3 a 'Northern White' 10.6 ± 0.59 b 30.4 ± 2.2 ab 8.00 ± 0.5 ab Significance Phosphorus (P) *** ** *** Cultivar (C) ** * NS P × C NS NS NS Different letters in the same column indicate significant difference at p ≤ 0.05. * p ≤ 0.05, ** p ≤ 0.01, *** p ≤ 0.0001. NS, not significant. SE, standard error. Table 2.
Mean (± SE) of bulb yield, mean bulb weight and number of cloves/bulb of two garlic varieties ('Balady' and 'Northern White') grown under different P fertilizer rates [0 (control) (P1), 43.6 (P2) and 87.2 (P3) kg P ha−1)] in calcareous soil.
-
P
fertilizer rateVariety Plant growth¶ Bulb yield (%) Mean bulb
weight (%)Cloves no.
per bulb (%)P2 'Balady' 31 ± 3.0 22 ± 3.3 25 ± 1.7 'Northern White' 26 ± 2.1 16 ± 2.1 22 ± 2.6 P3 'Balady' 49 ± 7.4 34 ± 3.9 35 ± 4.4 'Northern White' 43 ± 4.9 27 ± 3.5 29 ± 2.7 ¶ Plant growth (PG) change (%) = ((PGPF – PGnonPF) × 100)/PGnonPF). Table 3.
Percentage (± SE) change in plant growth (bulb yield, bulb weight and cloves number per bulb) of two garlic varieties ('Balady' and 'Northern White') grown at P fertilizer (PF) or no added P fertilizer (nonPF) in calcareous soil.
-
Phosphorus rate Variety N P K Ca Mg mg·g−1 DM P1 'Balady' 2.43 ± 0.10 bc 2.26 ± 0.06 e 15.5 ± 0.06 bc 2.47 ± 0.13 d 0.59 ± 0.04 c 'Northern White' 2.36 ± 0.08 c 2.20 ± 0.02 e 14.6 ± 0.06 c 2.63 ± 0.08 d 0.65 ± 0.09 bc P2 'Balady' 2.65 ± 0.11 a 2.76 ± 0.03 c 16.0 ± 0.07 ab 4.15 ± 0.08 b 0.76 ± 0.08 ab 'Northern White' 2.55 ± 0.05 ab 2.53 ± 0.07 d 15.3 ± 0.08 bc 4.43 ± 0.13 a 0.83 ± 0.09 a P3 'Balady' 2.57 ± 0.11ab 3.40 ± 0.14 a 16.7 ± 0.04 a 3.09 ± 0.07 c 0.79 ± 0.12 ab 'Northern White' 2.44 ± 0.08 bc 3.13 ± 0.13 b 16.1 ± 0.04 ab 3.26 ± 0.13 c 0.87 ± 0.10 a Significance Phosphorus (P) * *** ** ** ** Cultivar (C) * ** * ** NS P × C NS NS NS NS NS Different letters in the same column indicate significant difference at p ≤ 0.05. * p ≤ 0.05, ** p ≤ 0.01, *** p ≤ 0.0001. NS, not significant. SE, standard error. Table 4.
Mean (± SE) of macronutrient concentrations in cloves of two garlic varieties ('Balady' and 'Northern White') grown under different P fertilizer rates [0 (control) (P1), 43.6 (P2) and 87.2 (P3) kg P ha–1)] in calcareous soil.
-
P fertilizer rate Variety Nutrient content§ N (%) P (%) K (%) Ca (%) Mg (%) P2 'Balady' 9.1 ± 1.4 22.1 ± 3.0 3.2 ± 0.6 68.0 ± 6.6 28.8 ± 3.3 'Northern White' 8.1 ± 1.2 15.0 ± 1.8 4.8 ± 0.7 68.4 ± 5.7 27.7 ± 3.1 P3 'Balady' 5.8 ± 0.8 50.4 ± 5.4 7.7 ± 1.2 25.1 ± 4.4 33.9 ± 5.0 'Northern White' 3.4 ± 0.6 42.3 ± 5.5 10.3 ± 1.4 23.9 ± 3.8 33.8 ± 4.6 §Nutrient content (NC) change (%) = ((NCPF – NCnonPF) ×100)/NCnonPF). Table 5.
Percentage (± SE) change in fodder mineral (N, P, K, Ca, and Mg) contents of two garlic cultivars ('Balady' and 'Northern White') grown at P fertilizer (PF) or no added P fertilizer (nonPF) in calcareous soil.
-
Phosphorus rate Variety Total phenols (mg GAE
100 g−1)Total flavonoids (mg CE 100 g−1) Antioxidant activity (%) P1 'Balady' 582 ± 27 b 56.9 ± 5.2 c 27.6 ± 1.3 bcd 'Northern White' 535 ± 38 c 53.2 ± 4.9 c 24.2 ± 1.6 d P2 'Balady' 684 ± 25 a 71.7 ± 6.2 a 34.8 ± 1.8 a 'Northern White' 663 ± 18 a 63.5 ± 4.4 b 29.3 ± 2.8 bc P3 'Balady' 591 ± 23 b 58.3 ± 4.1 bc 30.7 ± 2.7 b 'Northern White' 574 ± 19 bc 54.6 ± 3.9 c 26.5 ± 3.2 cd Different letters in the same column indicate significant difference at p ≤ 0.05. * p ≤ 0.05, ** p ≤ 0.01, *** p ≤ 0.0001. NS, not significant. SE, standard error. Table 6.
Mean (± SE) of total phenols and flavonoids contents and antioxidant activity (dry matter basis) in cloves of two garlic varieties ('Balady' and 'Northern White') grown under different P fertilizer rates [0 (control) (P1), 43.6 (P2) and 87.2 (P3) kg P ha−1)] in calcareous soil.
-
Phosphorus rate Variety Total
phenols
content(%)¶Total flavonoid content (%)§ Antioxidant activity (%)* P2 'Balady' 17.5 ± 2.0 23.0 ± 2.1 26.0 ± 3.4 'Northern White' 23.9 ± 2.2 16.3 ± 1.6 21.0 ± 3.0 P3 'Balady' 1.5 ± 0.2 2.5 ± 0.3 11.2 ± 1.3 'Northern White' 7.2 ± 0.5 2.6 ± 0.2 9.5 ± 1.2 ¶Phenol content (PC) change (%) = ((PCPF – PCnonPF) ×100)/PCnonPF). §Flavonoid content (FC) change (%) = ((FCPF – FCnonPF) × 100)/FCnonPF). *Antioxidant activity (AA) change (%) = ((AAPF – AAnonPF) × 100)/AAnonPF). Table 7.
Percentage (± SE) change in total phenols and flavonoids contents and antioxidant activity of two garlic cultivars ('Balady' and 'Northern White') grown at P fertilizer (PF) or no added P fertilizer (nonPF) in calcareous soil.
Figures
(2)
Tables
(7)