-
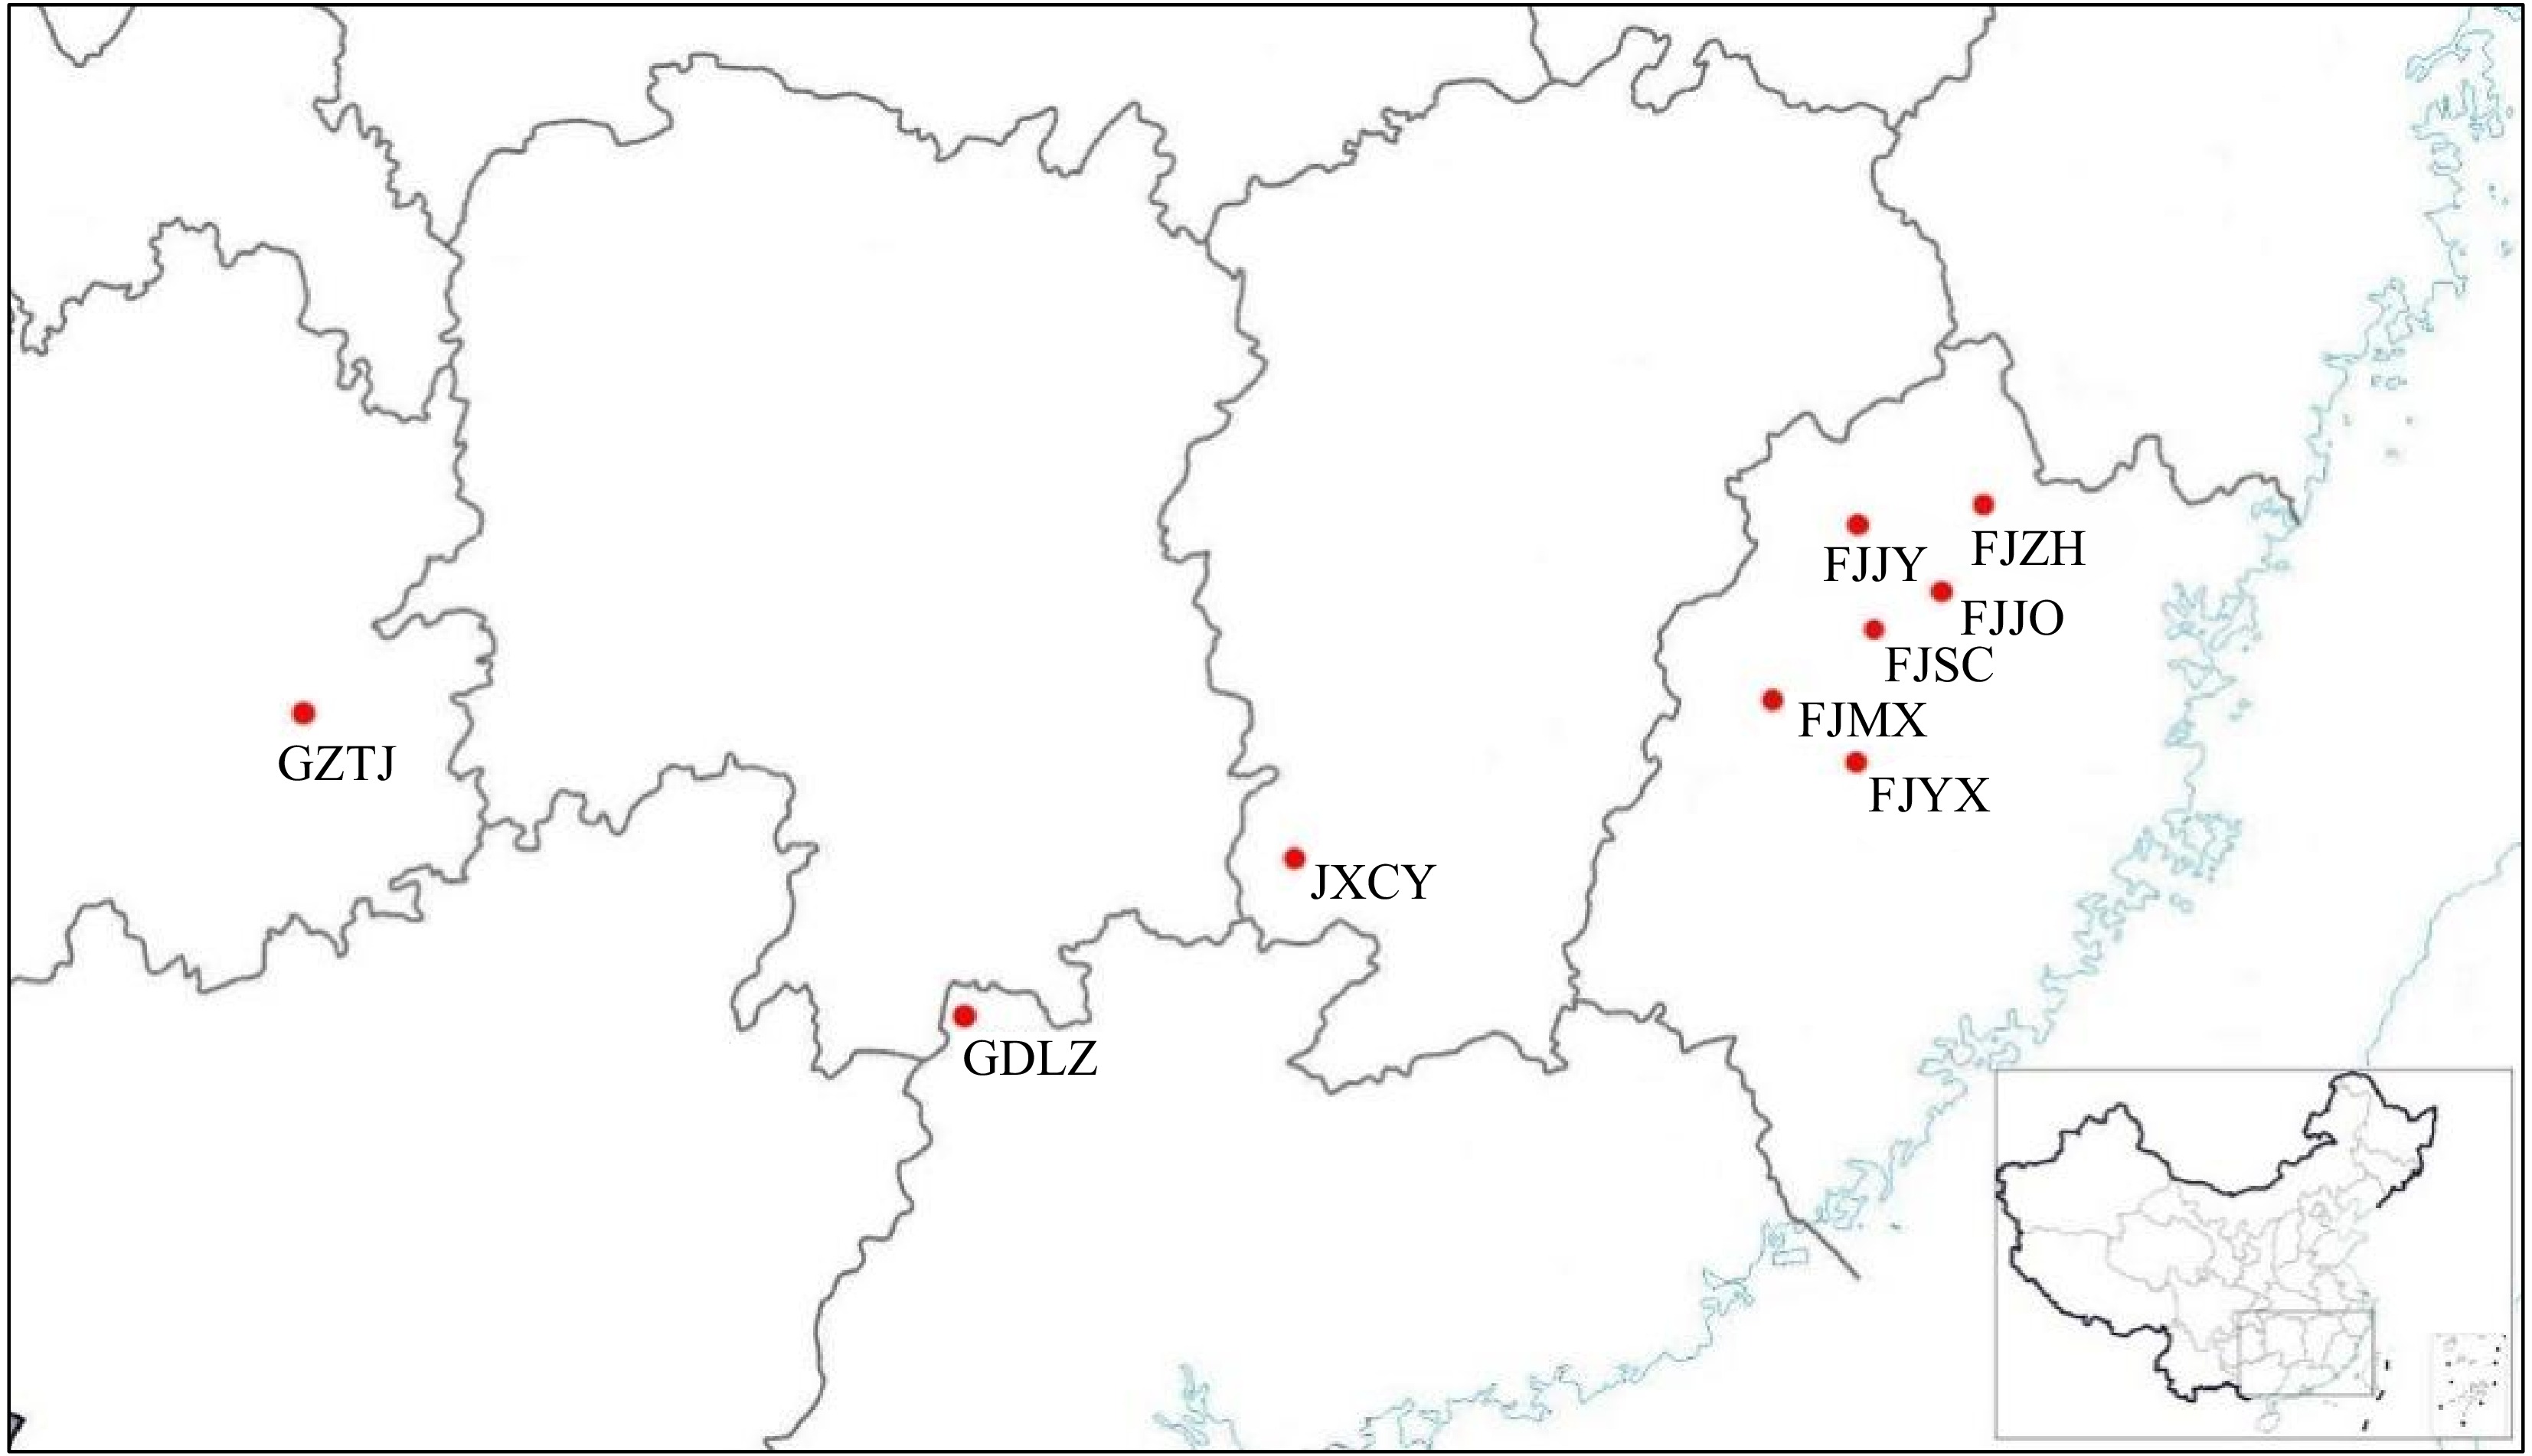
Figure 1.
Sampling locations of the natural populations of P. bournei.
-
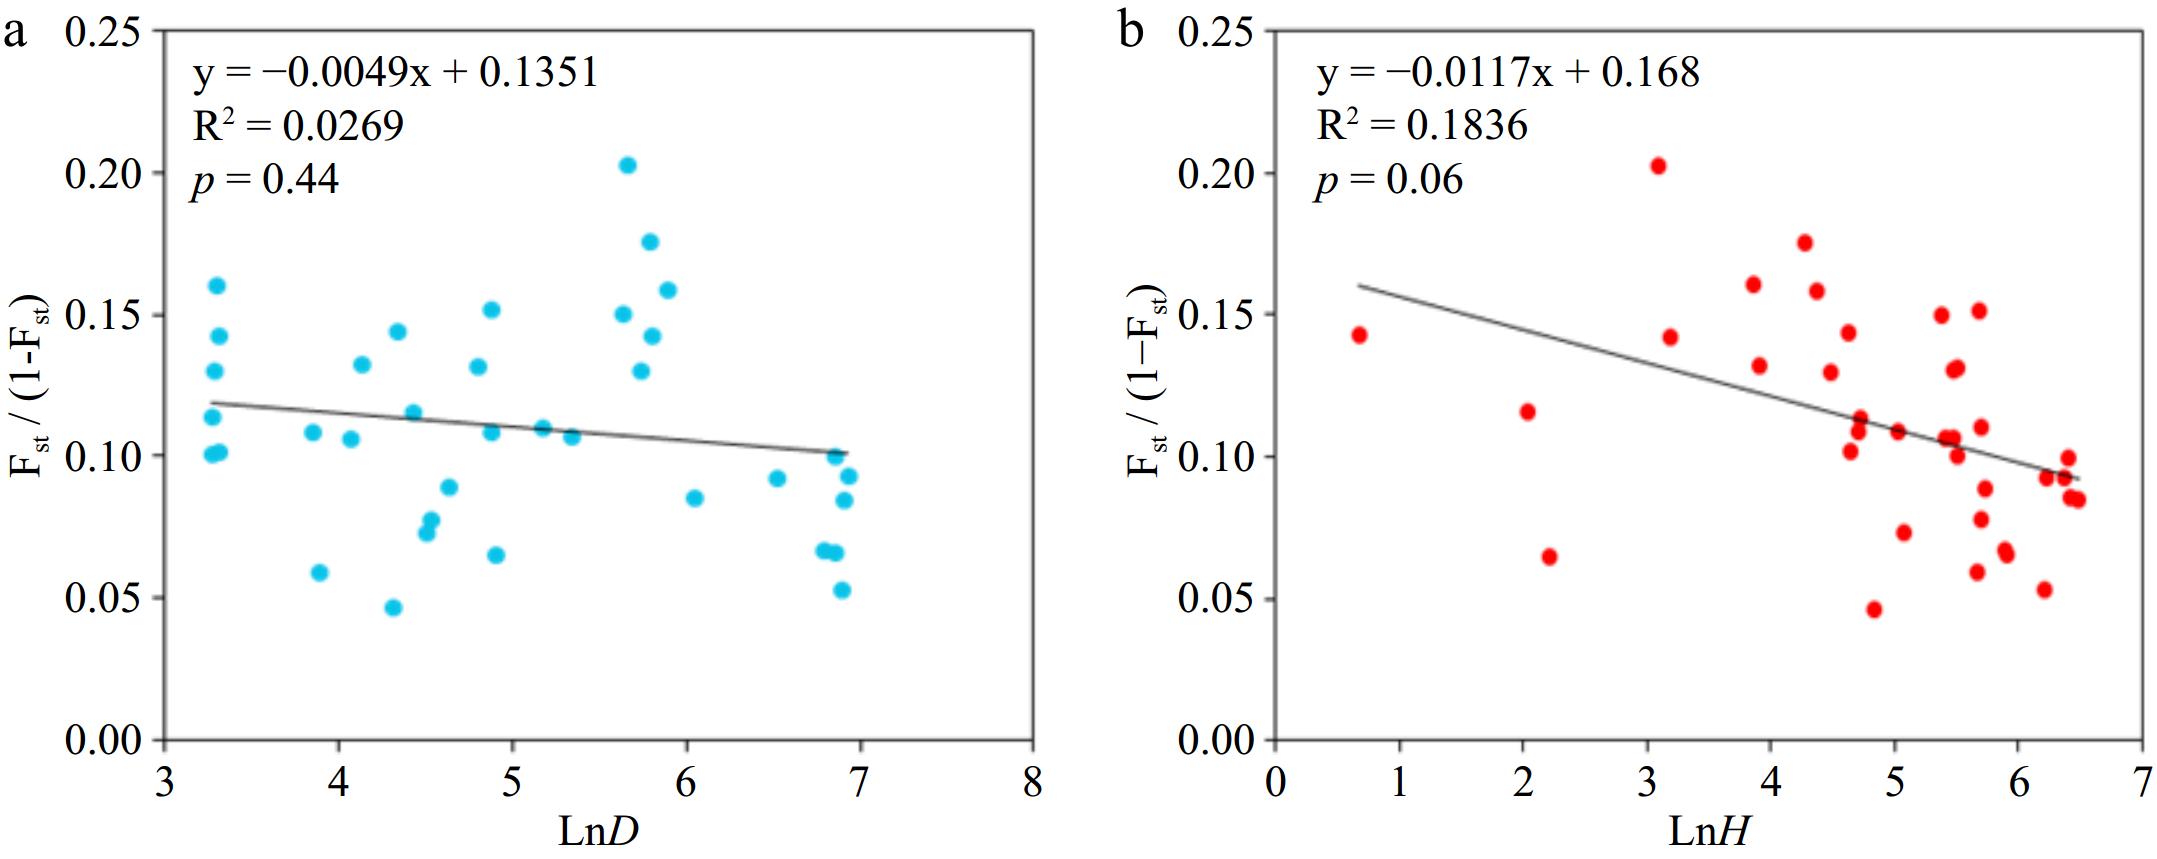
Figure 2.
Mantel test of genetic differentiation between (a) populations and geographical distance and (b) altitude difference.
-
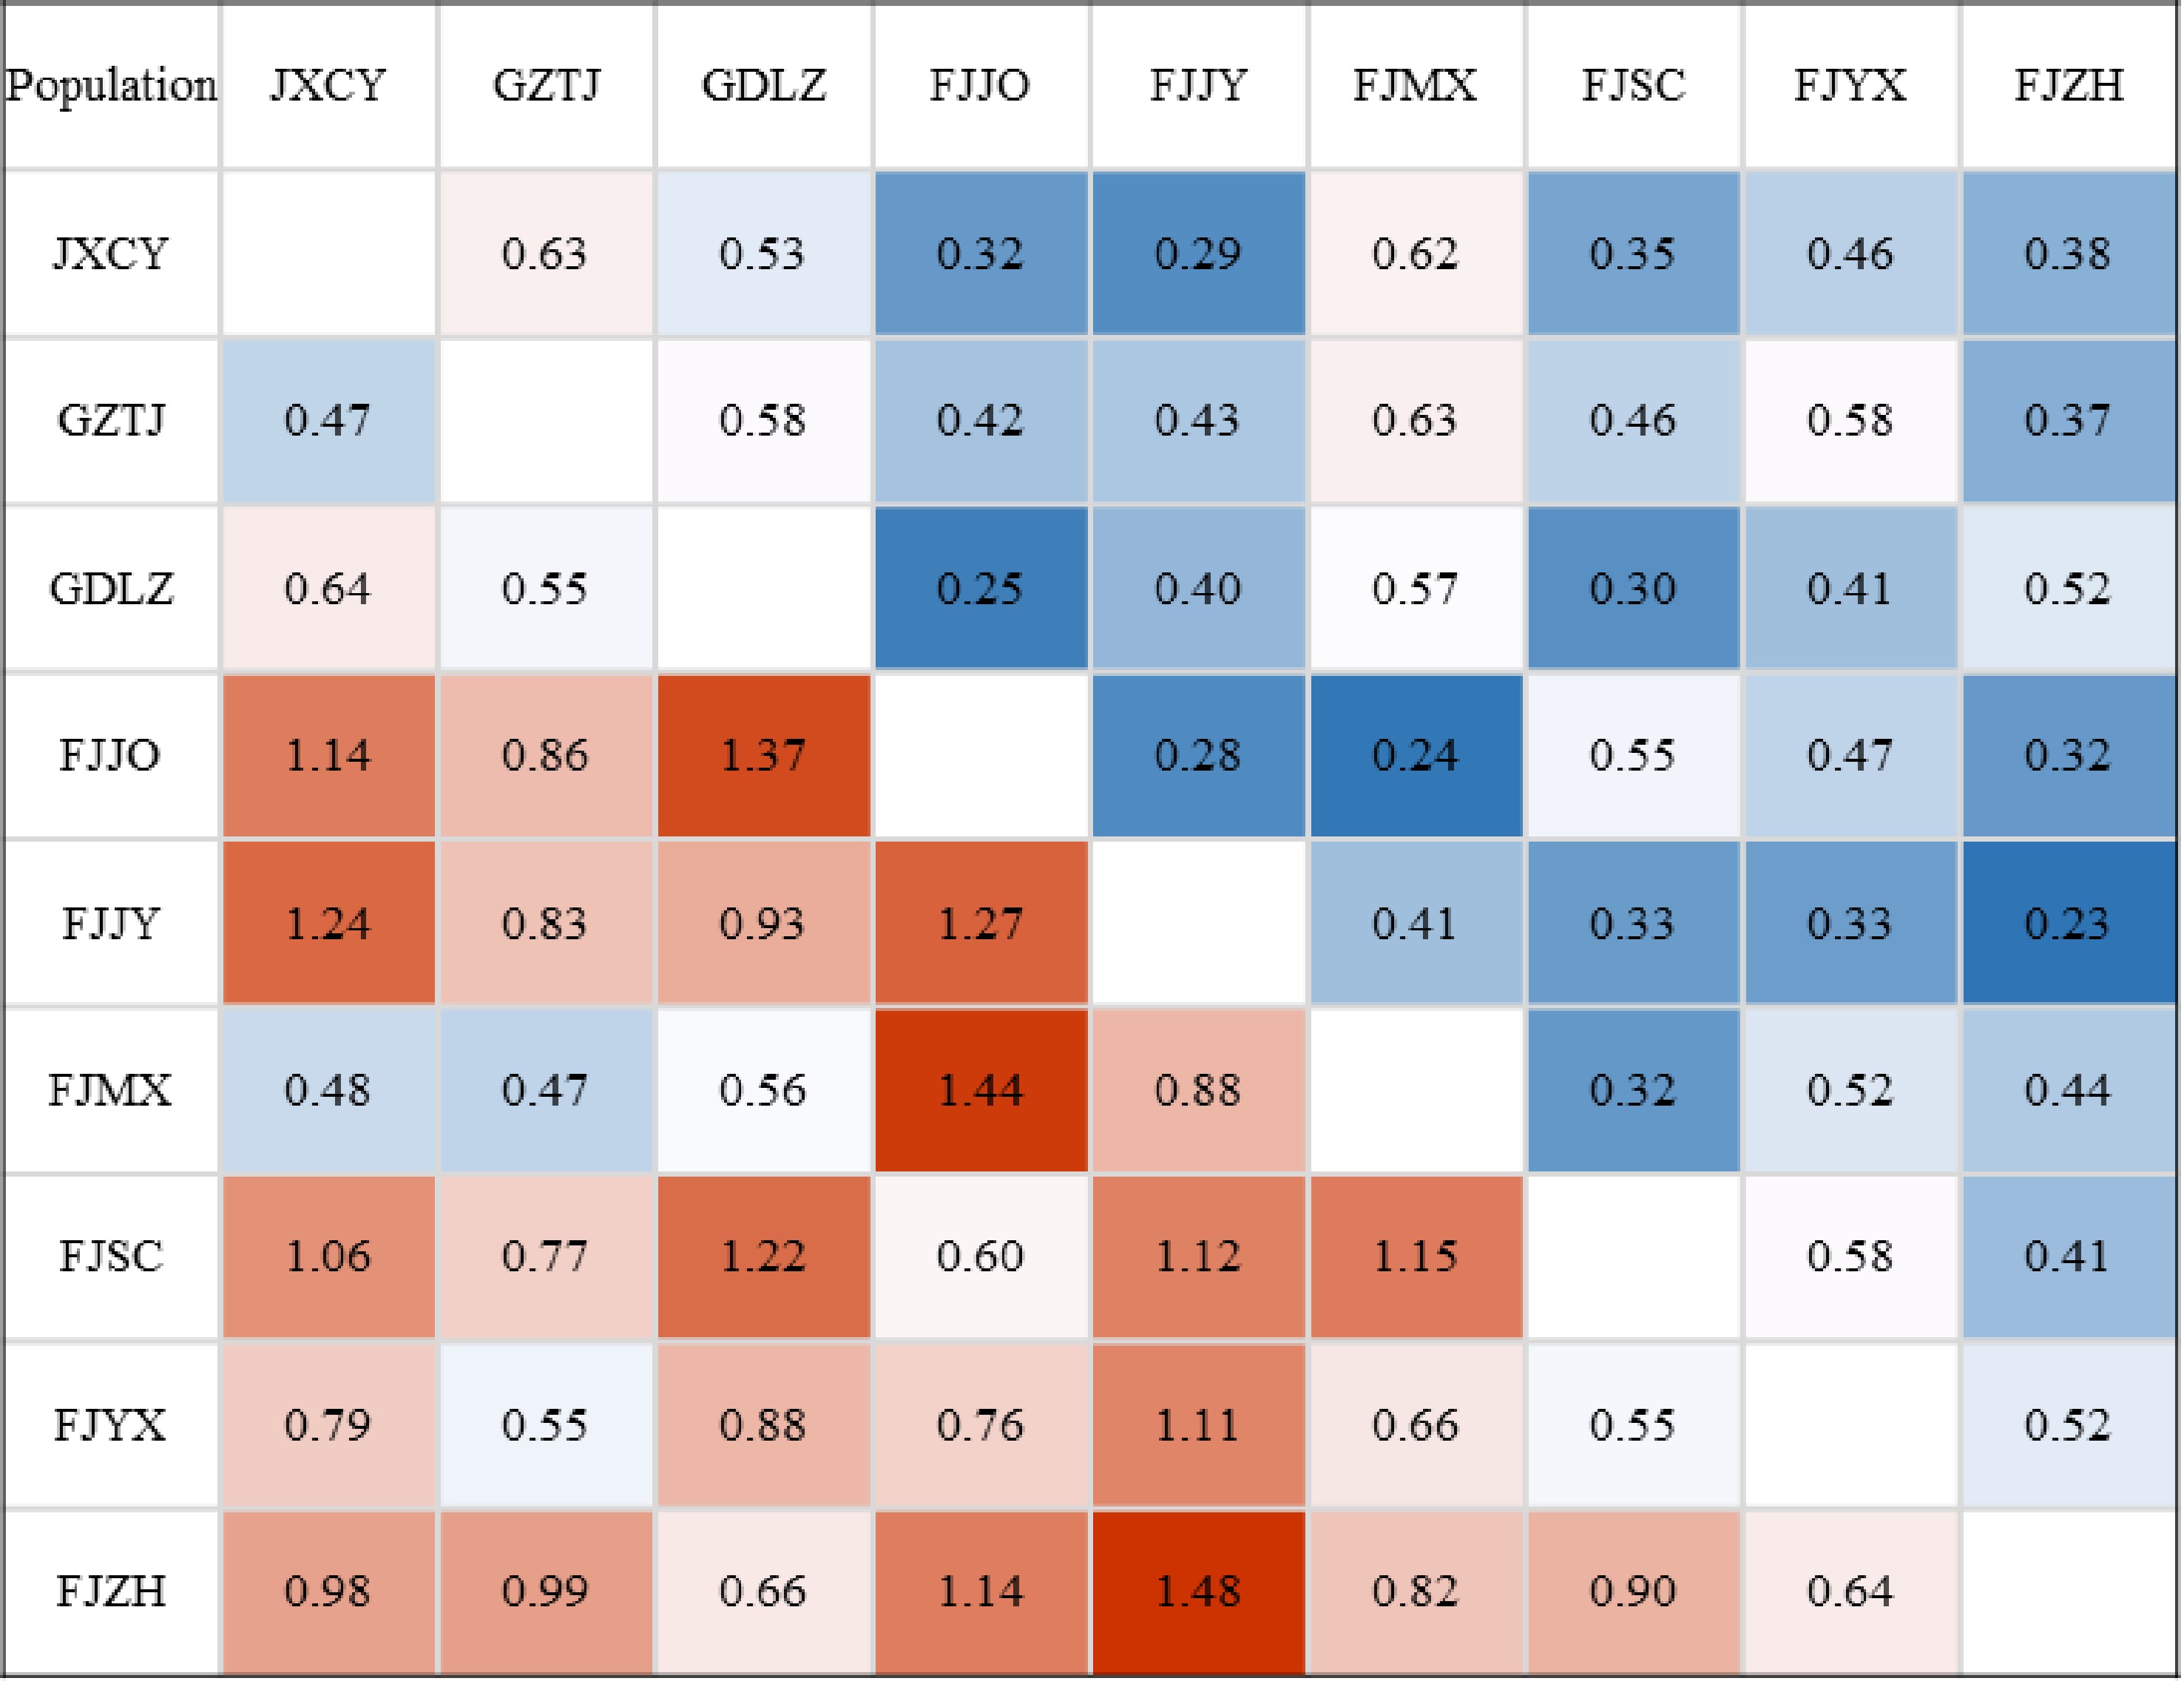
Figure 3.
Genetic distance and genetic consistency between populations. Note: Below the diagonal was genetic distance, above the diagonal was genetic consistency.
-
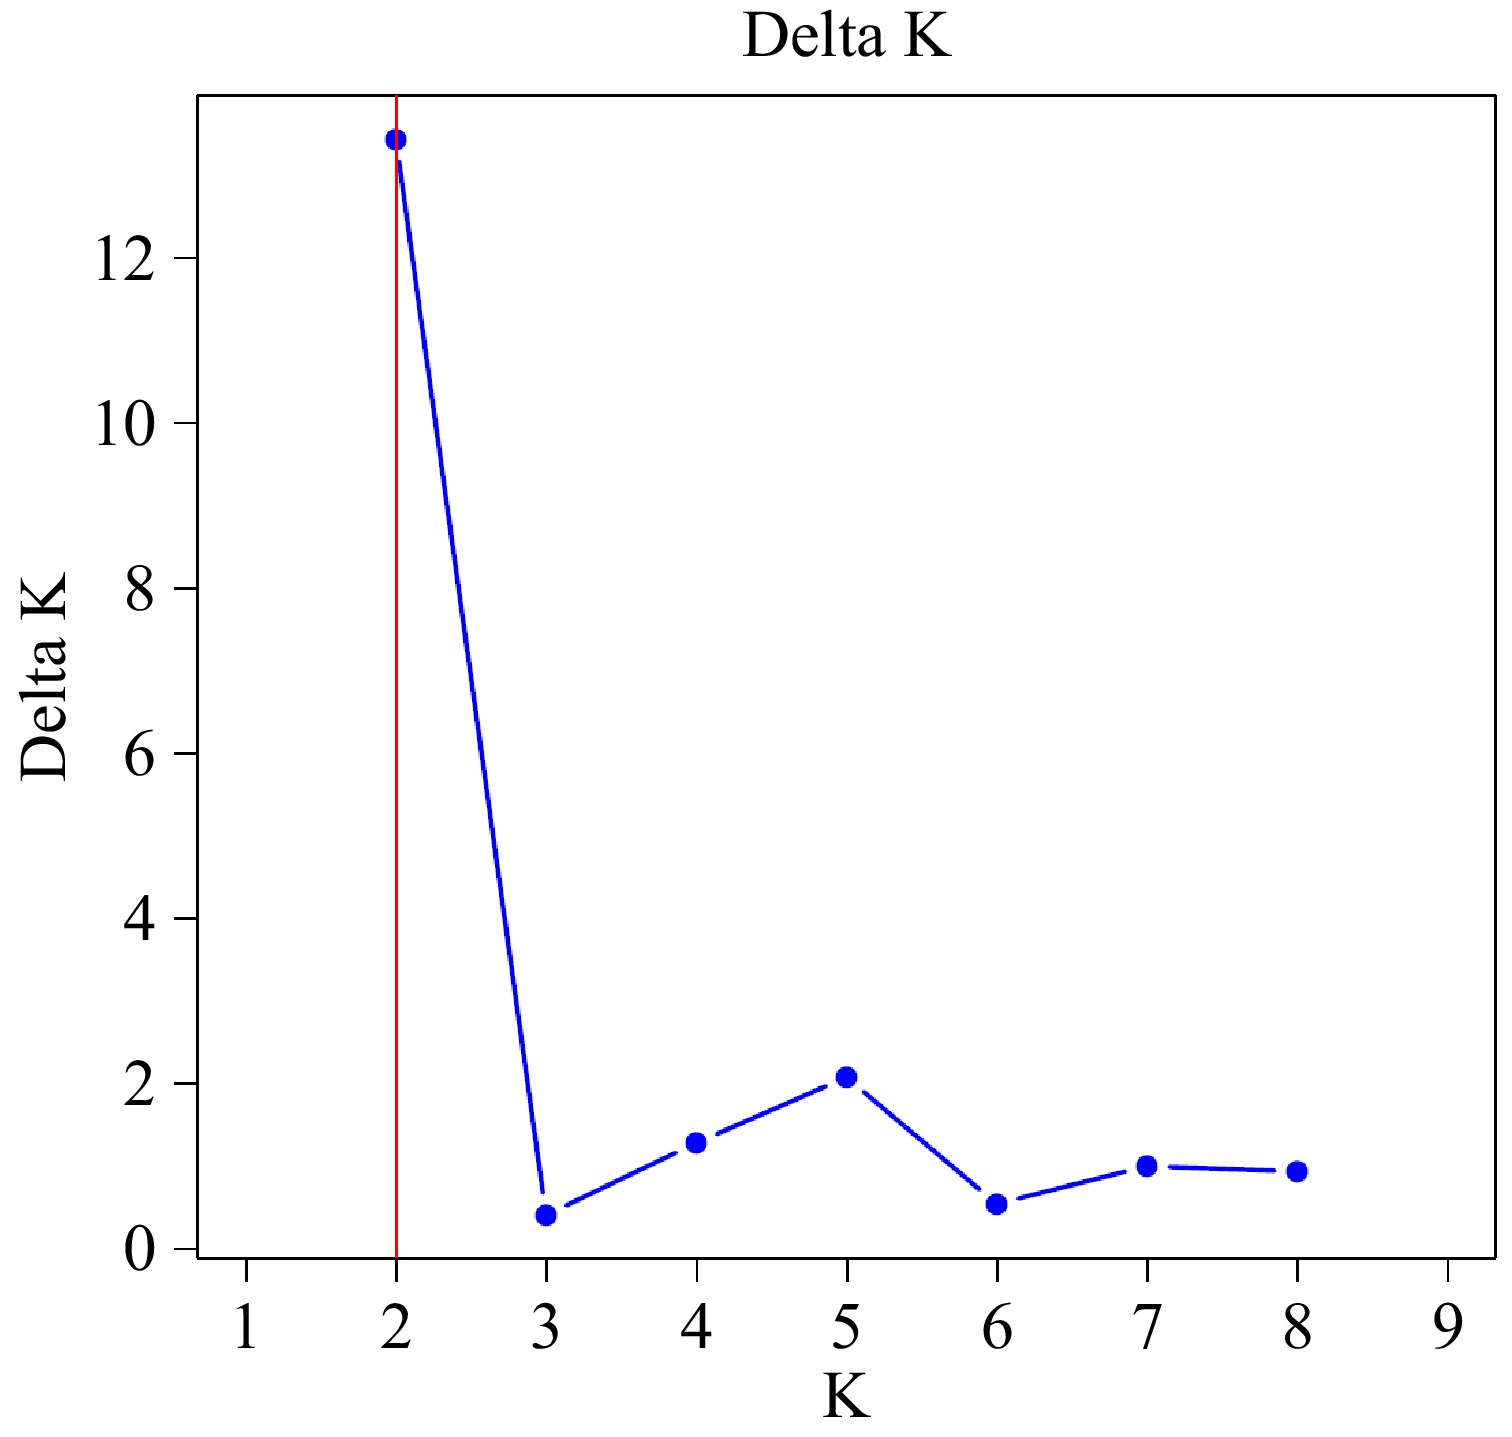
Figure 4.
The relationship between the optimal group number K and the inferred value ΔK.
-

Figure 5.
Population genetic structure based on STRUCTURE analysis.
-
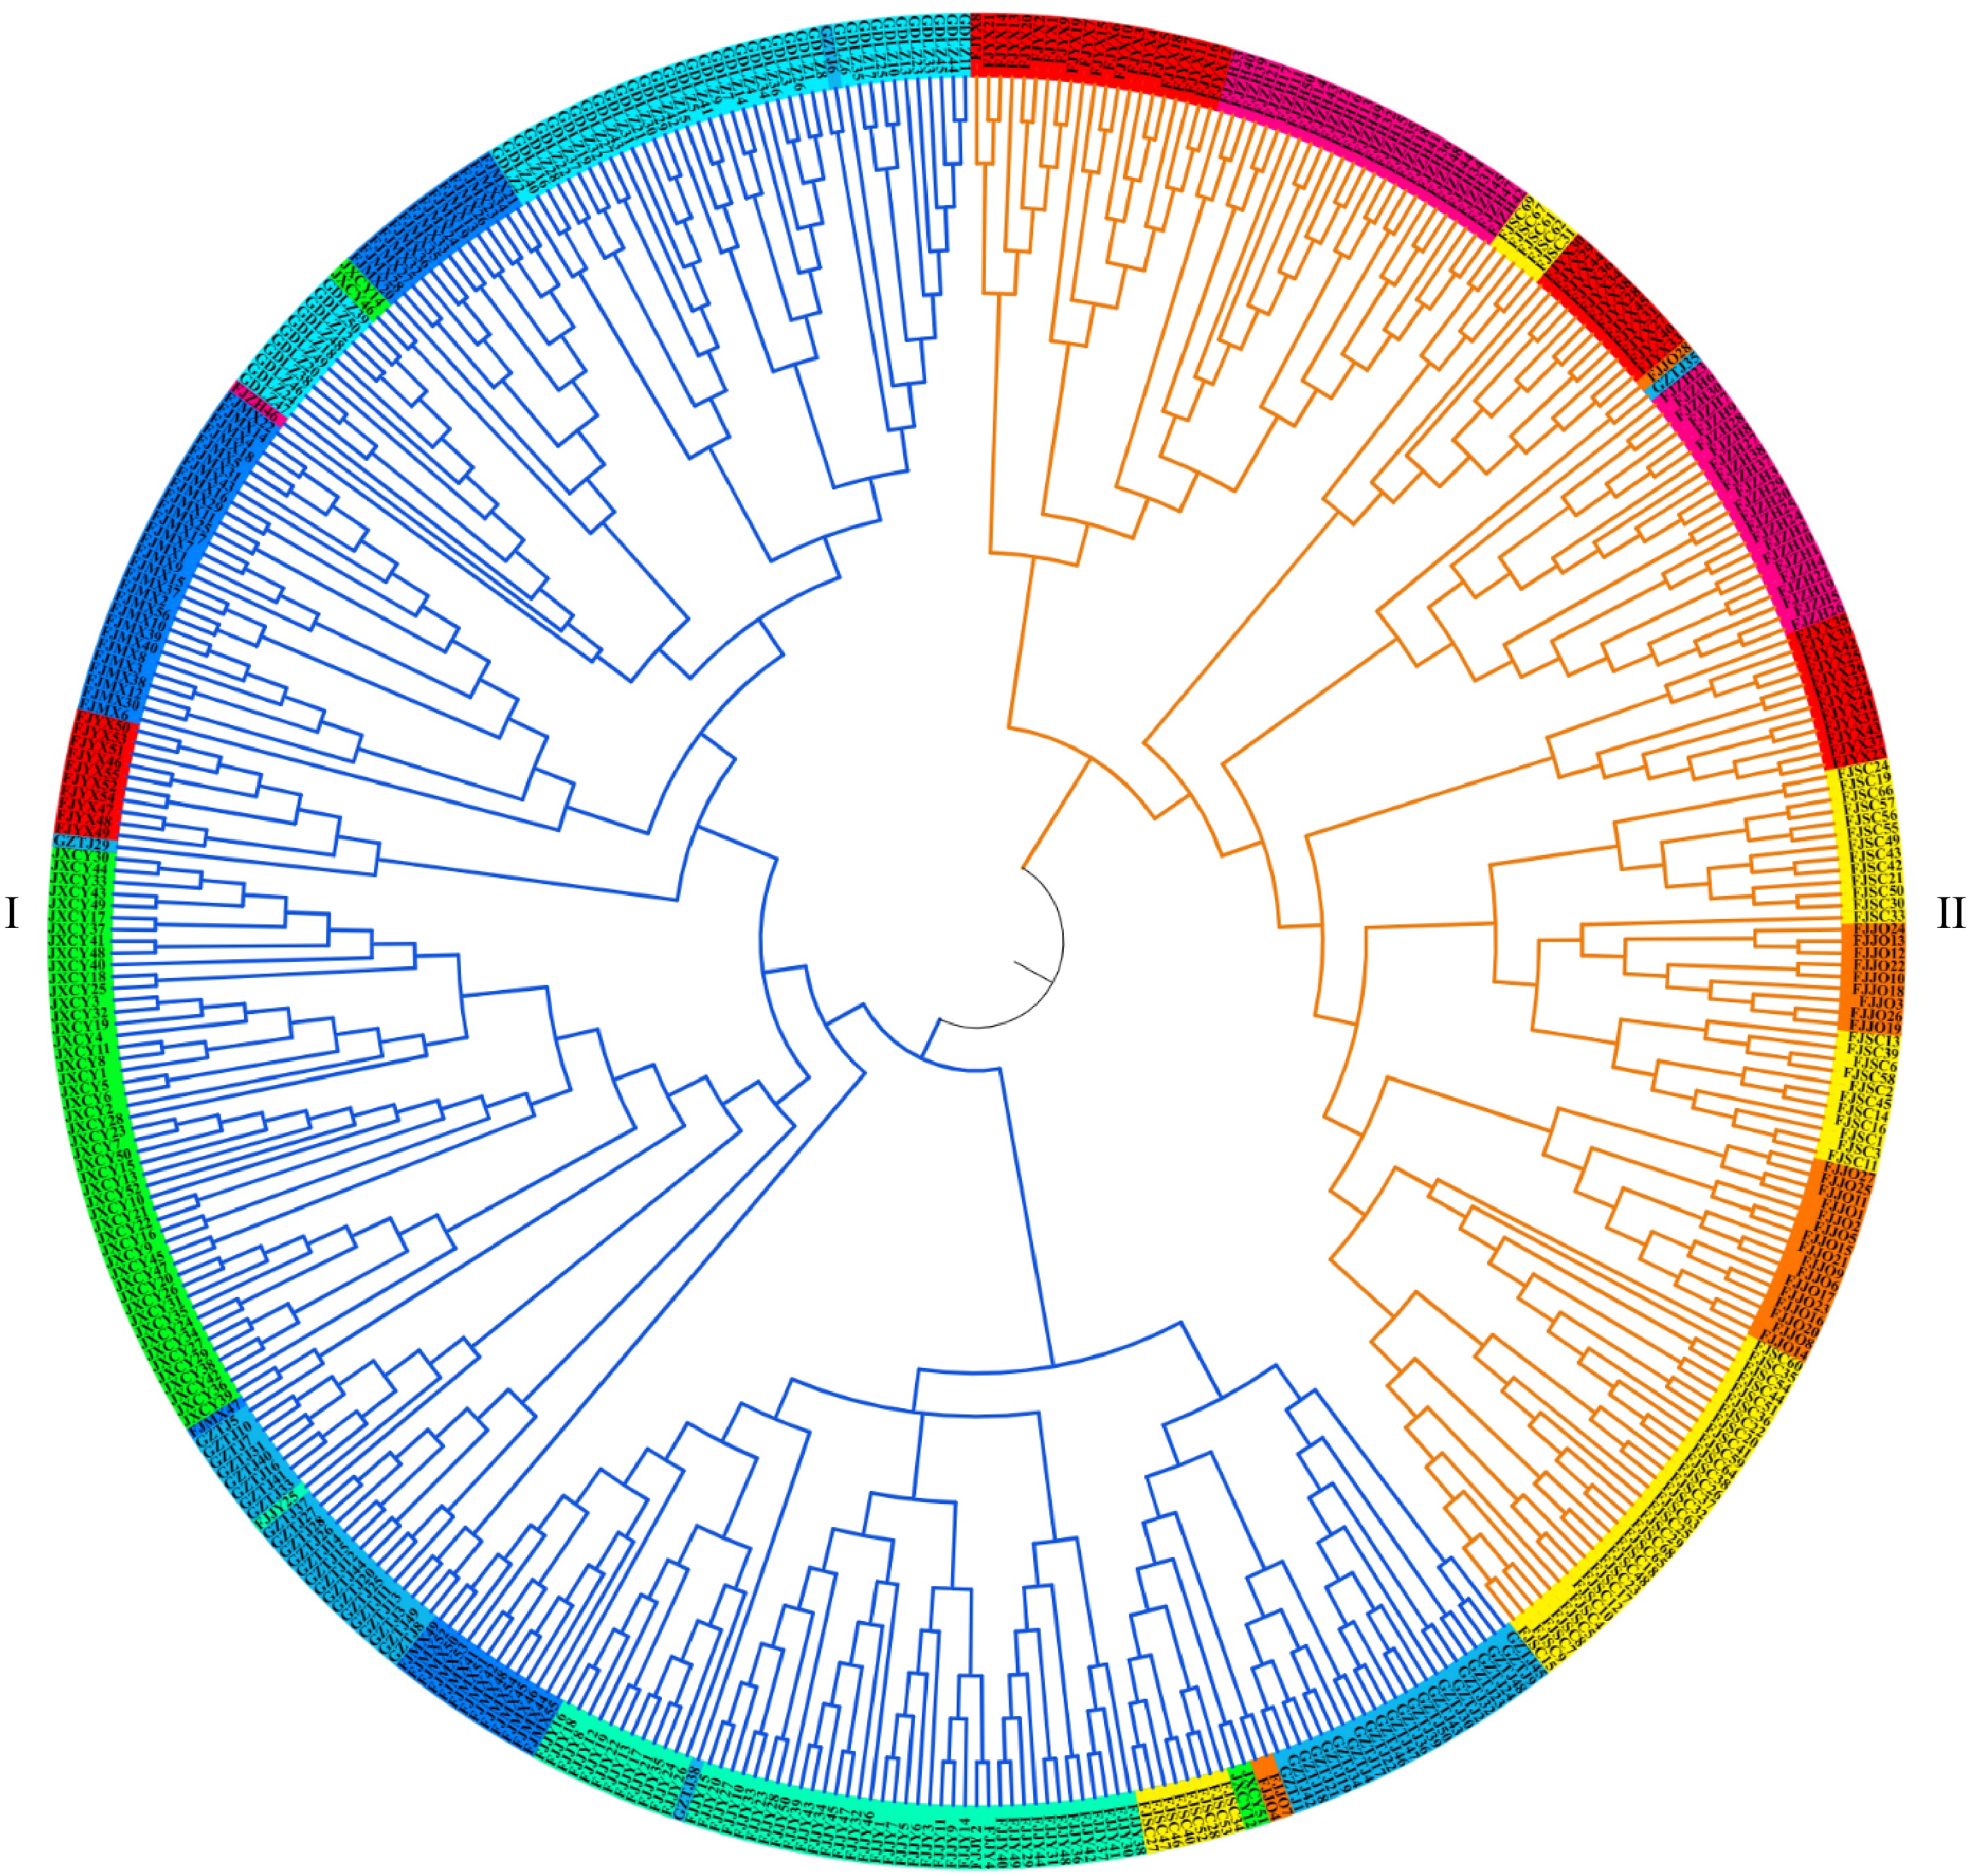
Figure 6.
Cluster analysis based on genetic distance among individuals.
-
Serial number Population code Location Sample numbers Longitude (E) Latitude (N) Altitude (m) 1 FJJO Jian'ou, Fujian 28 118.37 27.08 148.16 2 FJJY Jianyang, Fujian 50 117.84 27.39 197.82 3 FJMX Mingxi, Fujian 56 117.27 26.41 442.37 4 FJSC Shunchang, Fujian 69 117.94 26.87 434.72 5 FJYX Youxi, Fujian 55 118.28 26.27 308.68 6 FJZH Zhenghe, Fujian 50 118.62 27.44 299.60 7 GDLZ Lianzhou, Guangdong 50 112.20 25.05 195.85 8 GZTJ Taijiang, Guizhou 50 108.31 26.58 802.62 9 JXCY Chongyi, Jiangxi 52 115.17 26.36 219.98 Table 1.
Sample numbers and geographic information for experimental analysis of nine natural populations of P. bournei.
-
Locus Primer sequence (5'-3') Length (bp) Repeat motif Annealing temperature (°C) Ref. L1 F: TCGATTTGCAGAAGATAAGCC 449 (ATT)14 63 [15] R: GGGGTAGAAAAGTGAAAGAGTTG L2 F: AGAGGGCCTGTGCGTACGTTT 352 (TCT)12 63 [15] R: ACATTTGAGTCGGTTCCGGTTCC L3 F: GCTAGAGCTCAAAGGATCCC 344 (GAA)12 63 [15] R: GGTGGTGATTGGACTGGTAGGAG L5 F: GCCTGTGTTTGGAGTATGGA 229 (AG)35 63 [15] R: TTGAGTGGAGGAAGAAGTAGAAG L6 F: GAGAAGGGCATCAACACCAAC 259 (CT)31 63 [15] R: GCCTCTCCTAAGCTTTACCCA L8 F: GTGCTCTCTCTTGATTGTTCG 237 (CT)32 63 [15] R: CGGATAGGGTGATATTGTGTG L11 F: AAGTCCGATCTCGCAAAC 283 (AG)34 63 [15] R: CTCTTACCCTTCTTCCACC L13 F: CGTCTTCGTTTCGCTACT 218 (GAA)10 63 [15] R: CCTTCTACTTCCCCAATCT L14 F: TCTCGCCATCCTACTTCG 432 (TTC)10 63 [15] R: GGTTTACGGTGACCTTCG L15 F: AGGTTCGTCGGAGTTAGG 333 (AG)33 63 [15] R: TTGCGTCAATGTTGCTTC L17 F: AACAGGAGAAGGGAAGCAATGG 375 (CTT)10 63 [15] R: GCCTTCAGCAATGGTGTCGG L18 F: CAAGGGTGCCATGGTAGTGATAA 260 (GA)36 63 [15] R: AGCCTGACCCACGCACCTATAC L21 F: AGTAATACCAGCAGTACCAGTC 126 (AGA)11 63 [15] R: CAGATAGCATCAGAAGCAGA L23 F: AGGAATTGGAGCCGTTGGTTGT 266 (TCT)12 60 [15] R: TACATTTGAGTCGGTTCCGGTTC L24 F: GTCACAGCCCCCAAAGAATA 100 (AGG)5 60 [14] R: GTTTCCCGCCATCACTCTTA L30 F: CCCCAAAATCACATTTCACC 218 (CCTTC)5 60 [14] R: TCAACAGTTGCTTGGAATCG Table 2.
Characteristics of 16 SSR loci.
-
Locus Na Ne I Ho He PIC Gst Nm F Null HW L1 9 4.36 1.65 0.41 0.76 0.91 0.149 1.26 0.46 0.15 NS L2 7 4.80 1.74 0.46 0.78 0.84 0.088 2.25 0.42 0.00 NS L3 7 4.64 1.67 0.45 0.76 0.86 0.113 1.76 0.45 0.11 NS L5 8 6.37 2.05 0.99 0.83 0.94 0.106 1.96 −0.20 0.00 NS L6 17 9.27 2.26 0.57 0.84 0.95 0.109 1.84 0.37 0.00 NS L8 13 3.93 1.45 0.34 0.67 0.82 0.175 1.09 0.55 0.01 ** L11 9 7.08 2.02 0.68 0.81 0.94 0.134 1.49 0.16 0.10 NS L13 7 2.69 1.00 0.35 0.51 0.70 0.291 0.58 0.31 0.07 ** L14 11 6.32 1.88 0.47 0.80 0.90 0.108 1.84 0.45 0.09 NS L15 15 6.90 2.03 0.46 0.81 0.96 0.139 1.38 0.43 0.08 NS L17 7 4.67 1.63 0.63 0.76 0.84 0.096 1.99 0.17 0.12 NS L18 9 6.13 1.94 0.32 0.81 0.94 0.129 1.51 0.61 0.21 NS L21 8 3.83 1.38 0.81 0.67 0.80 0.179 1.10 −0.18 0.13 NS L23 9 5.69 1.83 0.70 0.80 0.88 0.095 2.15 0.16 0.00 NS L24 6 2.48 0.93 0.45 0.50 0.74 0.350 0.45 0.15 0.00 ** L30 8 2.98 1.18 0.64 0.64 0.70 0.133 1.52 0.01 0.00 * Total 150 82.14 Over all 9.38 5.13 1.67 0.55 0.73 0.86 0.15 1.51 0.27 0.07 Na: number of alleles, Ne: effective number of alleles, I: Shannon's information index, Ho: observed heterozygosity, He: expected heterozygosity, PIC: polymorphic information content, Gst: genetic differentiation coefficient, Nm: gene flow, F: fixation index, Null: null allele frequency, HW: Hardy-Weinberg equilibrium, NS: no significant, * p < 0.05 deviation from Hardy-Weinberg equilibrium, ** p < 0.01 extremely significant deviation from Hardy-Weinberg equilibrium. Table 3.
Genetic diversity parameters of P. bournei at different loci.
-
Population Na Ne I Ho He Ar PAr Fis H FJSC 13.06 7.48 2.10 0.52 0.83 11.17 1.64 0.38 0.84 FJYX 10.13 6.68 1.93 0.44 0.81 9.21 0.80 0.46 0.82 GZTJ 13.06 6.73 2.01 0.41 0.80 11.35 1.29 0.49 0.81 FJJO 8.81 5.33 1.74 0.44 0.76 8.81 0.90 0.45 0.78 FJZH 8.56 4.83 1.65 0.52 0.76 7.53 1.10 0.32 0.77 FJMX 7.00 4.06 1.47 0.47 0.69 6.36 0.48 0.33 0.70 FJJY 8.06 4.24 1.55 0.64 0.71 7.27 0.74 0.11 0.72 GDLZ 4.69 3.16 1.21 0.38 0.65 4.43 0.14 0.43 0.66 JXCY 7.50 3.69 1.33 0.31 0.60 6.60 0.57 0.50 0.61 Mean 8.99 5.13 1.67 0.46 0.73 8.08 0.85 0.39 0.75 Na: number of alleles, Ne: effective number of alleles, I: Shannon's information index, Ho: observed heterozygosity, He: expected heterozygosity, Ar: allele richness, PAr: private allele richness, Fis: inbreeding coefficient, H: Nei's genetic diversity index. Table 4.
Genetic diversity parameters of different natural populations of P. bournei.
-
Source of variation d.f. Sum of squares Variance components Percentage of variation p FST Among populations 8 984.88 1.15 16.20 < 0.01 0.162 Within populations 911 5425.84 5.96 83.80 Total 919 6410.72 7.11 Table 5.
Analysis of AMOVA molecular variance of natural populations of P. bournei.
Figures
(6)
Tables
(5)