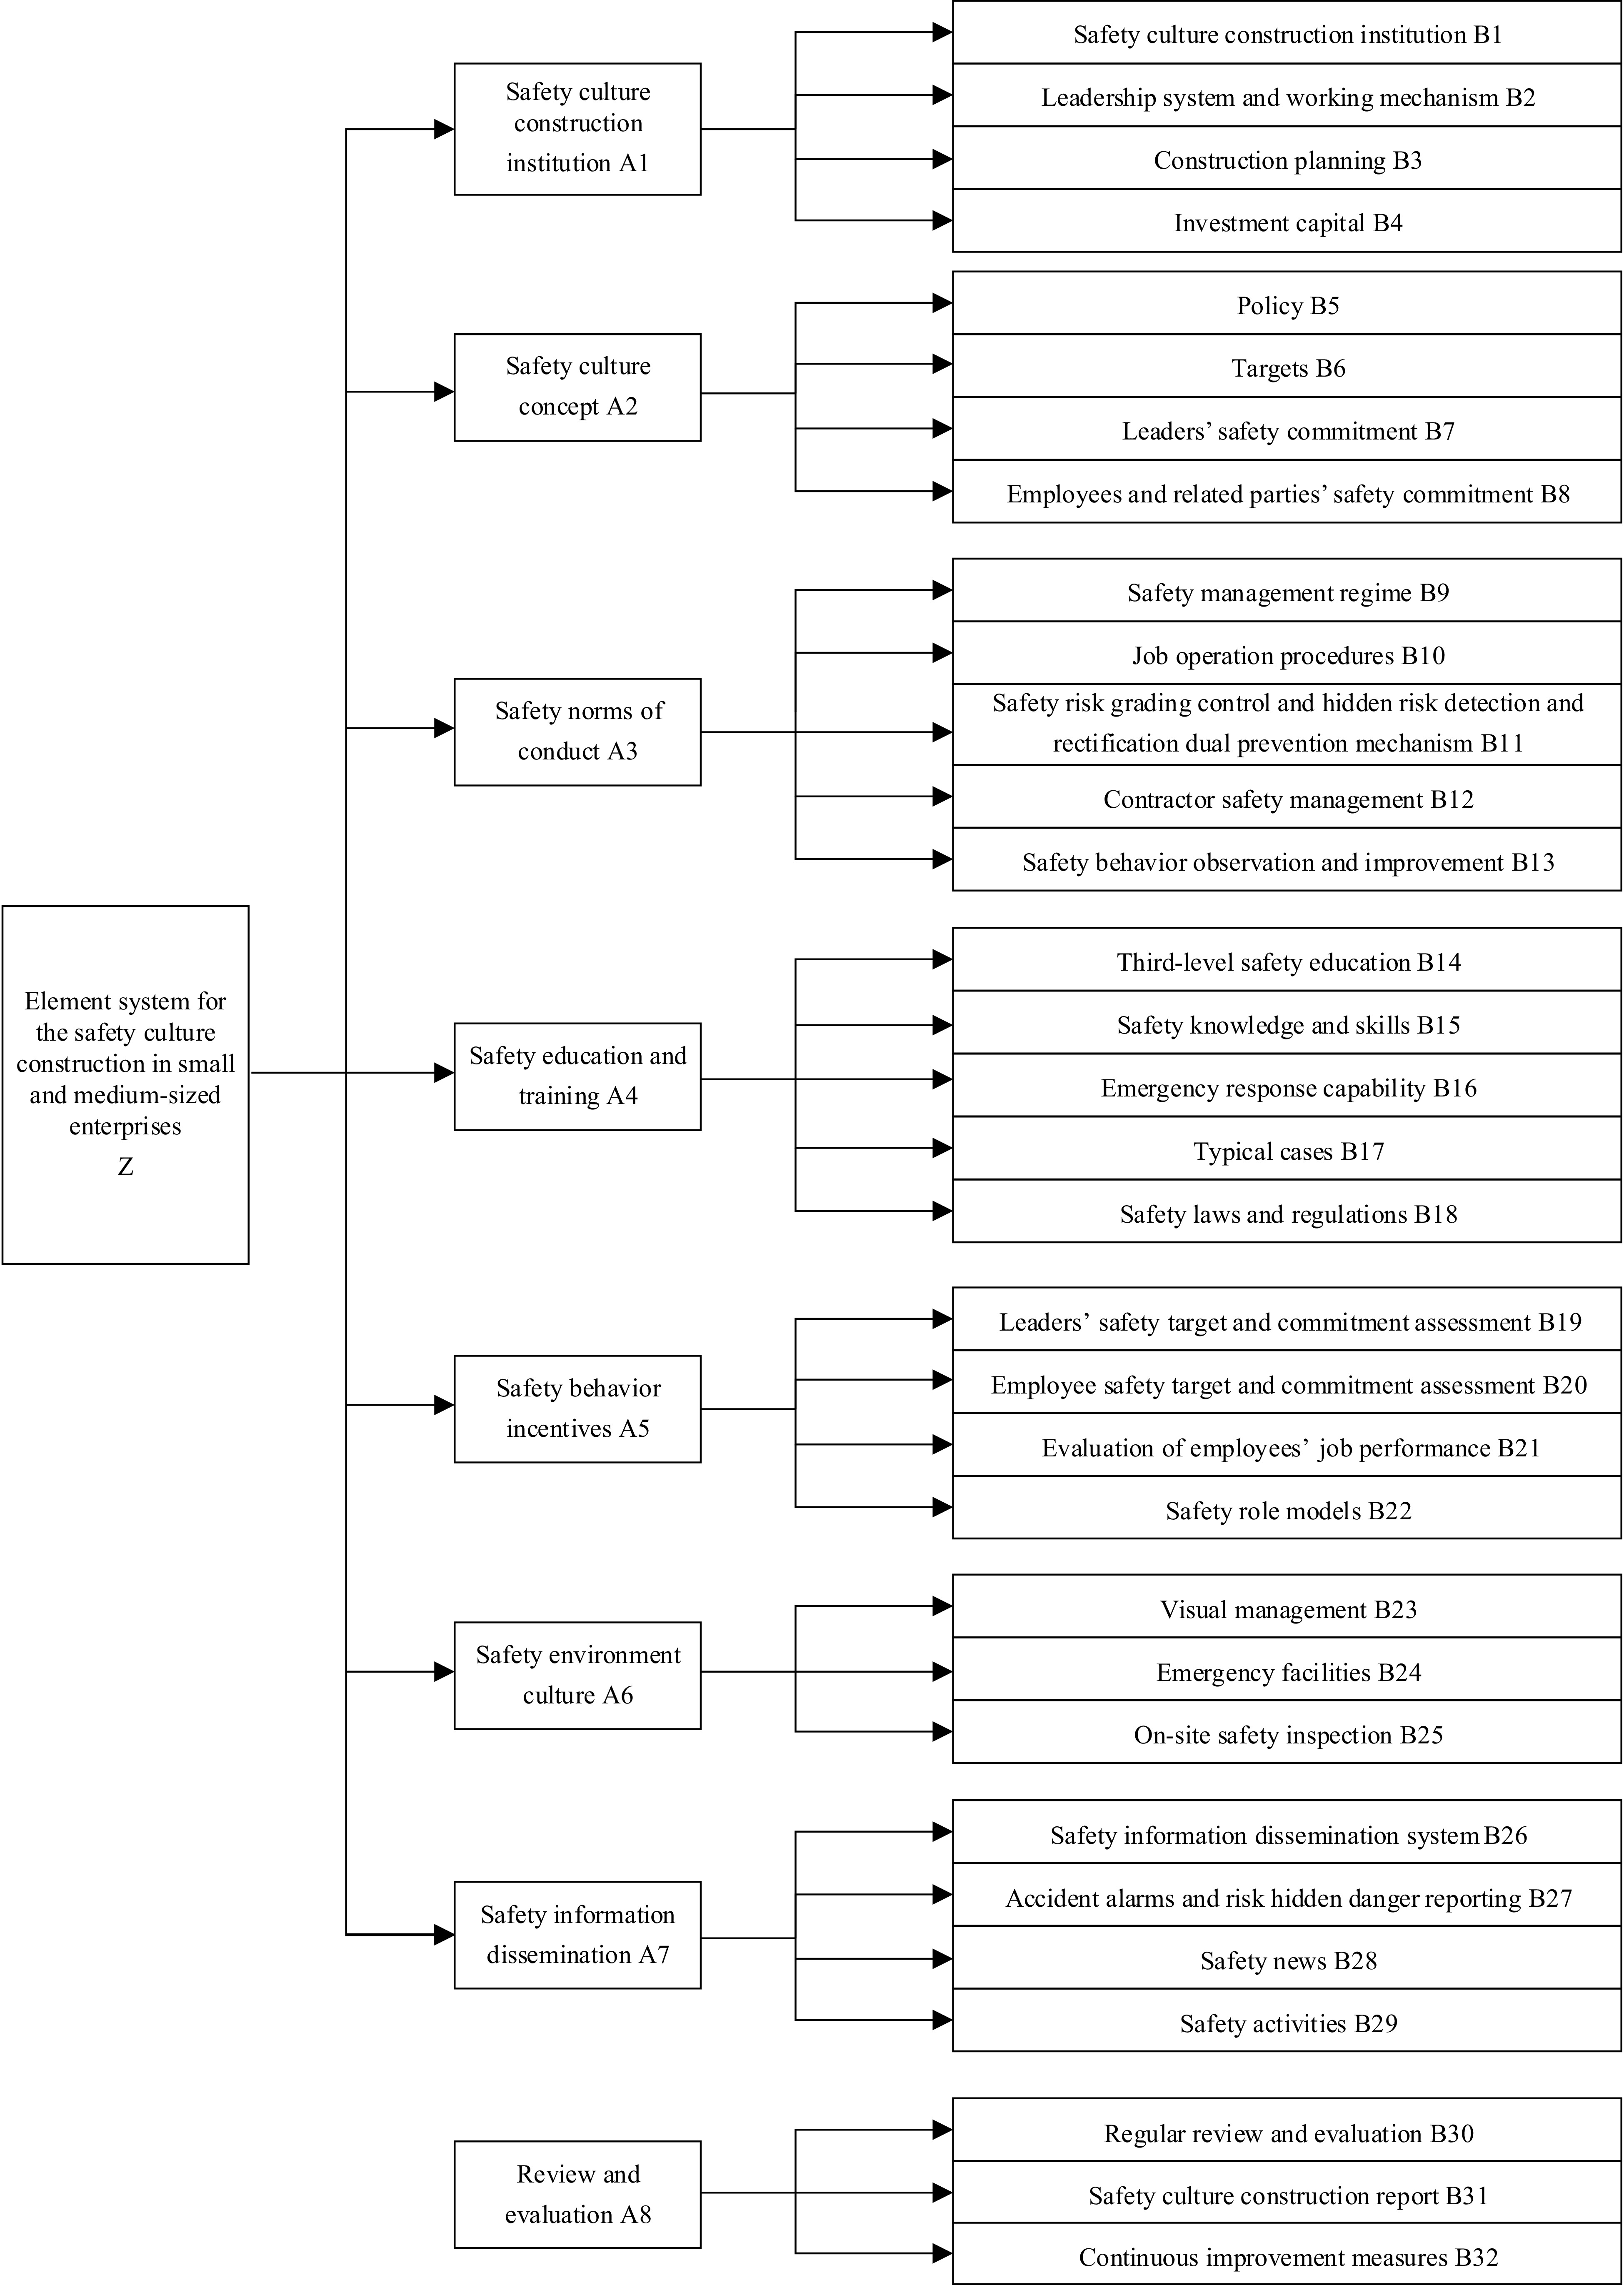
-

Figure 1.
Hierarchical structure of safety culture construction elements.
-
Serial no. Primary element Serial no. Secondary element 1 Safety culture construction institution 1.1 Safety culture construction institution 1.2 Leadership system and working mechanism 1.3 Construction planning 1.4 Investment capital 2 Safety culture concept 2.1 Policy 2.2 Targets 2.3 Leaders' safety commitment 2.4 Employees and related parties' safety commitment 3 Safety norms of conduct 3.1 Safety management regime 3.2 Job operation procedures 3.3 Safety risk grading control and hidden risk detection and rectification dual prevention mechanism 3.4 Contractor safety management 3.5 Safety behavior observation and improvement 4 Safety education and training 4.1 Third-level safety education 4.2 Safety knowledge and skills 4.3 Emergency response capability 4.4 Typical cases 4.5 Safety laws and regulations 5 Safety behavior incentives 5.1 Leaders' safety target and commitment assessment 5.2 Employee safety target and commitment assessment 5.3 Evaluation of employees' job performance 5.4 Safety role models 6 Safety environment culture 6.1 Visual management 6.2 Emergency facilities 6.3 On-site safety inspection 7 Safety information dissemination 7.1 Safety information dissemination system 7.2 Accident alarms and risk hidden danger reporting 7.3 Safety news 7.4 Safety activities 8 Review and evaluation 8.1 Regular review and evaluation 8.2 Safety culture construction report 8.3 Continuous improvement measures Table 1.
Element system for safety culture construction in medium and small enterprises.
-
Goal level Indicator layer (primary element) Weight of
element A to ZSolution layer (secondary element) Weight of element
B to AWeight of
element B to ZTotal sorting Safety culture construction of medium and small enterprises Z A1 0.03444 B1 0.09670 0.00333 31 B2 0.55495 0.01911 16 B3 0.25165 0.00867 25 B4 0.09670 0.00333 31 A2 0.16715 B5 0.09670 0.01616 18 B6 0.25165 0.04206 6 B7 0.55495 0.09276 3 B8 0.09670 0.01616 18 A3 0.39755 B9 0.10531 0.04187 7 B10 0.10531 0.04187 7 B11 0.49712 0.19763 1 B12 0.04688 0.01864 17 B13 0.24539 0.09755 2 A4 0.16715 B14 0.17438 0.02915 10 B15 0.49361 0.08251 4 B16 0.18817 0.03145 9 B17 0.07192 0.01202 22 B18 0.07192 0.01202 22 A5 0.08242 B19 0.30000 0.02473 11 B20 0.10000 0.00824 26 B21 0.30000 0.02473 11 B22 0.30000 0.02473 11 A6 0.03444 B23 0.26050 0.00897 24 B24 0.10616 0.00366 30 B25 0.63335 0.02181 14 A7 0.08242 B26 0.09670 0.00797 27 B27 0.55495 0.04574 5 B28 0.09670 0.00797 27 B29 0.25165 0.02074 15 A8 0.03444 B30 0.42857 0.01476 20 B31 0.14286 0.00492 29 B32 0.42857 0.01476 20 Table 2.
List of weighting results.
-
The construction of a judgment matrix $ {\lambda }_{max} $ n CI RI CR Consistency Safety culture construction in medium and small enterprises 8.357 8 0.051 1.410 0.036 Verified Safety culture construction institutions 4.044 4 0.015 0.890 0.016 Verified Safety culture concept 4.044 4 0.015 0.890 0.016 Verified Safety norms of conduct 5.127 5 0.032 1.120 0.028 Verified Safety education and training 5.137 5 0.034 1.120 0.031 Verified Safety behavior incentives 4.000 4 0.000 0.890 0.000 Verified Safety environment culture 3.039 3 0.019 0.520 0.037 Verified Safety information dissemination 4.044 4 0.015 0.89 0.016 Verified Review and evaluation 3.000 3 0.000 0.520 0.000 Verified Table 3.
Consistency checking table for each judgment matrix.
-
Element Excellent Good Moderate Pass Poor u61 0.5 0.4 0.1 0 0 u62 0.3 0.4 0.2 0.1 0 u63 0.4 0.5 0.1 0 0 Table 4.
Table for u6 subset rubric level assignment.
Figures
(1)
Tables
(4)