-

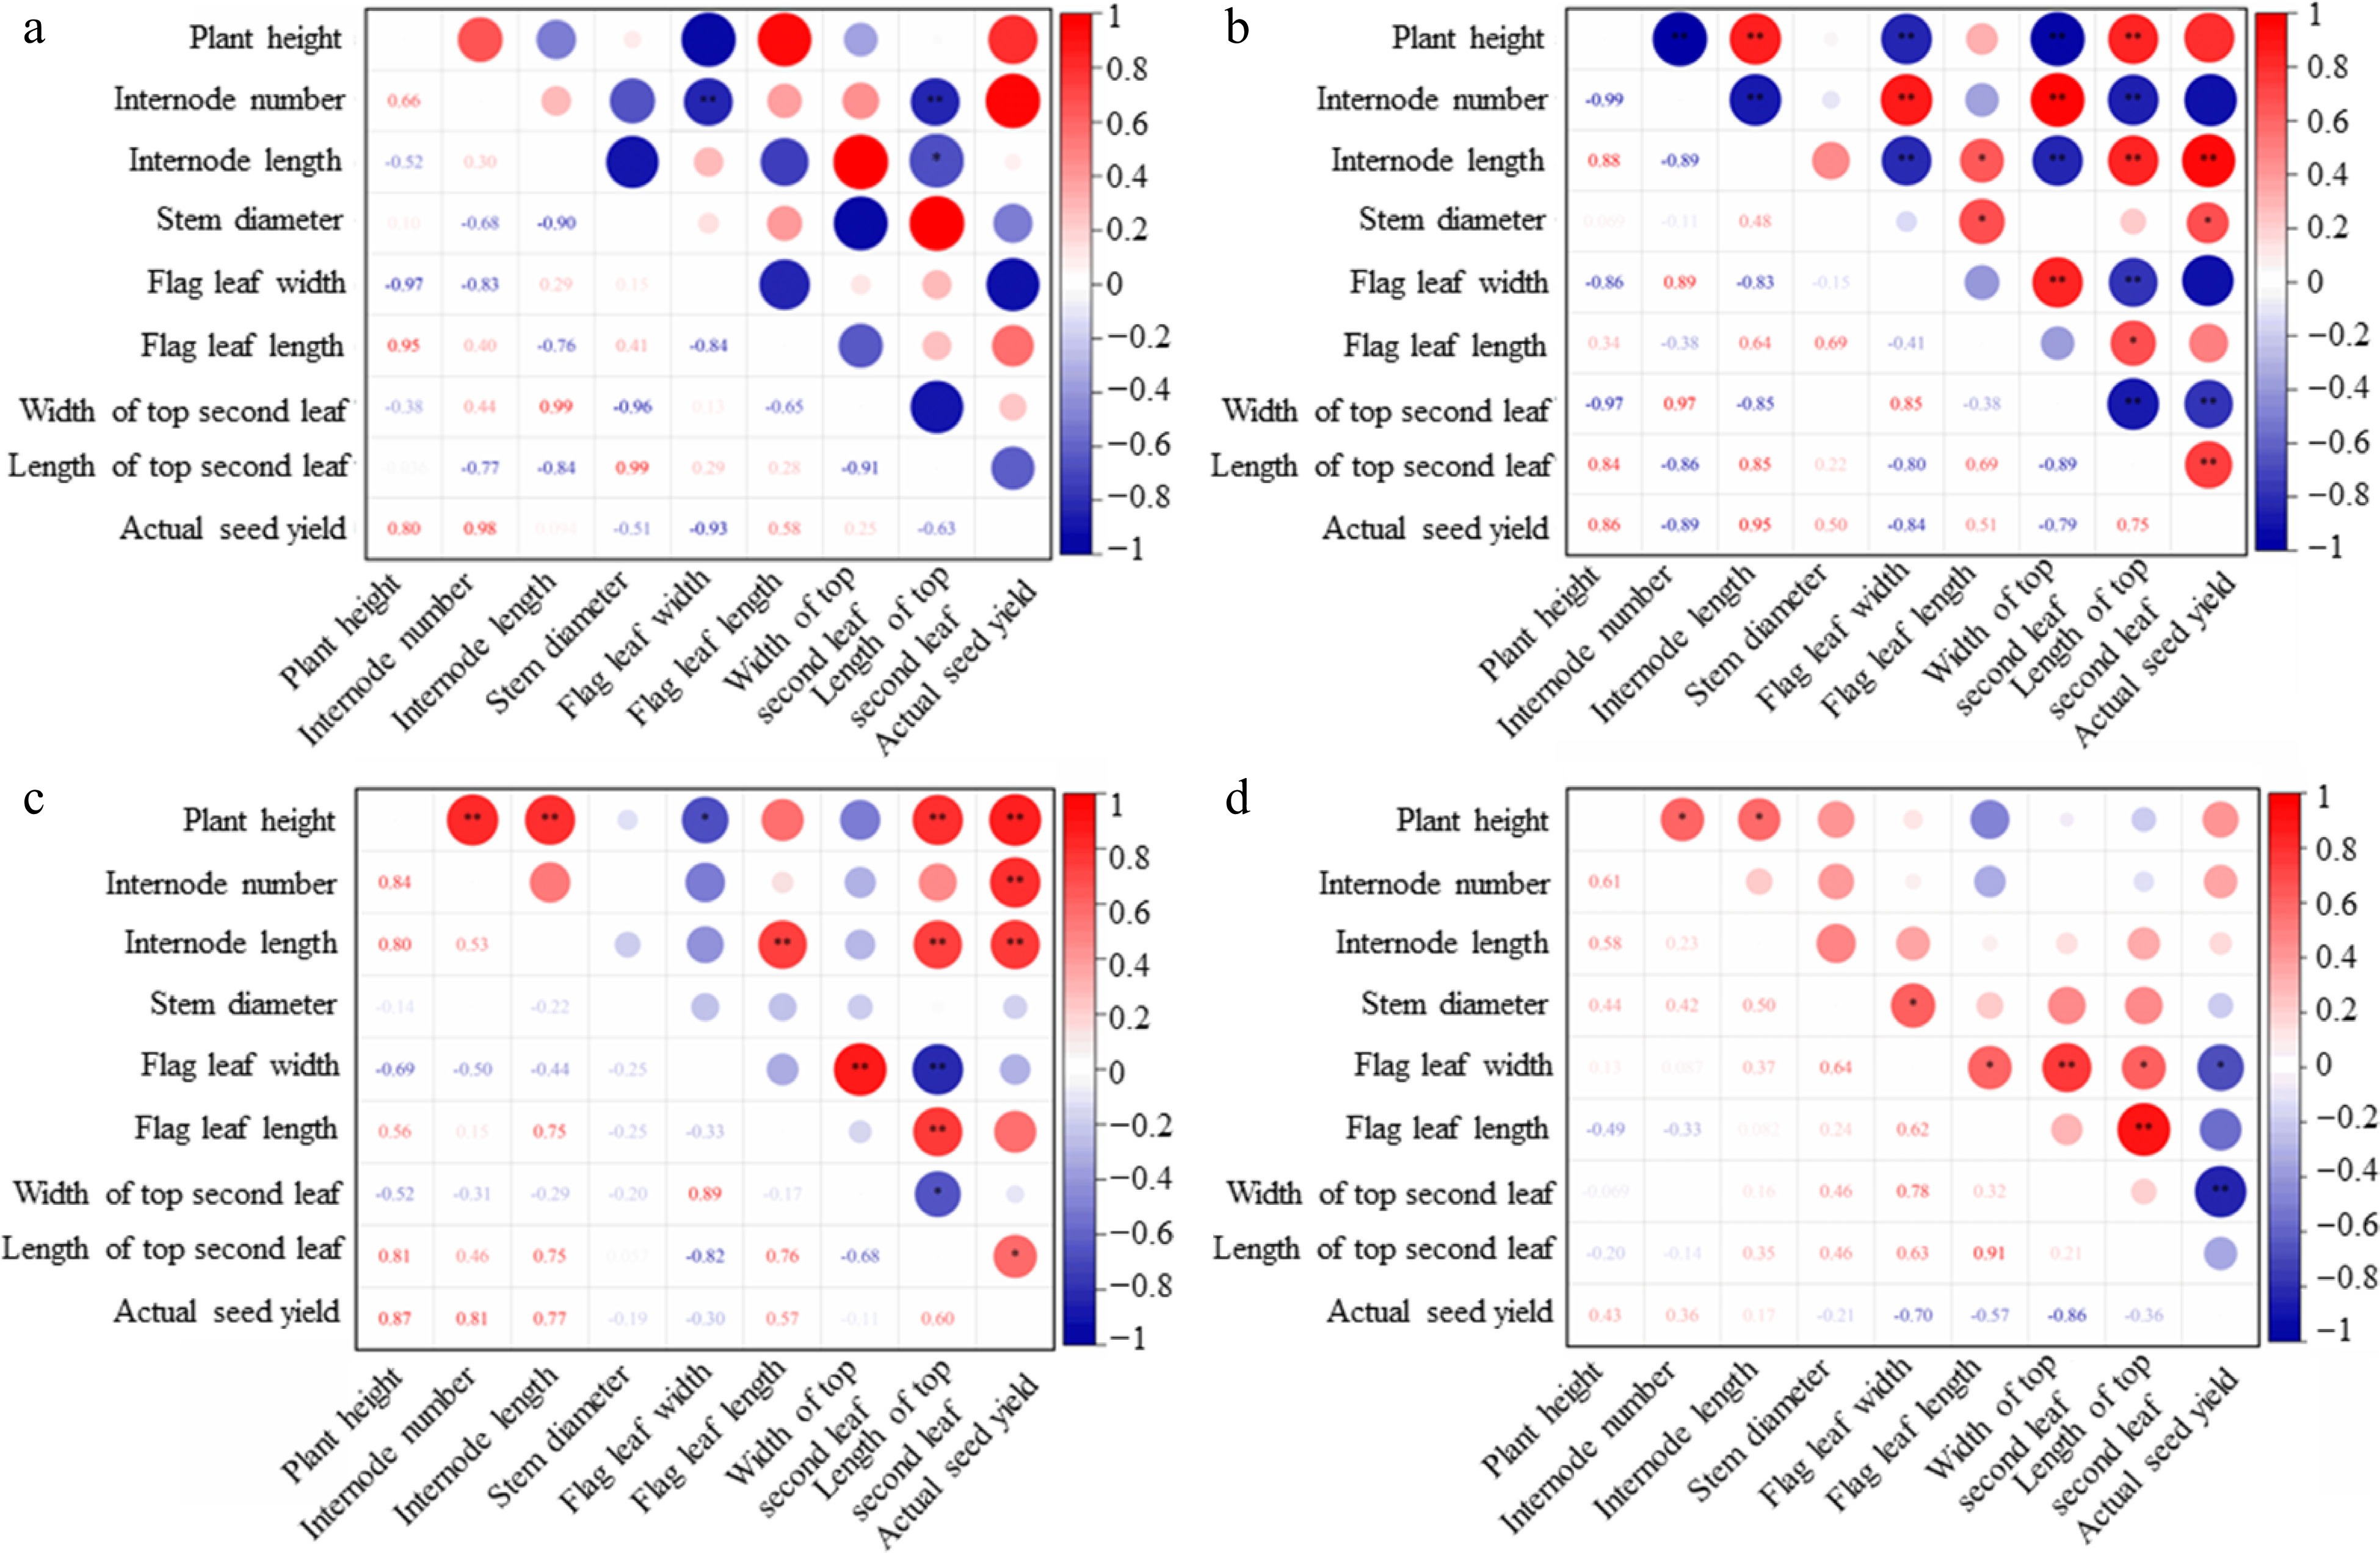
Figure 1.
Correlation between the morphological traits of Dactylis glomerata. The correlation heat map visualization of (a) control, (b) CCC, (c) TE, and (d) CCC + TE are presented. ** significant correlation at the 0.01 level; * significant correlation at the level of 0.05.
-

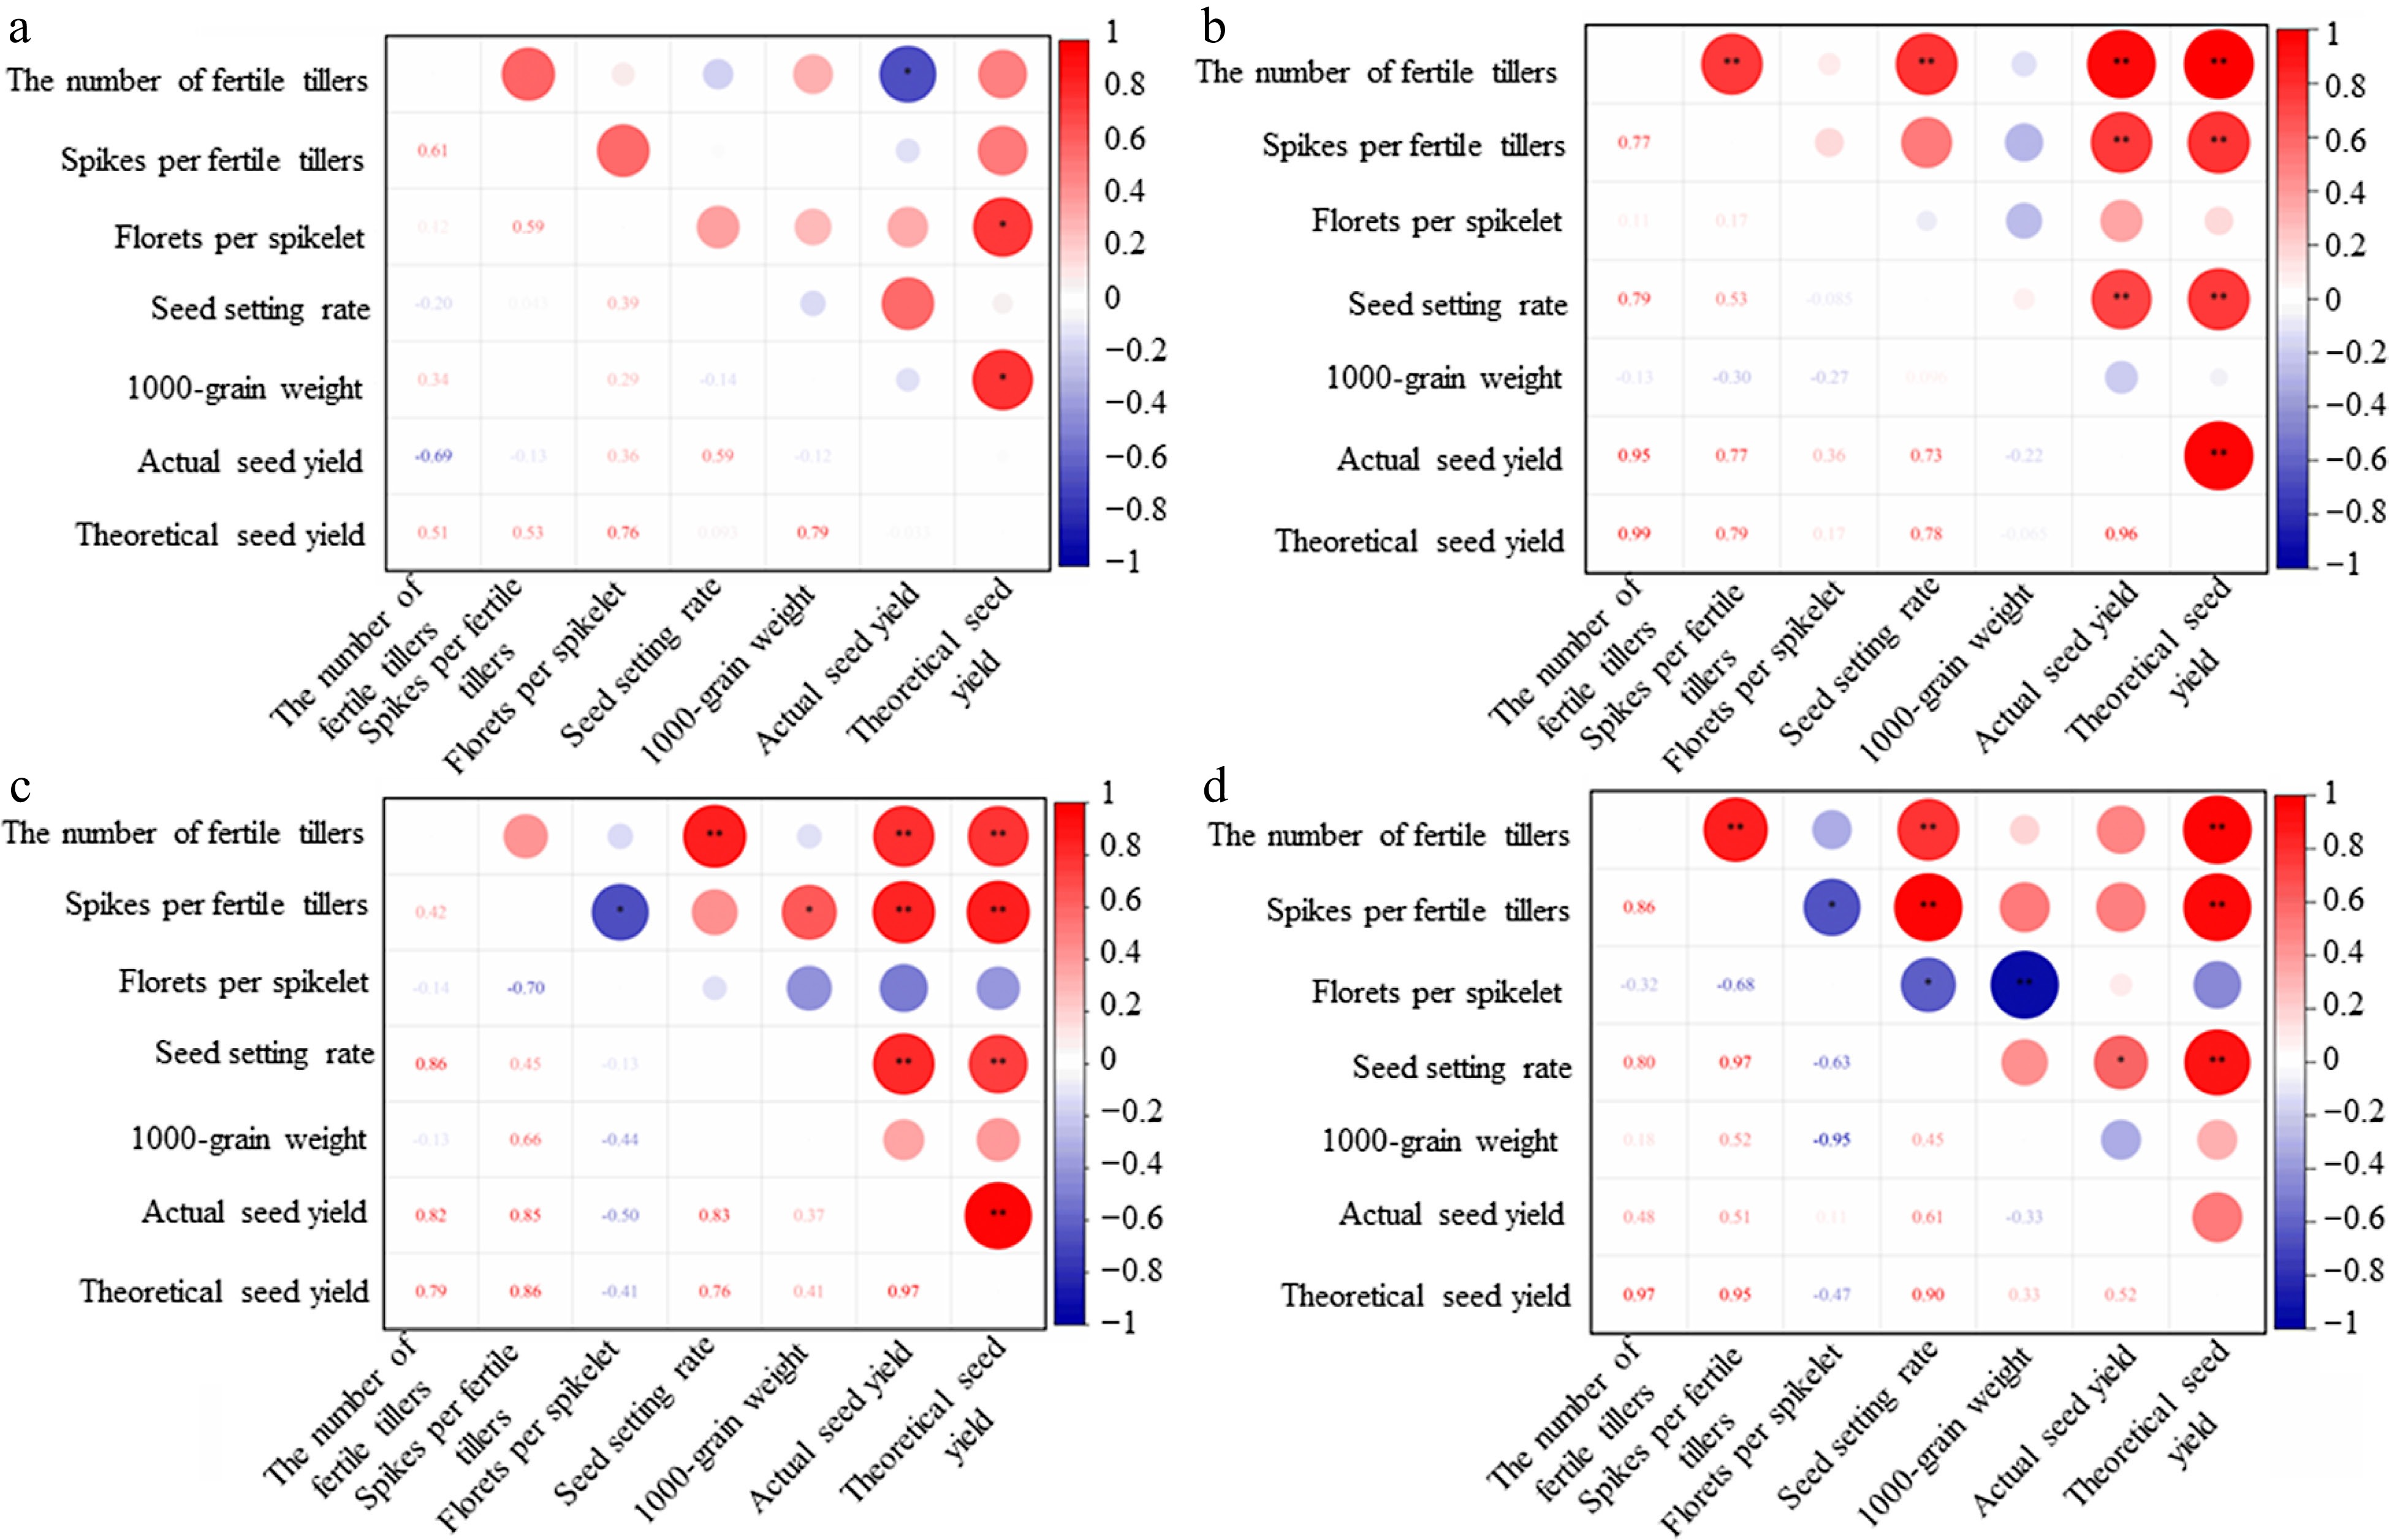
Figure 2.
Correlation between the reproductive traits of Dactylis glomerata. The correlation heat map visualization of (a) control, (b) CCC, (c) TE, and (d) CCC + TE are presented. ** significant correlation at the 0.01 level; * significant correlation at the level of 0.05.
-

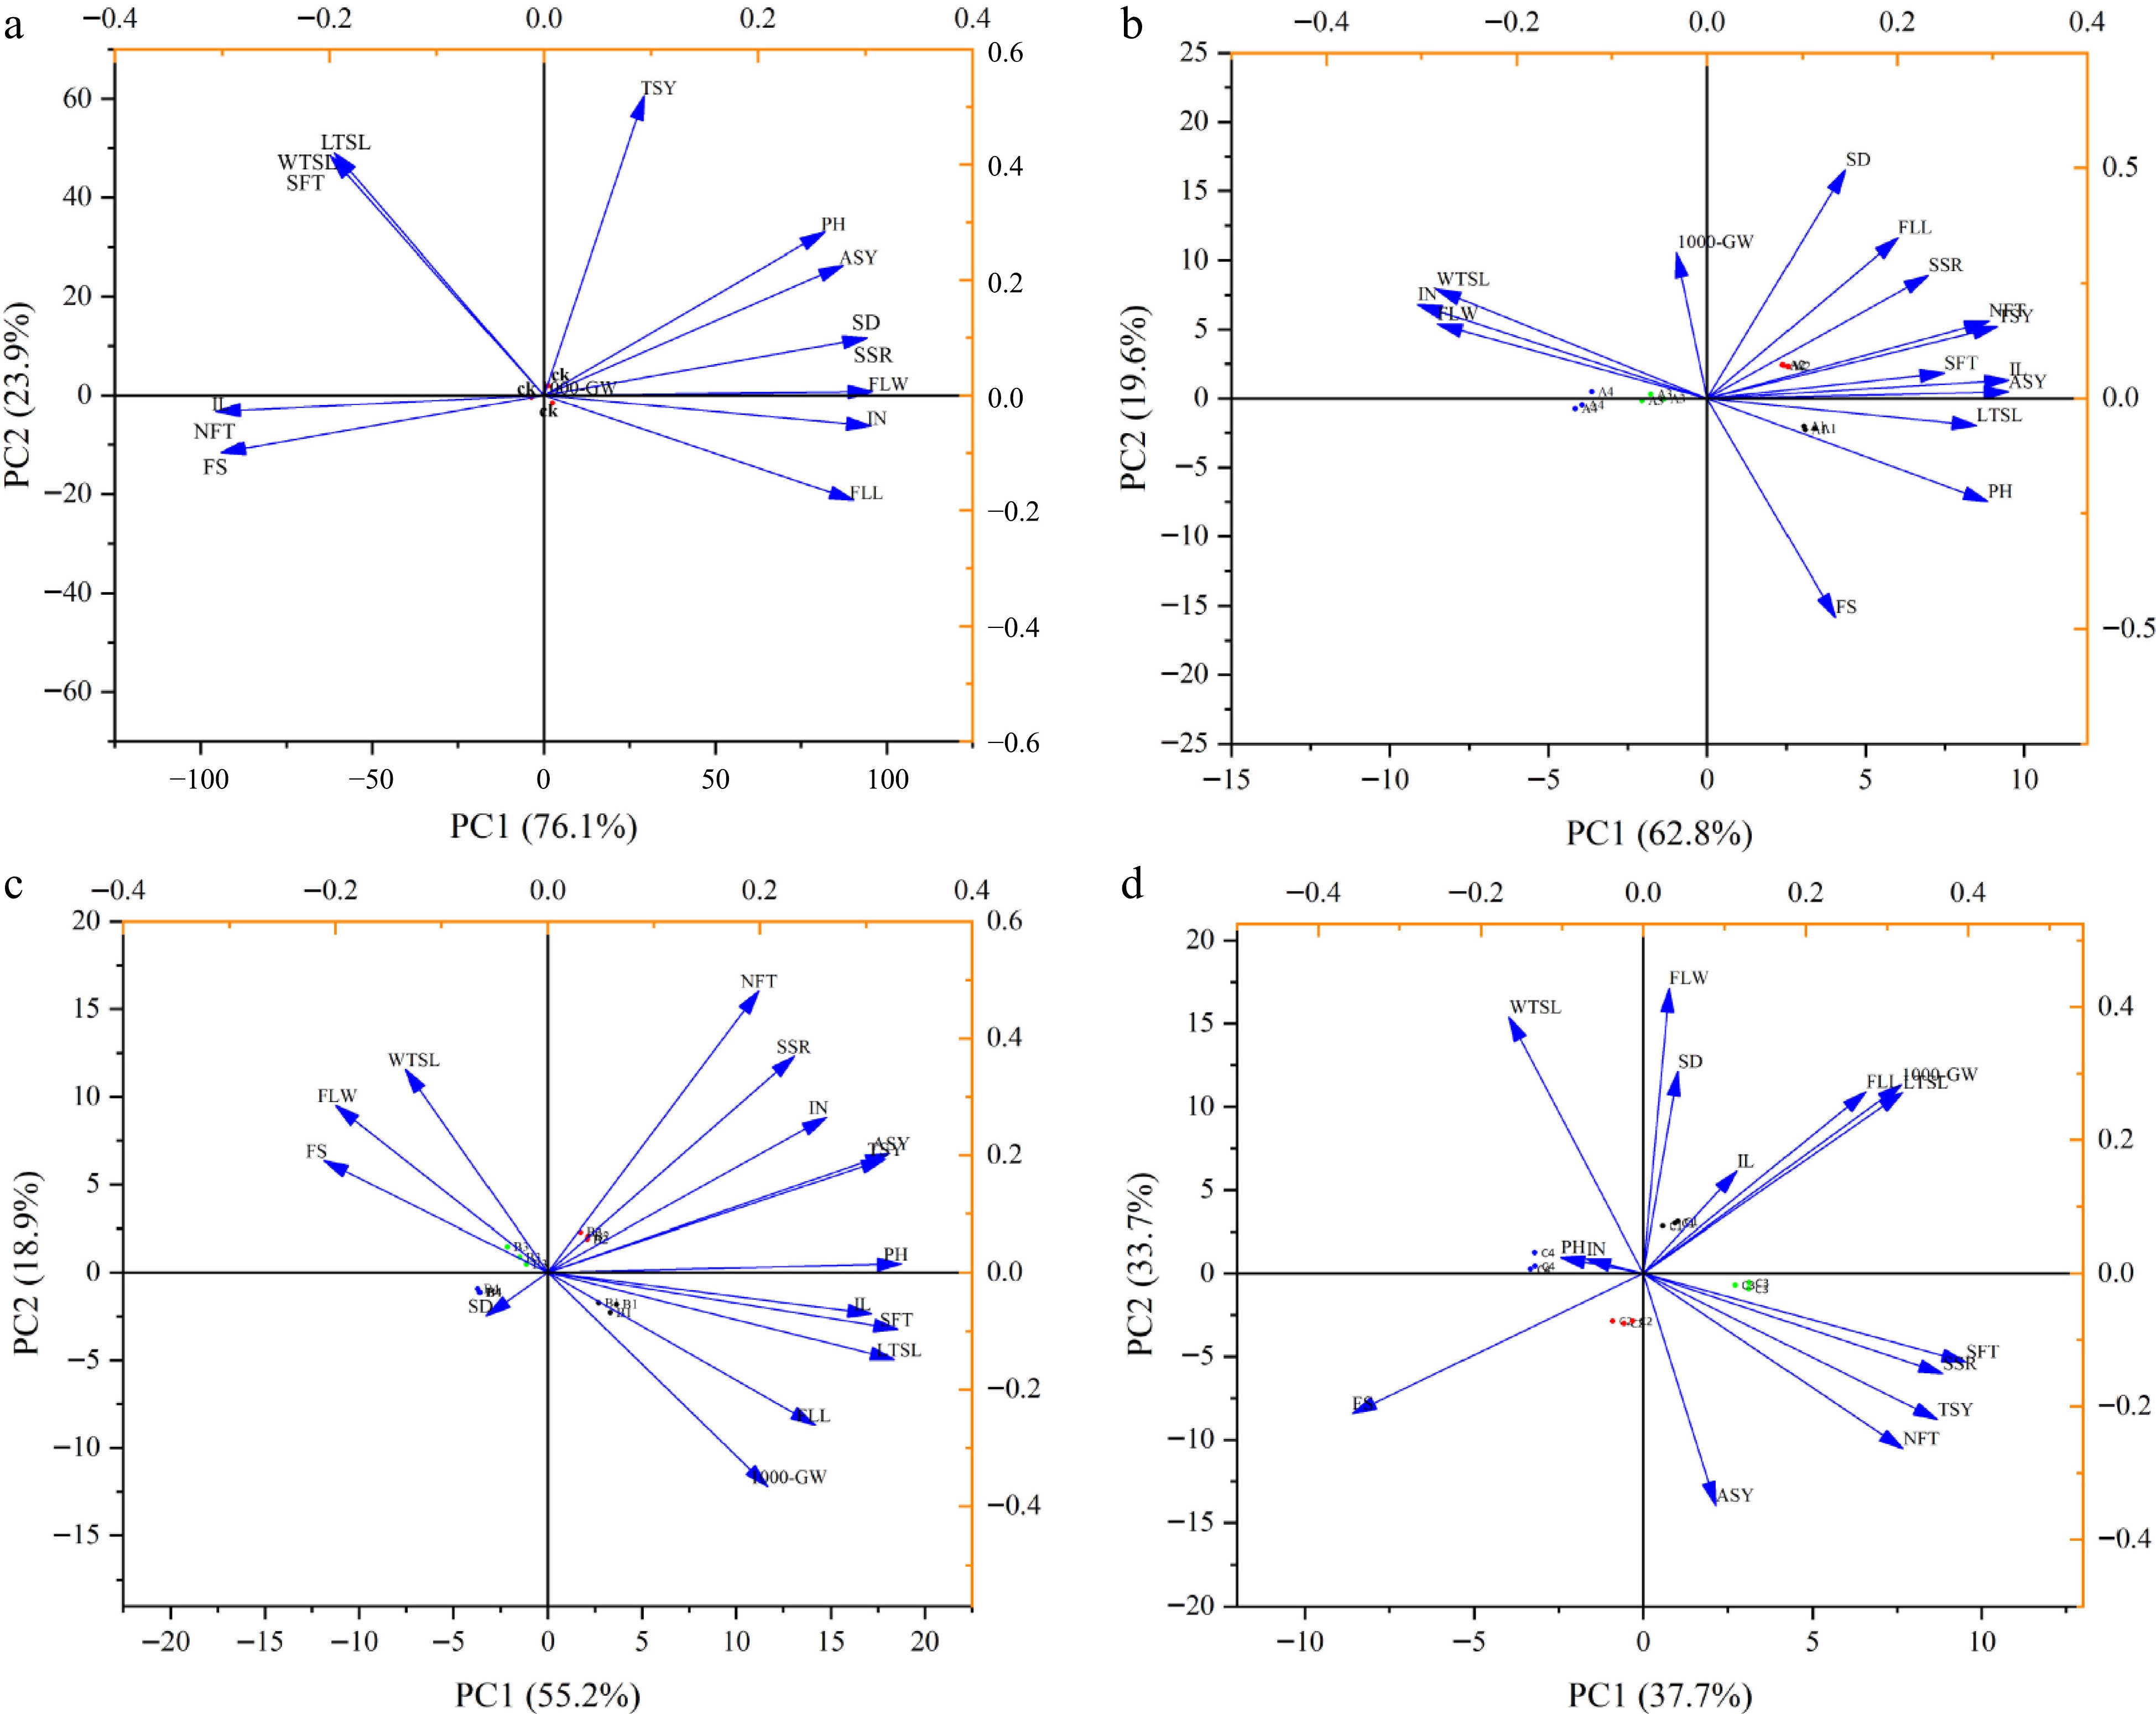
Figure 3.
Principal component analysis of morphological and reproductive traits of Dactylis glomerata under different PGRs of treatment, (a) CK, (b) CCC, (c) TE, and (d) CCC + TE. Arrows represent physiological and reproductive traits with various lengths based on the impact of each trait on the separation of treatments. The 15 traits parameters (PH Plant height, IN Internode number, IL Internode length, SD Stem diameter, FLW Flag leaf width, FLL Flag leaf length, WTSL Width of top second leaf, LTSL Length of top second leaf, NFT The number of fertile tillers, SFT Spikes per fertile tillers, FS Florets per spikelet, SSR Seed setting rate, TSW 1000-seed weight, ASY Actual seed yield, TSY Theoretical seed yield) are shown.
-

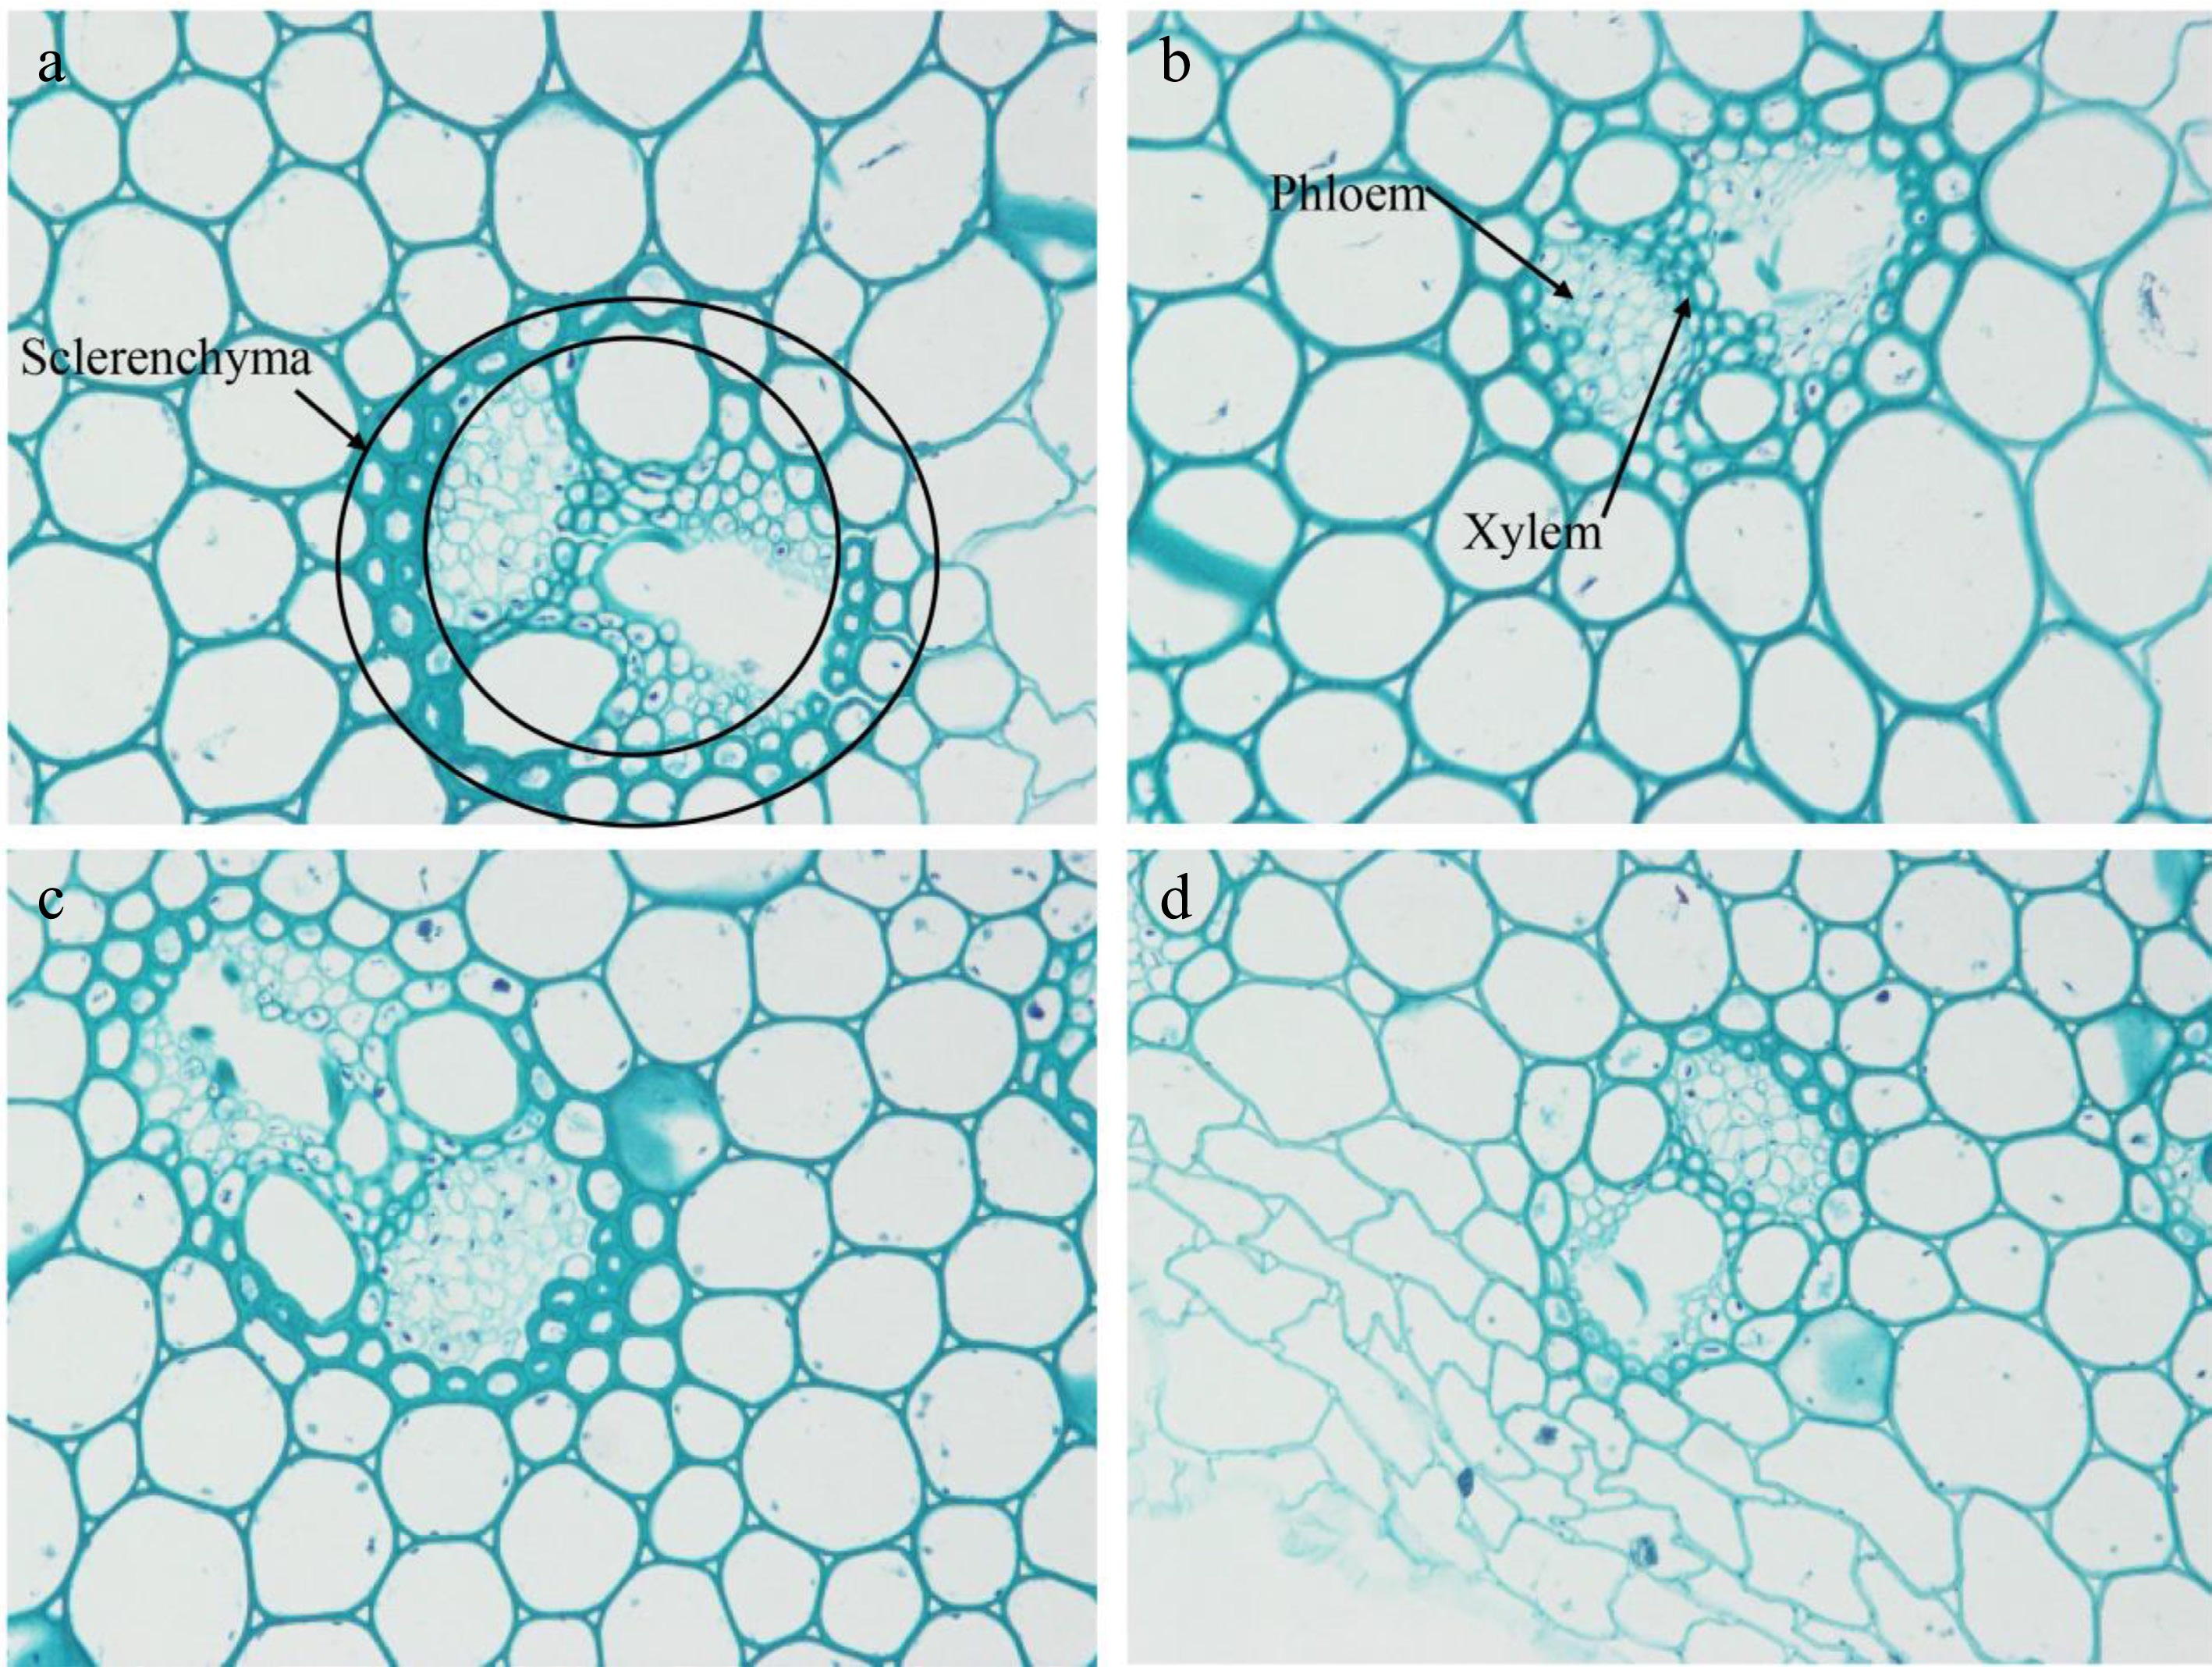
Figure 4.
Transverse section of vascular bundle of Dactylis glomerata. The microstructure of vascular bundle cells of (a) CCC, (b) TE, (c) CCC + TE, and (d) control are shown. All the images are at 400 x microscopic. The cells between the two black circles were sclerenchyma cells as shown in (a) and the arrows point to phloem and xylem in (b).
-
Treatment Serial number Application rate in 2017 and 2018
at the stage of GS32 (g·hm−2)Chlorocholine chloride (A) A1 500 A2 750 A3 1,000 A4 1,250 Trinexapac-ethyl (B) B1 100 B2 200 B3 300 B4 400 Chlorocholine chloride & Trinexapac-ethyl (C) C1 500 + 50 C2 500 + 150 C3 1,000 + 50 C4 1,000 + 150 Table 1.
Experiment application rate.
-
Morphological character Reproductive character Plant height, PH (cm) The number of fertile, NFT (tillers·m−2) Internode number, IN Spikes per fertile tillers, SFT Internode length, IL (cm) Florets per spikelet, FS Stem diameter, SD (mm) Seed setting rate, SSR (%) Flag leaf width, FLW (mm) 1000-seed weight, TSW (g) Flag leaf length, FLL (cm) Actual seed yield, ASY (kg·hm−2) Width of top second leaf,
WTSL (mm)Theoretical seed yield, TSY (kg·hm−2) Length of top second leaf,
LTSL (cm)Table 2.
Total measurement index.
-
PGR No. Plant height (cm) Internode number Internode length (cm) Stem diameter (mm) Flag leaf width (mm) Flag leaf length (cm) Width of top
second leaf (mm)Length of top second leaf (cm) A CK 129.9a 4.58d 14.90a 5.18b 7.82b 31.42a 7.96a 39.34a A1 119.6b 4.22e 12.12b 4.75c 7.66c 29.20b 7.35c 36.72b A2 106.7c 4.81c 12.00bc 5.30a 7.84b 31.56a 7.68b 36.12bc A3 98.6d 5.25b 10.20c 4.92b 8.01a 27.65b 7.92a 33.40c A4 94.0d 5.52a 9.40c 4.69c 8.13a 28.66b 7.94a 34.29c B CK 129.9a 4.58a 14.90b 5.18a 7.82bc 31.42a 7.96d 39.34ab B1 119.8b 4.25bc 15.43a 4.98b 7.67c 31.02a 7.87d 40.00a B2 116.0c 4.30b 14.98b 4.68c 8.28a 30.03ab 8.61a 36.96c B3 111.6d 4.26bc 13.63c 5.15a 7.99b 27.99c 8.15c 36.23c B4 104.2e 3.91c 13.62c 4.87b 8.34a 29.31b 8.51b 35.70c C CK 129.9a 4.58a 14.90b 5.18b 7.82bc 31.42a 7.96b 39.34a C1 118.9b 4.06b 15.61a 5.39a 8.41a 30.33b 8.39a 37.85b C2 119.1b 4.07b 14.65b 4.79c 7.46d 25.93d 7.67c 34.72c C3 110.8c 3.71d 13.97bc 4.72d 7.78c 31.10a 7.87b 37.61b C4 114.0c 3.83c 13.60bc 4.79d 7.92b 28.13c 8.43a 35.15c Different letters in the same column indicate significant differences at the p < 0. 05 level. Table 3.
Effects of plant growth regulators on the morphology characters of Dactylis glomerata in 2017−2018.
-
PGR No. The number of fertile (tillers·m−2) Spikes per fertile tillers Florets per spikelet Seed setting rate (%) 1000-grain weight (g) Actual seed yield (kg·hm−2) Theoretical seed yield (kg·hm−2) A CK 116.50d 366.28a 4.01c 45d 0.62b 216c 1,057d A1 150.165b 365.57a 4.29a 53b 0.61b 253a 1,443b A2 167.25a 367.19a 4.11bc 55a 0.64a 248a 1,601a A3 132.75c 353.35b 4.13b 52bc 0.61b 222b 1,194c A4 89.42e 350.16b 4.15b 50c 0.63ab 186d 823e B CK 116.50d 366.44c 4.01c 45c 0.62b 216d 1,057e B1 141.67bc 449.22a 4.18b 52b 0.64a 278b 1,690b B2 163.59a 424.595b 4.27a 55a 0.62b 297a 1,820a B3 146.25b 355.58d 4.43a 53ab 0.62b 240c 1,412c B4 131.42c 359.17d 4.35a 45c 0.63b 209d 1,270d C CK 116.5e 366.44d 4.01b 45d 0.62b 216d 1,057e C1 135.17c 432.67c 4.06b 61b 0.66a 270bc 1,561c C2 147.34b 443.33b 4.42a 63ab 0.61b 320a 1,783b C3 159.42a 485.24a 4.12b 66a 0.65a 280b 2,068a C4 132.58d 362.69e 4.51a 53c 0.62b 256c 1,322d Different letters in the same column indicate significant differences at the p < 0.05 level. Table 4.
Effects of PGRs on seed yield and yield characters of Dactylis glomerata L. in 2017−2018.
-
PGR No. Actual seed yield (kg·hm−2) Increase production compared with the control (kg·hm−2) Yield increase rate (%) CK 216.3 − − A A1 253.7 37.3 17.26 A2 248.4 32.1 14.85 A3 221.7 5.4 2.49 A4 186.1 −30.2 −13.97 B B1 278.3 62.0 28.65 B2 297.1 80.7 37.32 B3 240.8 24.5 11.32 B4 209.2 −7.1 −3.29 C C1 269.5 53.1 24.56 C2 320.0 103.7 47.91 C3 280.2 63.9 29.53 C4 255.7 39.4 18.22 Table 5.
Effect of PGRs of different concentrations on the actual seed yield of Dactylis glomerata in 2017−2018.
-
PGR No. Sclerenchyma Xylem Cell
populationCellular
layerCell
populationCellular
layerA CK 27c 2a 8b 2b A1 32b 2a 13ab 3a A2 35a 2a 13ab 3a A3 36a 2a 14a 3a A4 35a 2a 14ab 3a B CK 27c 2a 8c 2b B1 38a 2a 12b 3a B2 38a 2a 14a 3a B3 36b 2a 14ab 2b B4 36b 2a 8c 2b C CK 27c 2a 8c 2c C1 26c 2a 11b 3b C2 37ab 2a 17a 4a C3 35b 2a 12b 3b C4 40a 2a 11b 3b Different letters in the same column indicate significant differences at the p < 0.05 level. Table 6.
Effect of PGRs of different concentrations on the vascular bundle cells of Dactylis glomerata.
Figures
(4)
Tables
(6)