-
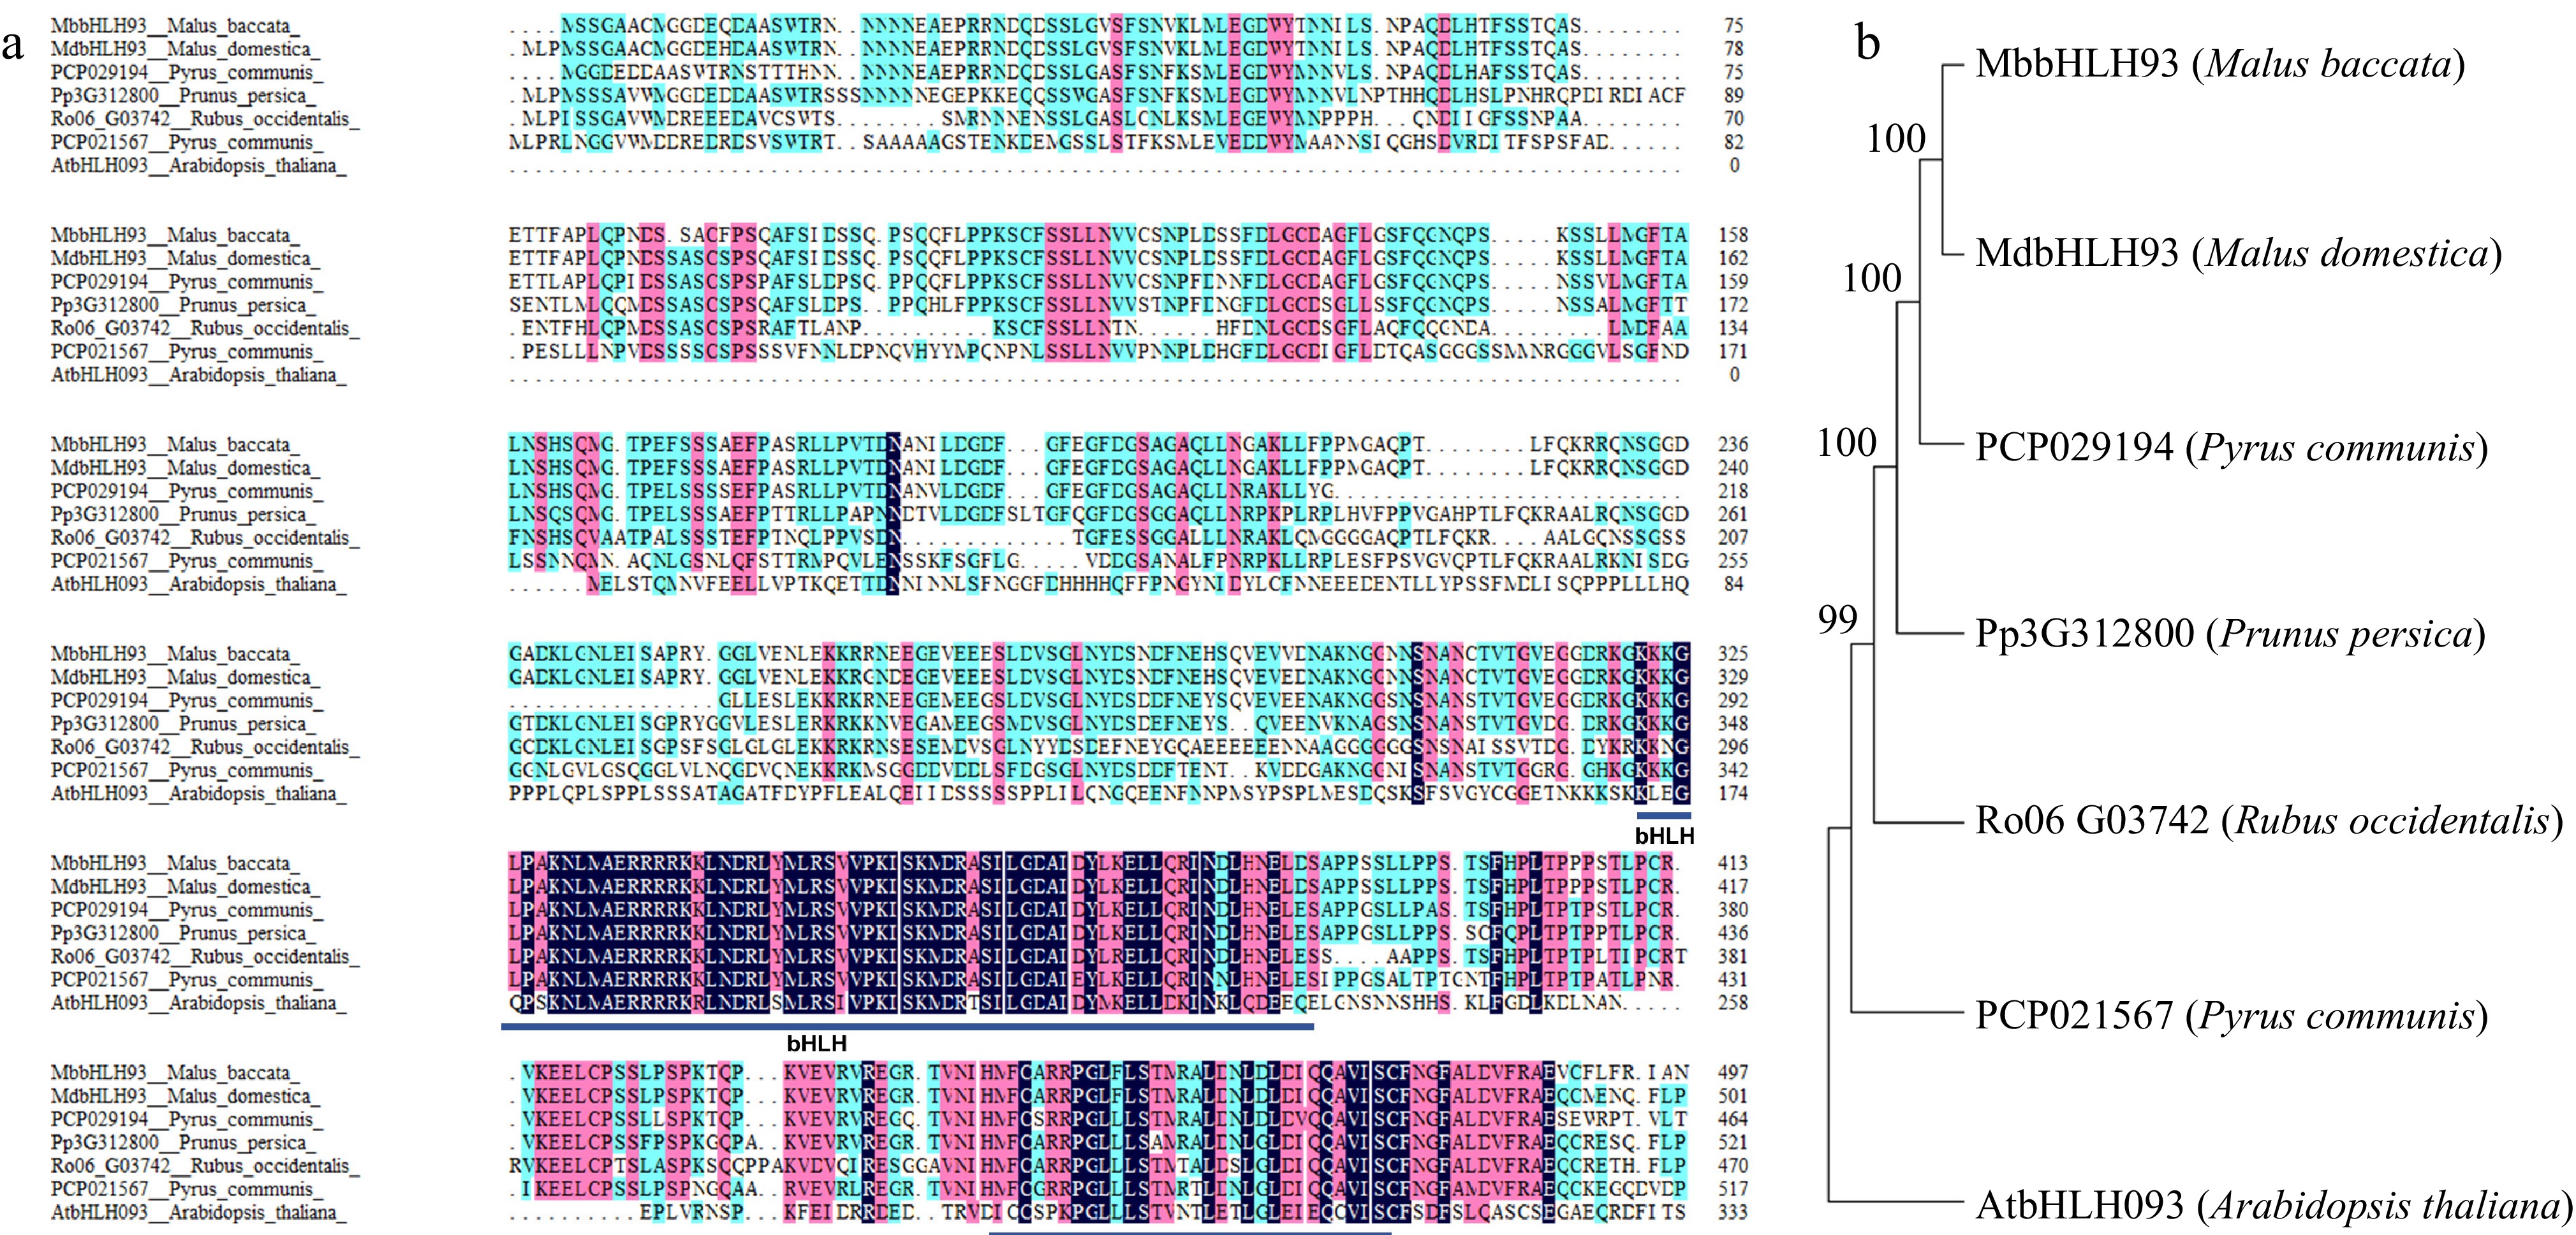
Figure 1.
Sequence alignment and phylogenetic analysis of bHLH93 in Rosaceae species. (a) Sequence alignment of MbbHLH93. The conserved amino acid residues are shown in purple. The bHLH and ACT-like domain are displayed respectively with rectangles in dark blue. (b) Phylogenetic analysis of MbbHLH93. The MbbHLH93 orthologous proteins from Arabidopsis and four Rosaceae species were obtained to build a phylogenetic tree via the maximum likelihood method based on the 1,000 bootstrap analyses of the MEGA6.0 software.
-
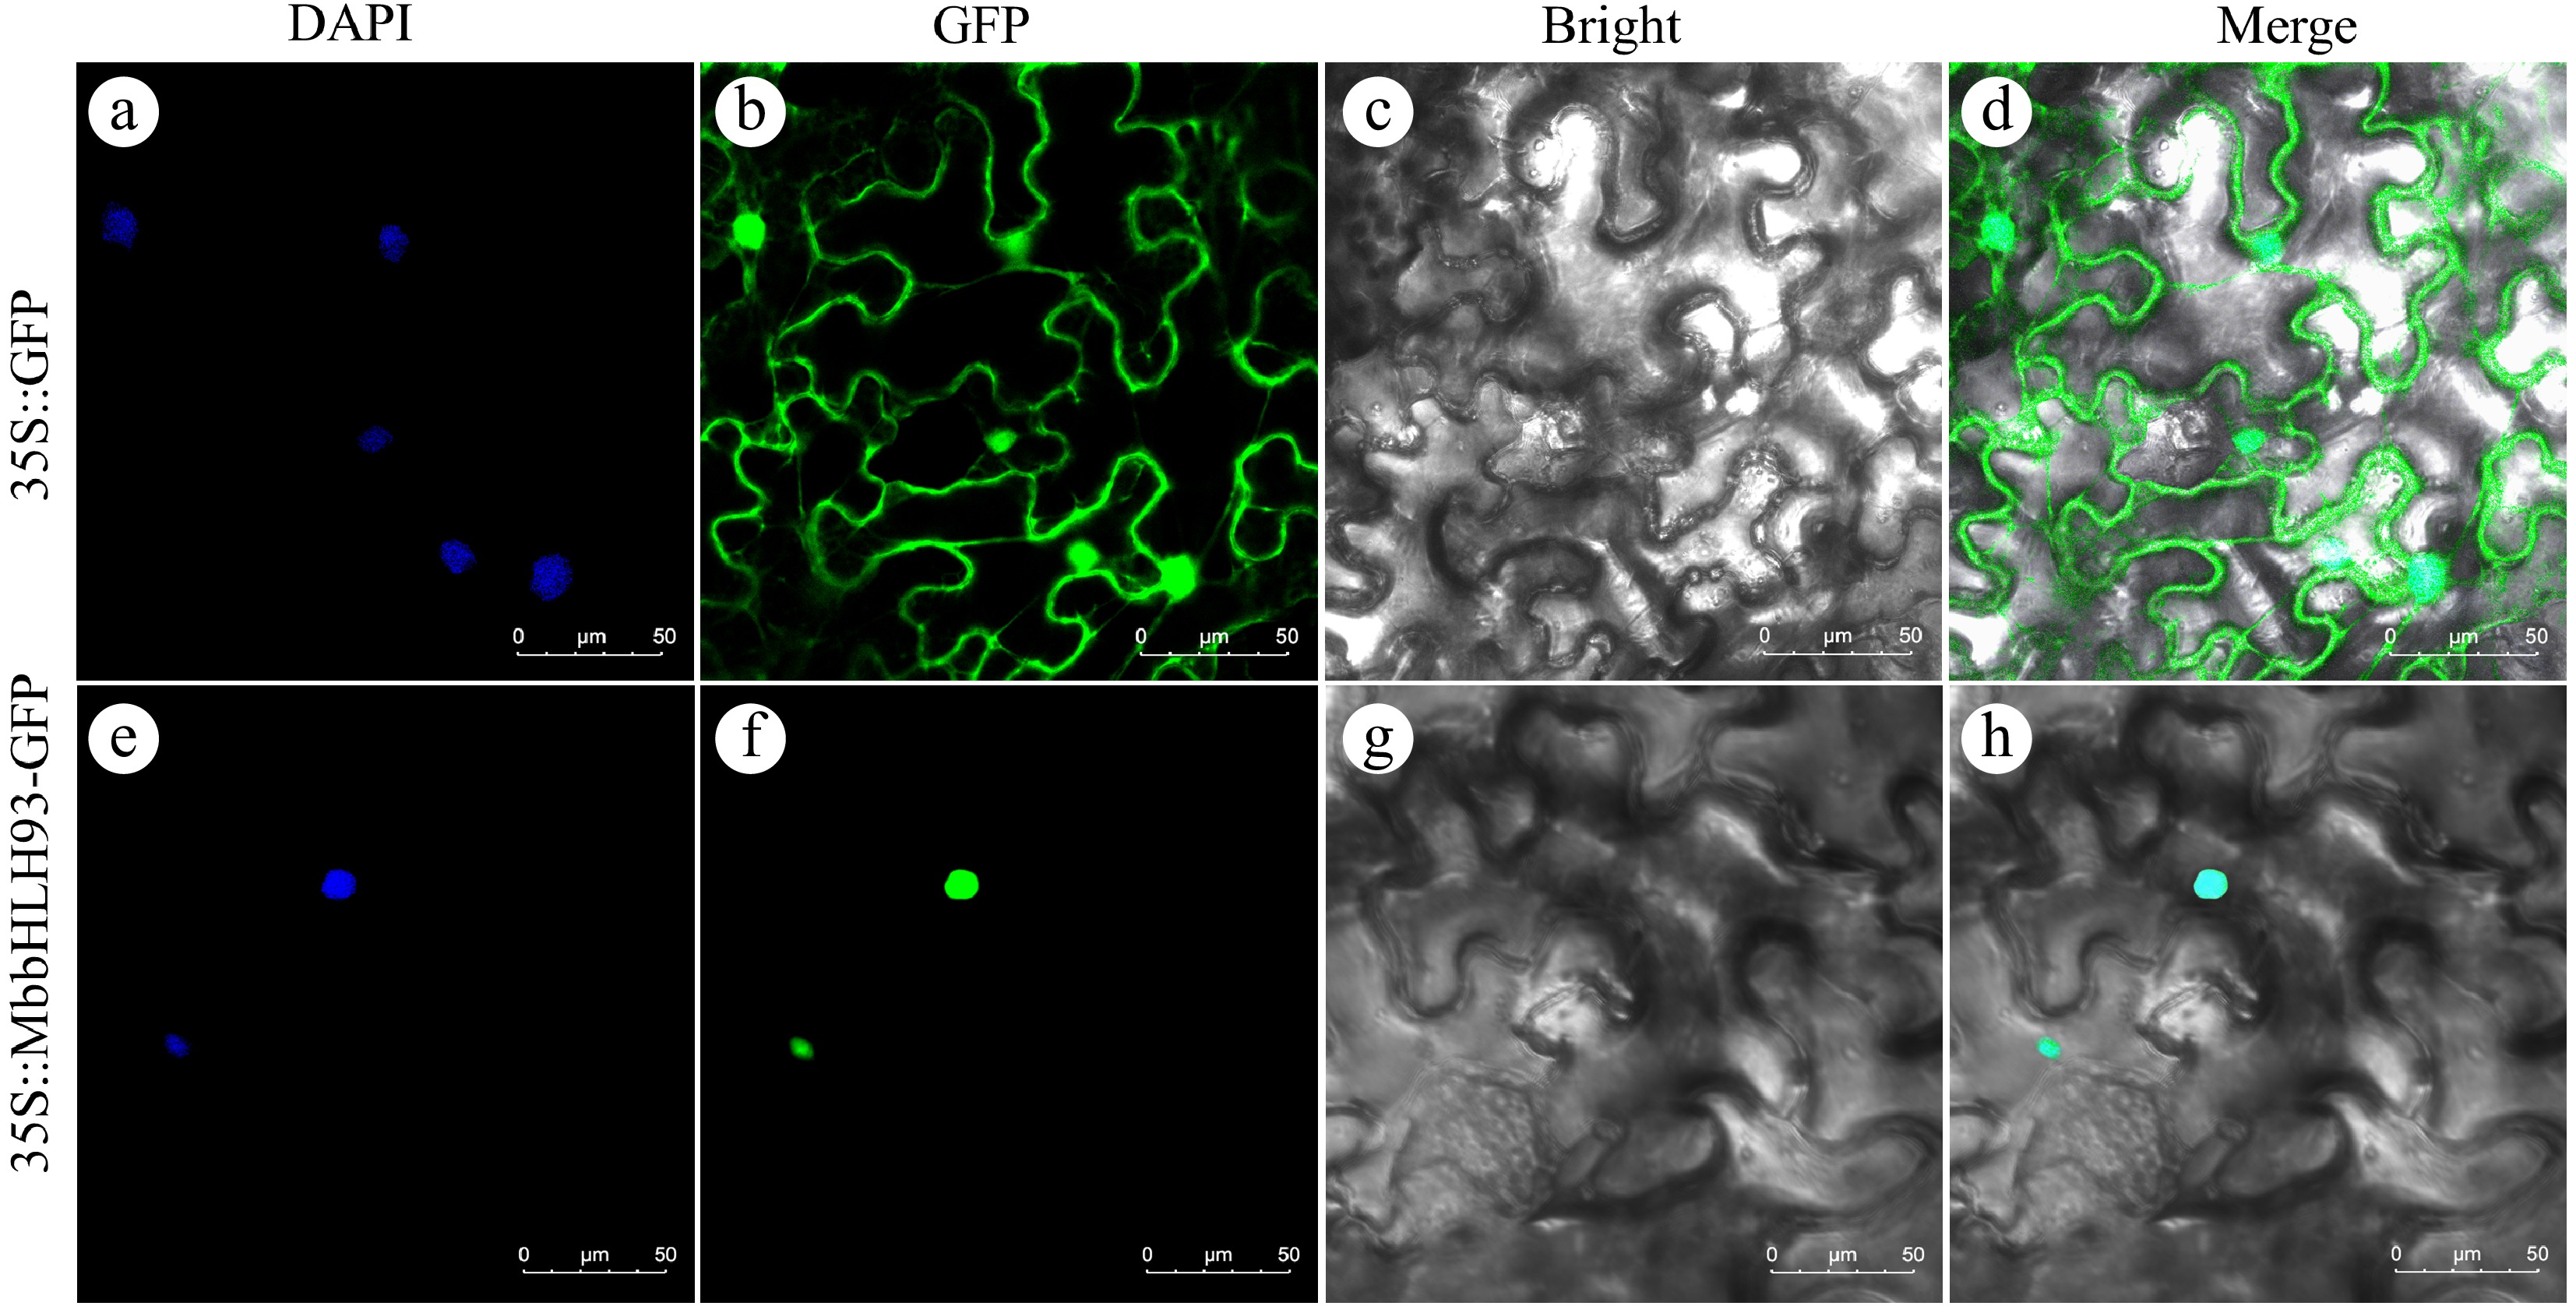
Figure 2.
Subcellular localization of MbbHLH93. 35Spro::MbbHLH93::GFP was expressed transiently into tobacco leaves with 35Spro::GFP as positive control. (a), (e) DAPI dyeing; (b), (f) GFP signals; (c), (g) bright field; (d), (h) merge. Scale bars: 50 μm.
-
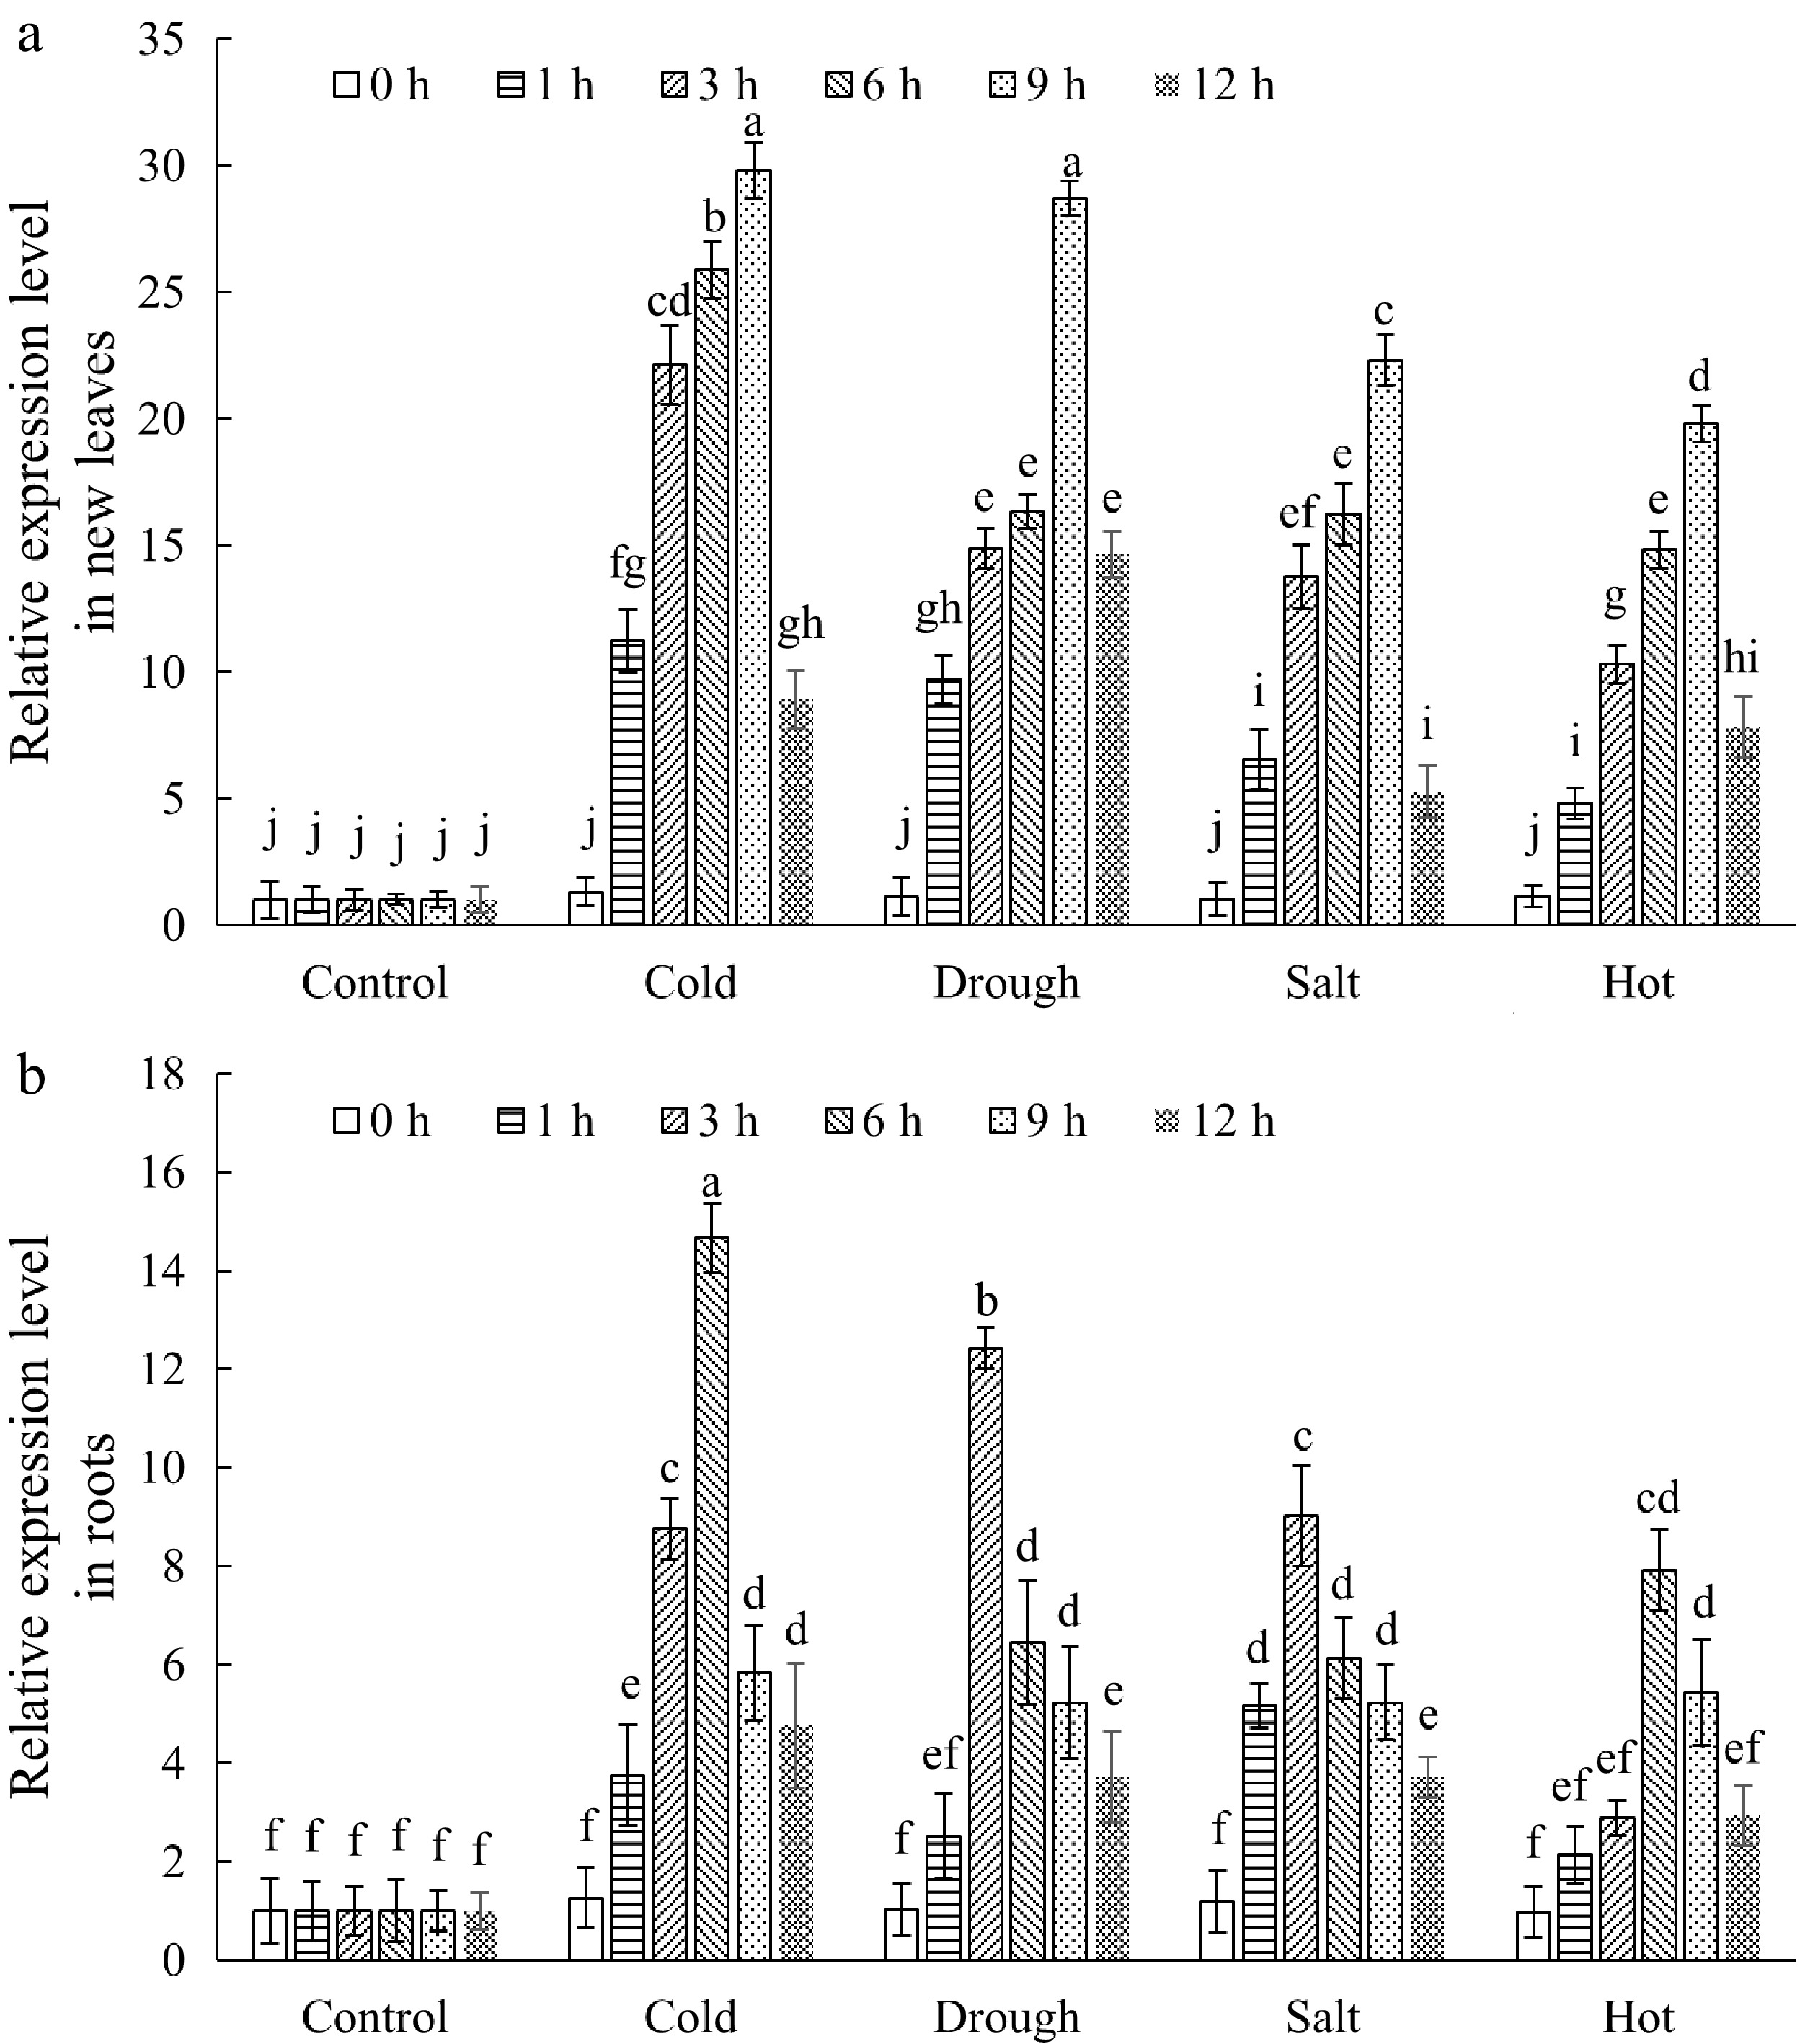
Figure 3.
The expression patterns of MbbHLH93 in Malus baccata under various stress treatments. (a) The expression levels of MbbHLH93 in new leaf under stress treatments. (b) The expression levels of MbbHLH93 in root under stress treatments. The leaf and root samples were collected 0, 1, 3, 6, 9, and 12 h after treatments. Relative expression levels of MbbHLH93 were calculated via the 2−ΔΔCᴛ method and values were shown as the mean ± standard deviation (SD) based on three repetitions. Lowercase letters displayed the significant differences at p < 0.05 (one-way ANOVA followed by Tukey's multiple range test).
-
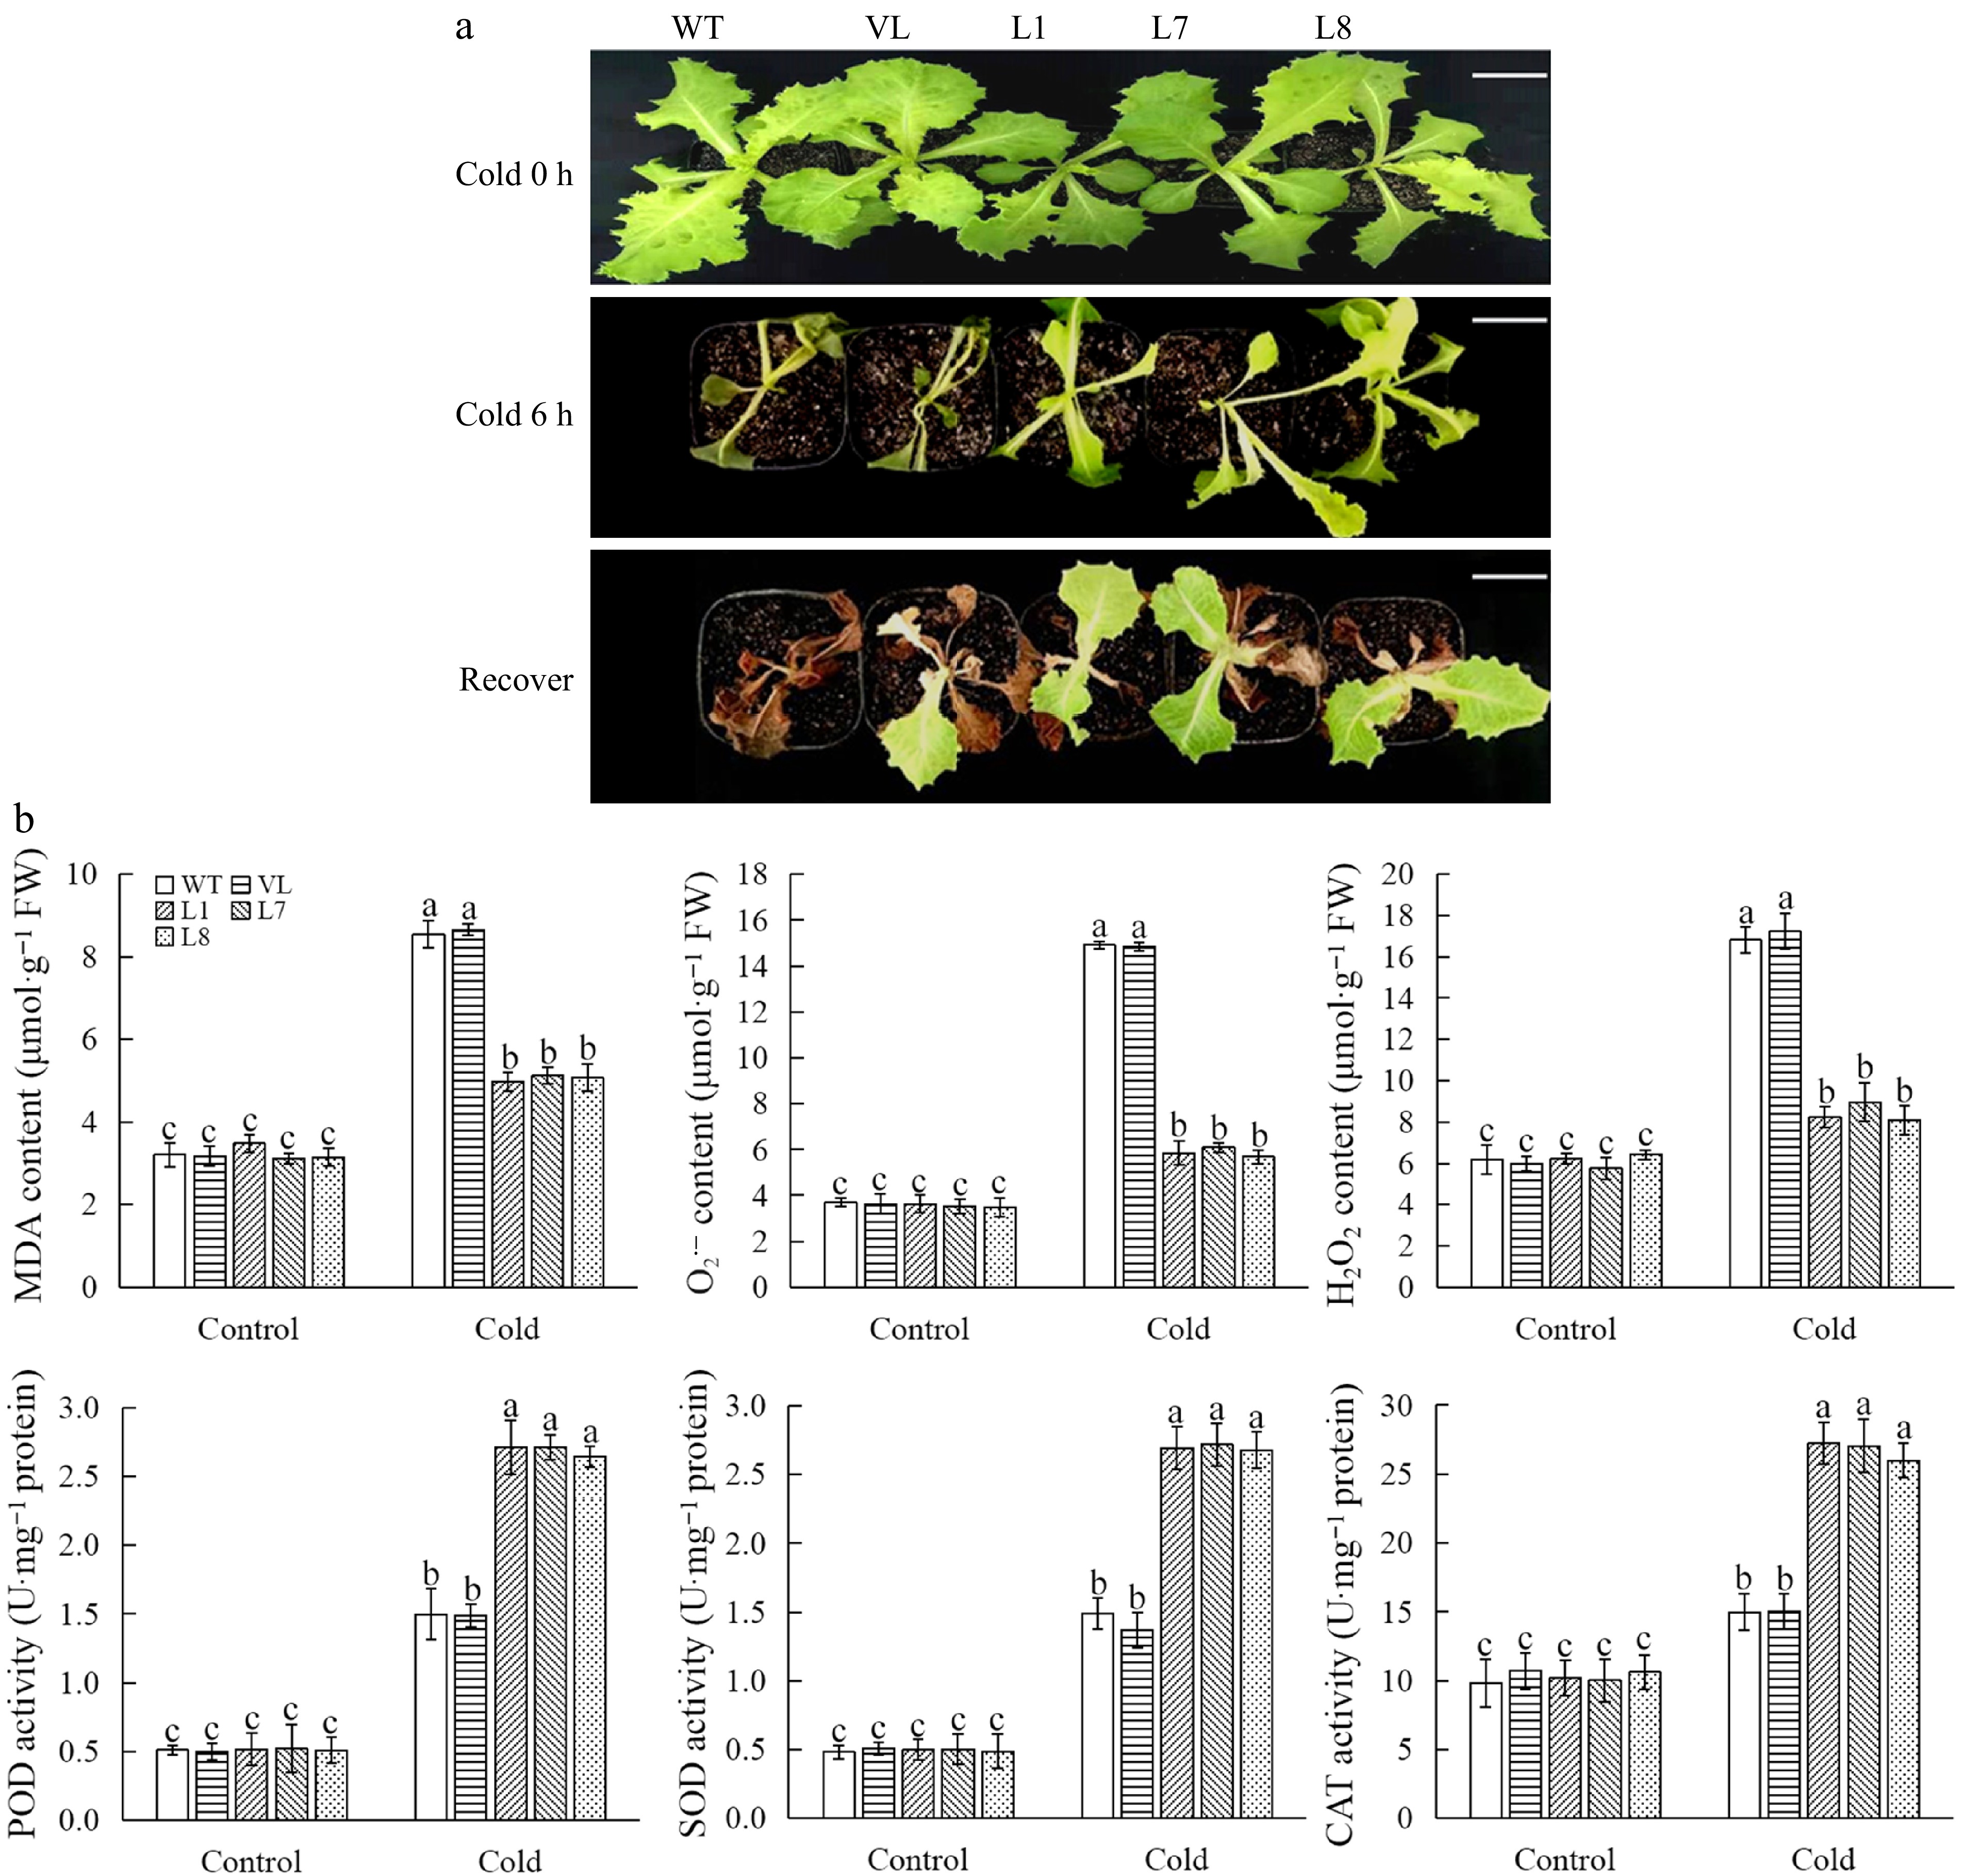
Figure 4.
MbbHLH93 enhances cold resistance of lettuce plants. (a) Phenotype of wild line (WT), vector line (VL), and MbbHLH93-overexpressed lettuce (L1, L7, L8) under cold for 0 h (control), cold for 6 h, and recovery for 15 d. Scale bar: 3 cm. (b) Determinations of physiological indices associated with cold stress in wild line (WT), vector line (VL), and MbbHLH93-overexpressed lettuces (L1, L7, L8) under cold for 0 h (control) and cold for 6 h. Values are shown as the mean ± standard deviation (SD) based on three repetitions. Lowercase letters show the significant differences at p < 0.05 (one-way ANOVA followed by Tukey's multiple range test).
-
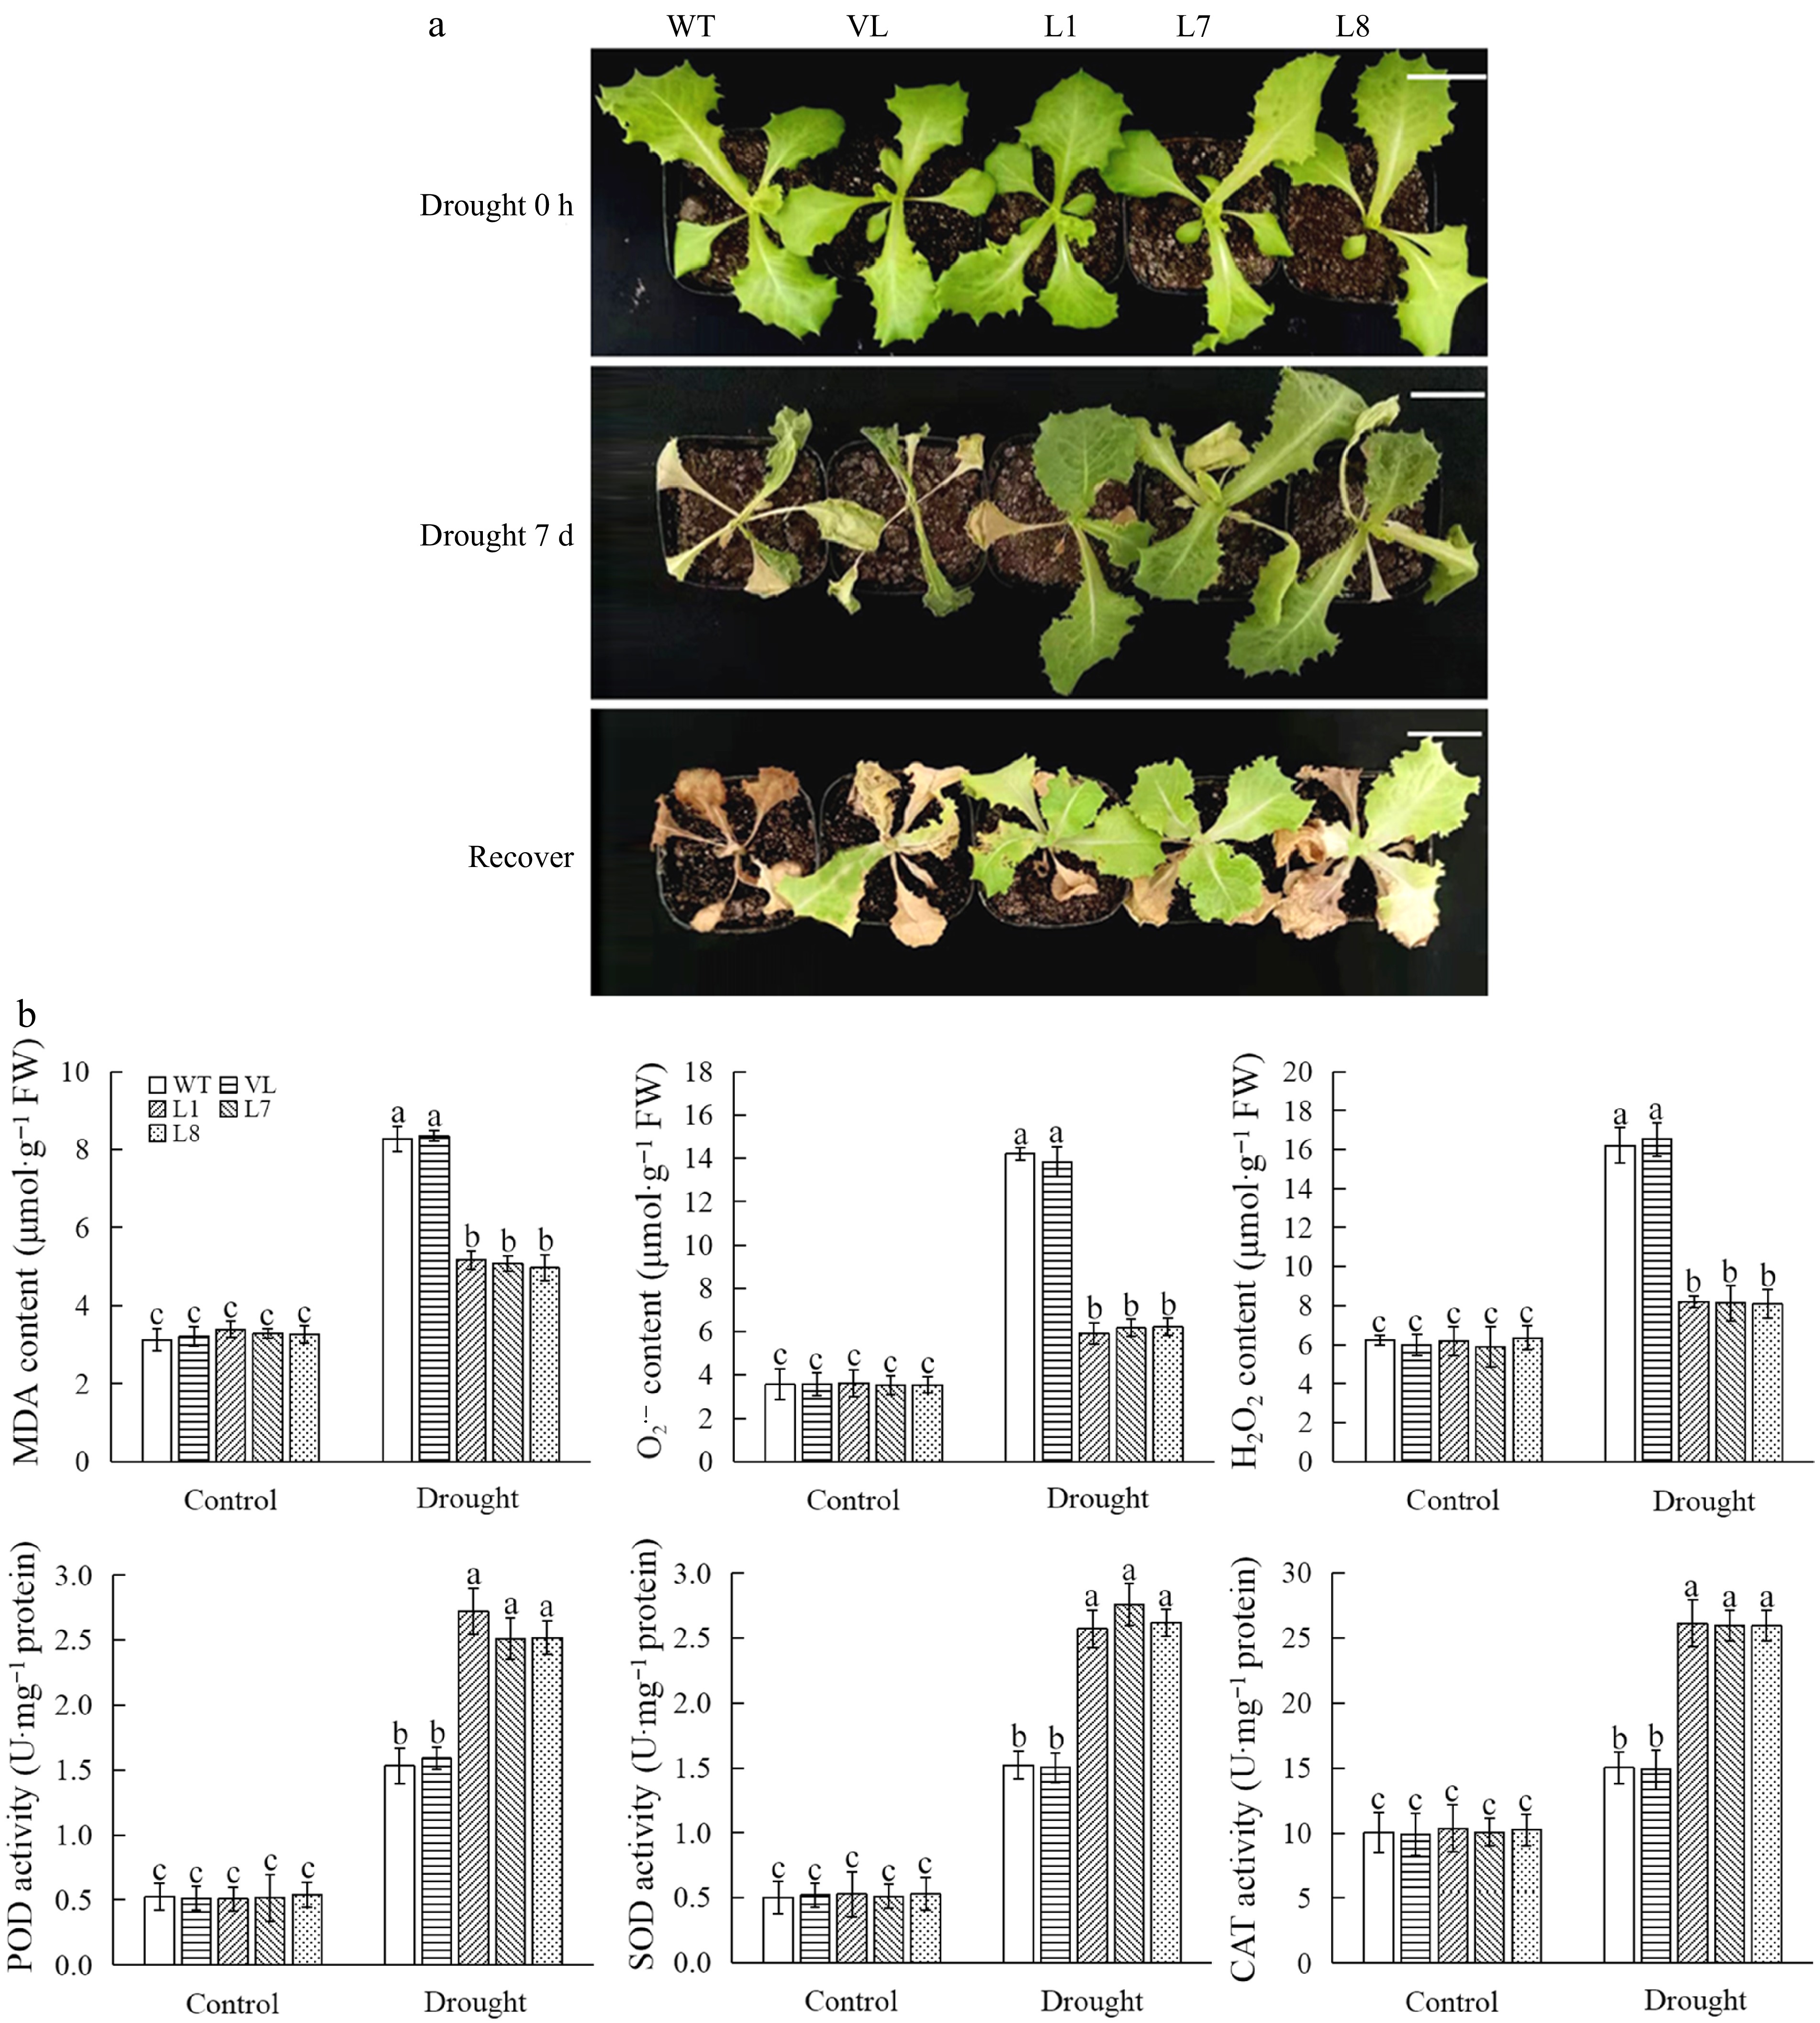
Figure 5.
MbbHLH93 enhances drought resistance of lettuce plants. (a) Phenotype of wild line (WT), vector line (VL), and MbbHLH93-overexpressed lettuces (L1, L7, L8) under drought for 0 h (control), drought for 7 d and recovery for 15 d. Scale bar: 3 cm. (b) Determinations of physiological indices associated with drought stress in wild line (WT), vector line (VL), and MbbHLH93-overexpressed lettuce lines (L1, L7, L8) under drought for 0 h (control) and drought for 7 d. Values are shown as the mean ± standard deviation (SD) based on three repetitions. Lowercase letters indicate the significant differences at p < 0.05 (one-way ANOVA followed by Tukey's multiple range test).
-
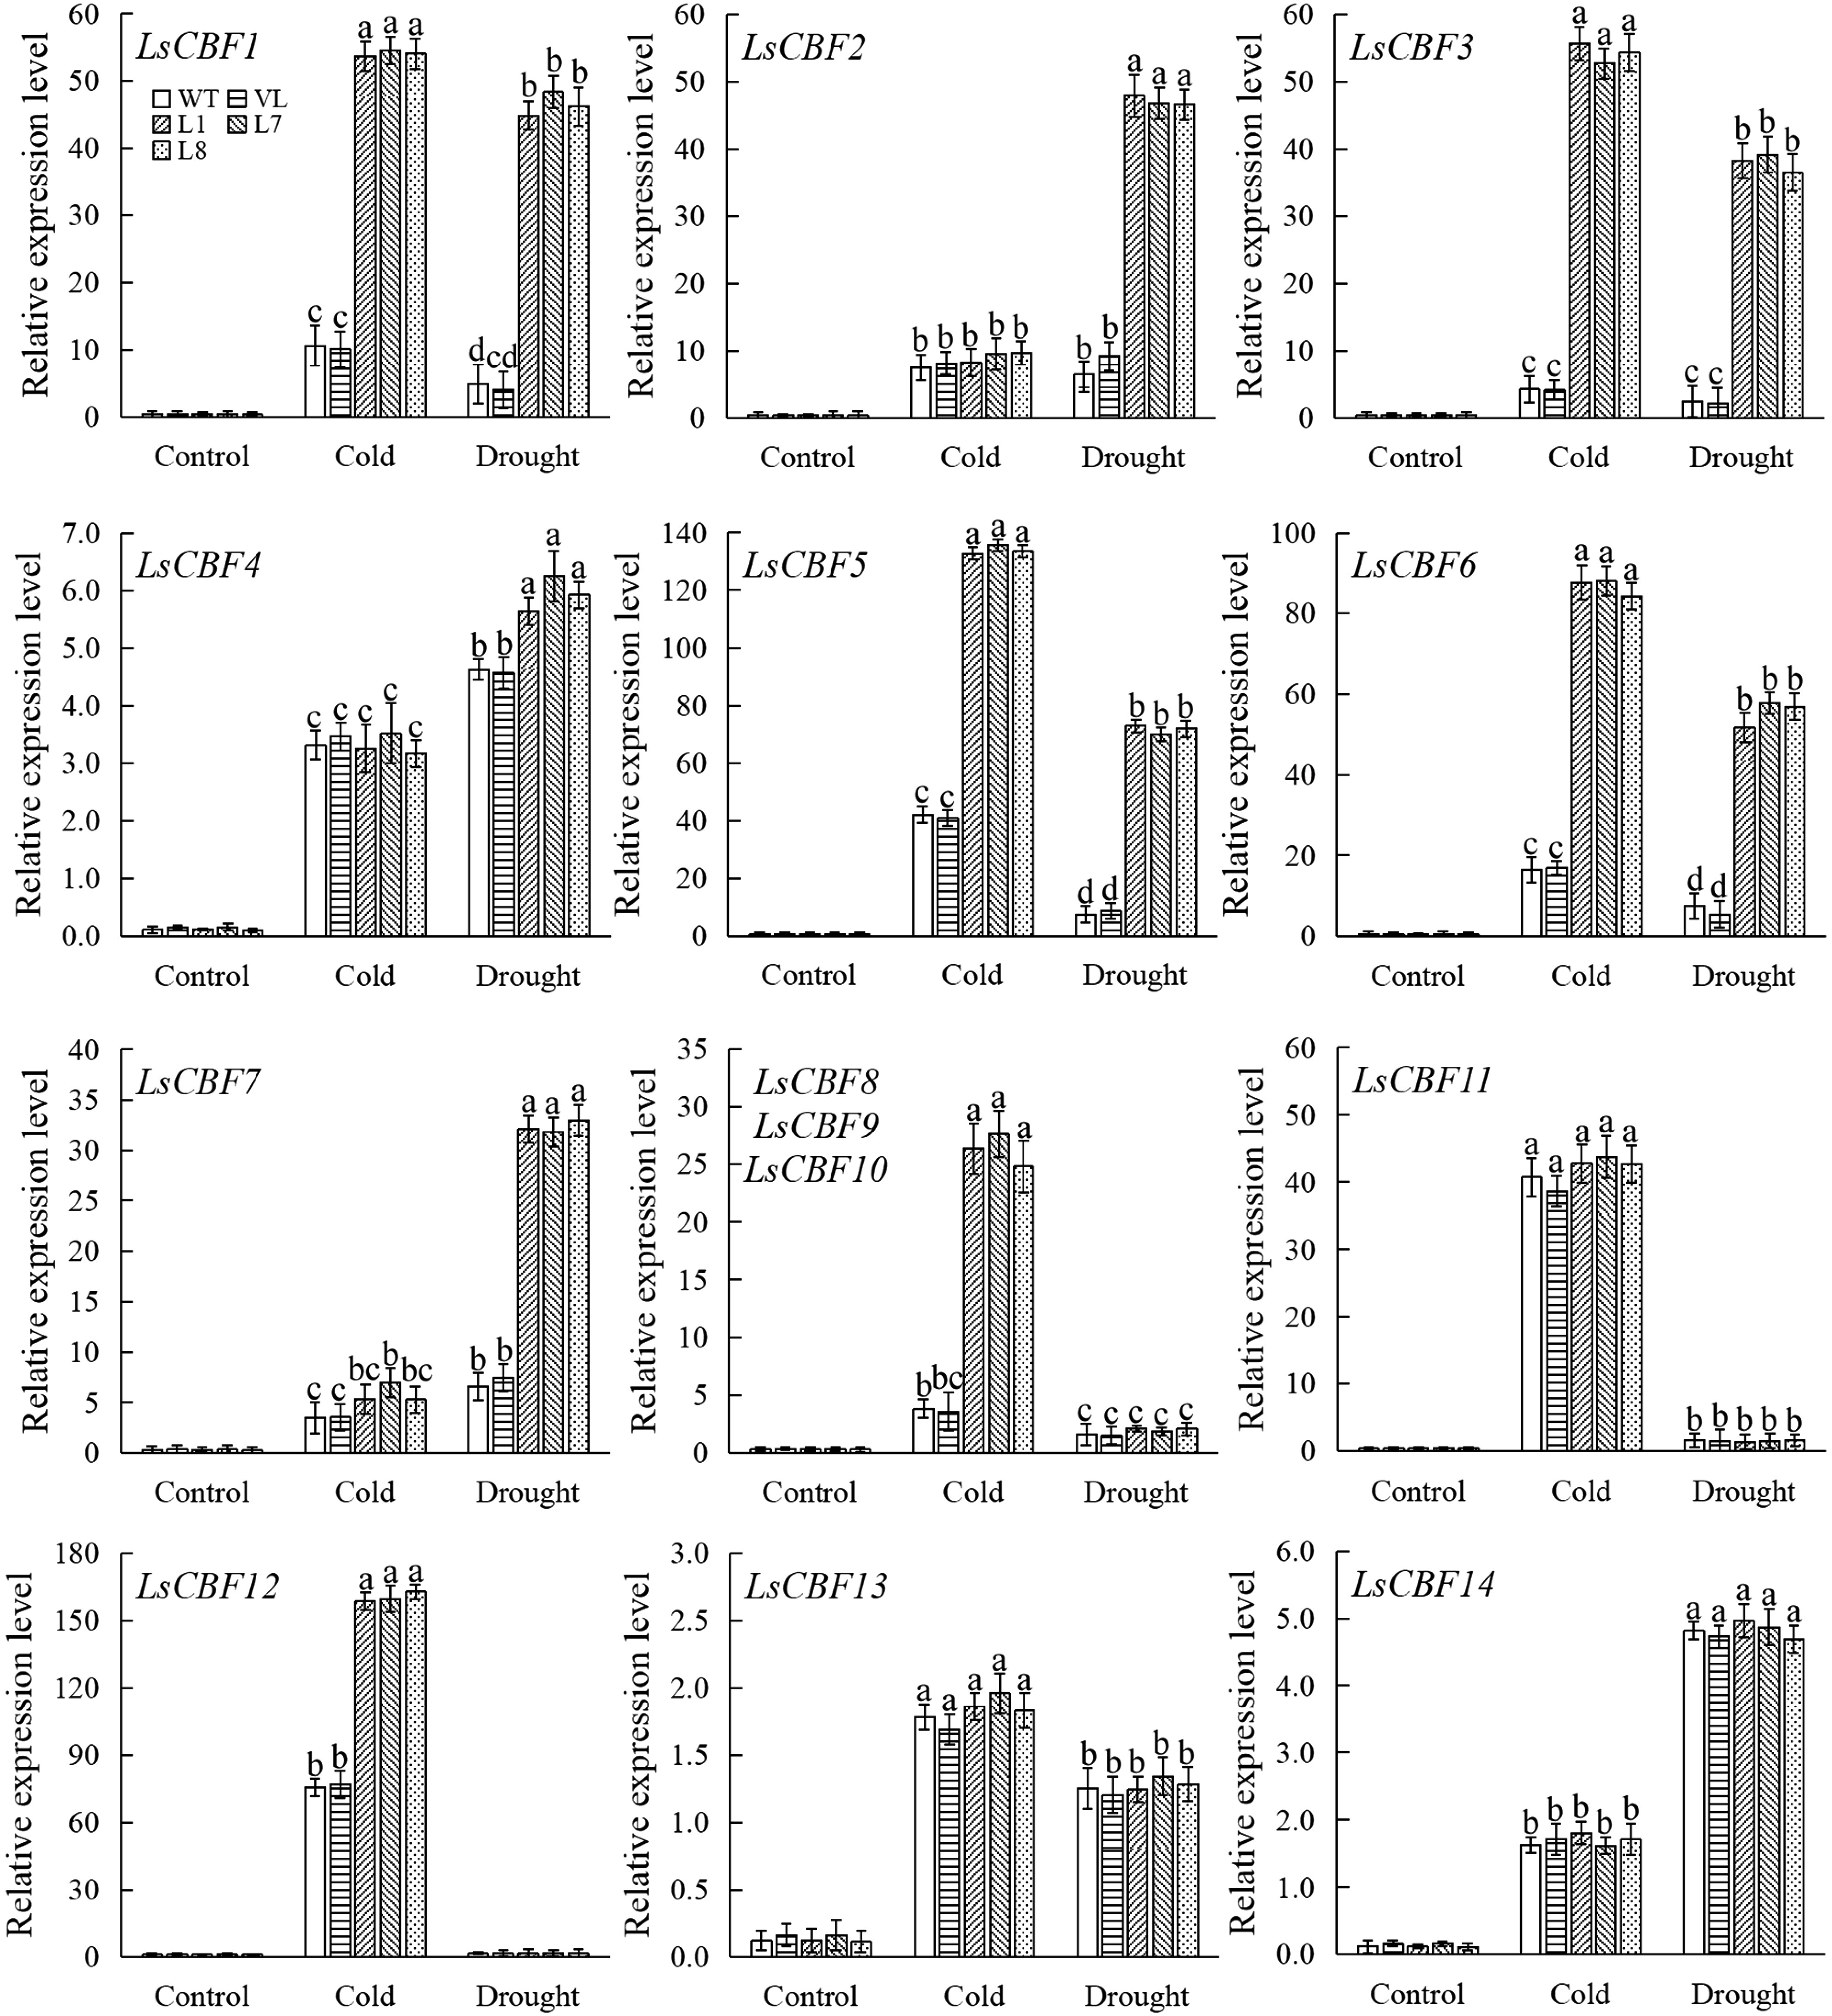
Figure 6.
Expression of LsCBF genes in wild line (WT), vector line (VL), and MbbHLH93-overexpressed lettuce lines (L1, L7, L8) after control, cold and drought stresses. LsCBF8, LsCBF9, and LsCBF10 were quantitatively amplified with the same set of primers. Relative expression levels of LsCBFs were calculated via the 2−ΔΔCᴛ method and values are shown as the mean ± standard deviation (SD) based on three repetitions. Lowercase letters indicate the significant differences at p < 0.05 (one-way ANOVA followed by Tukey's multiple range test).
-
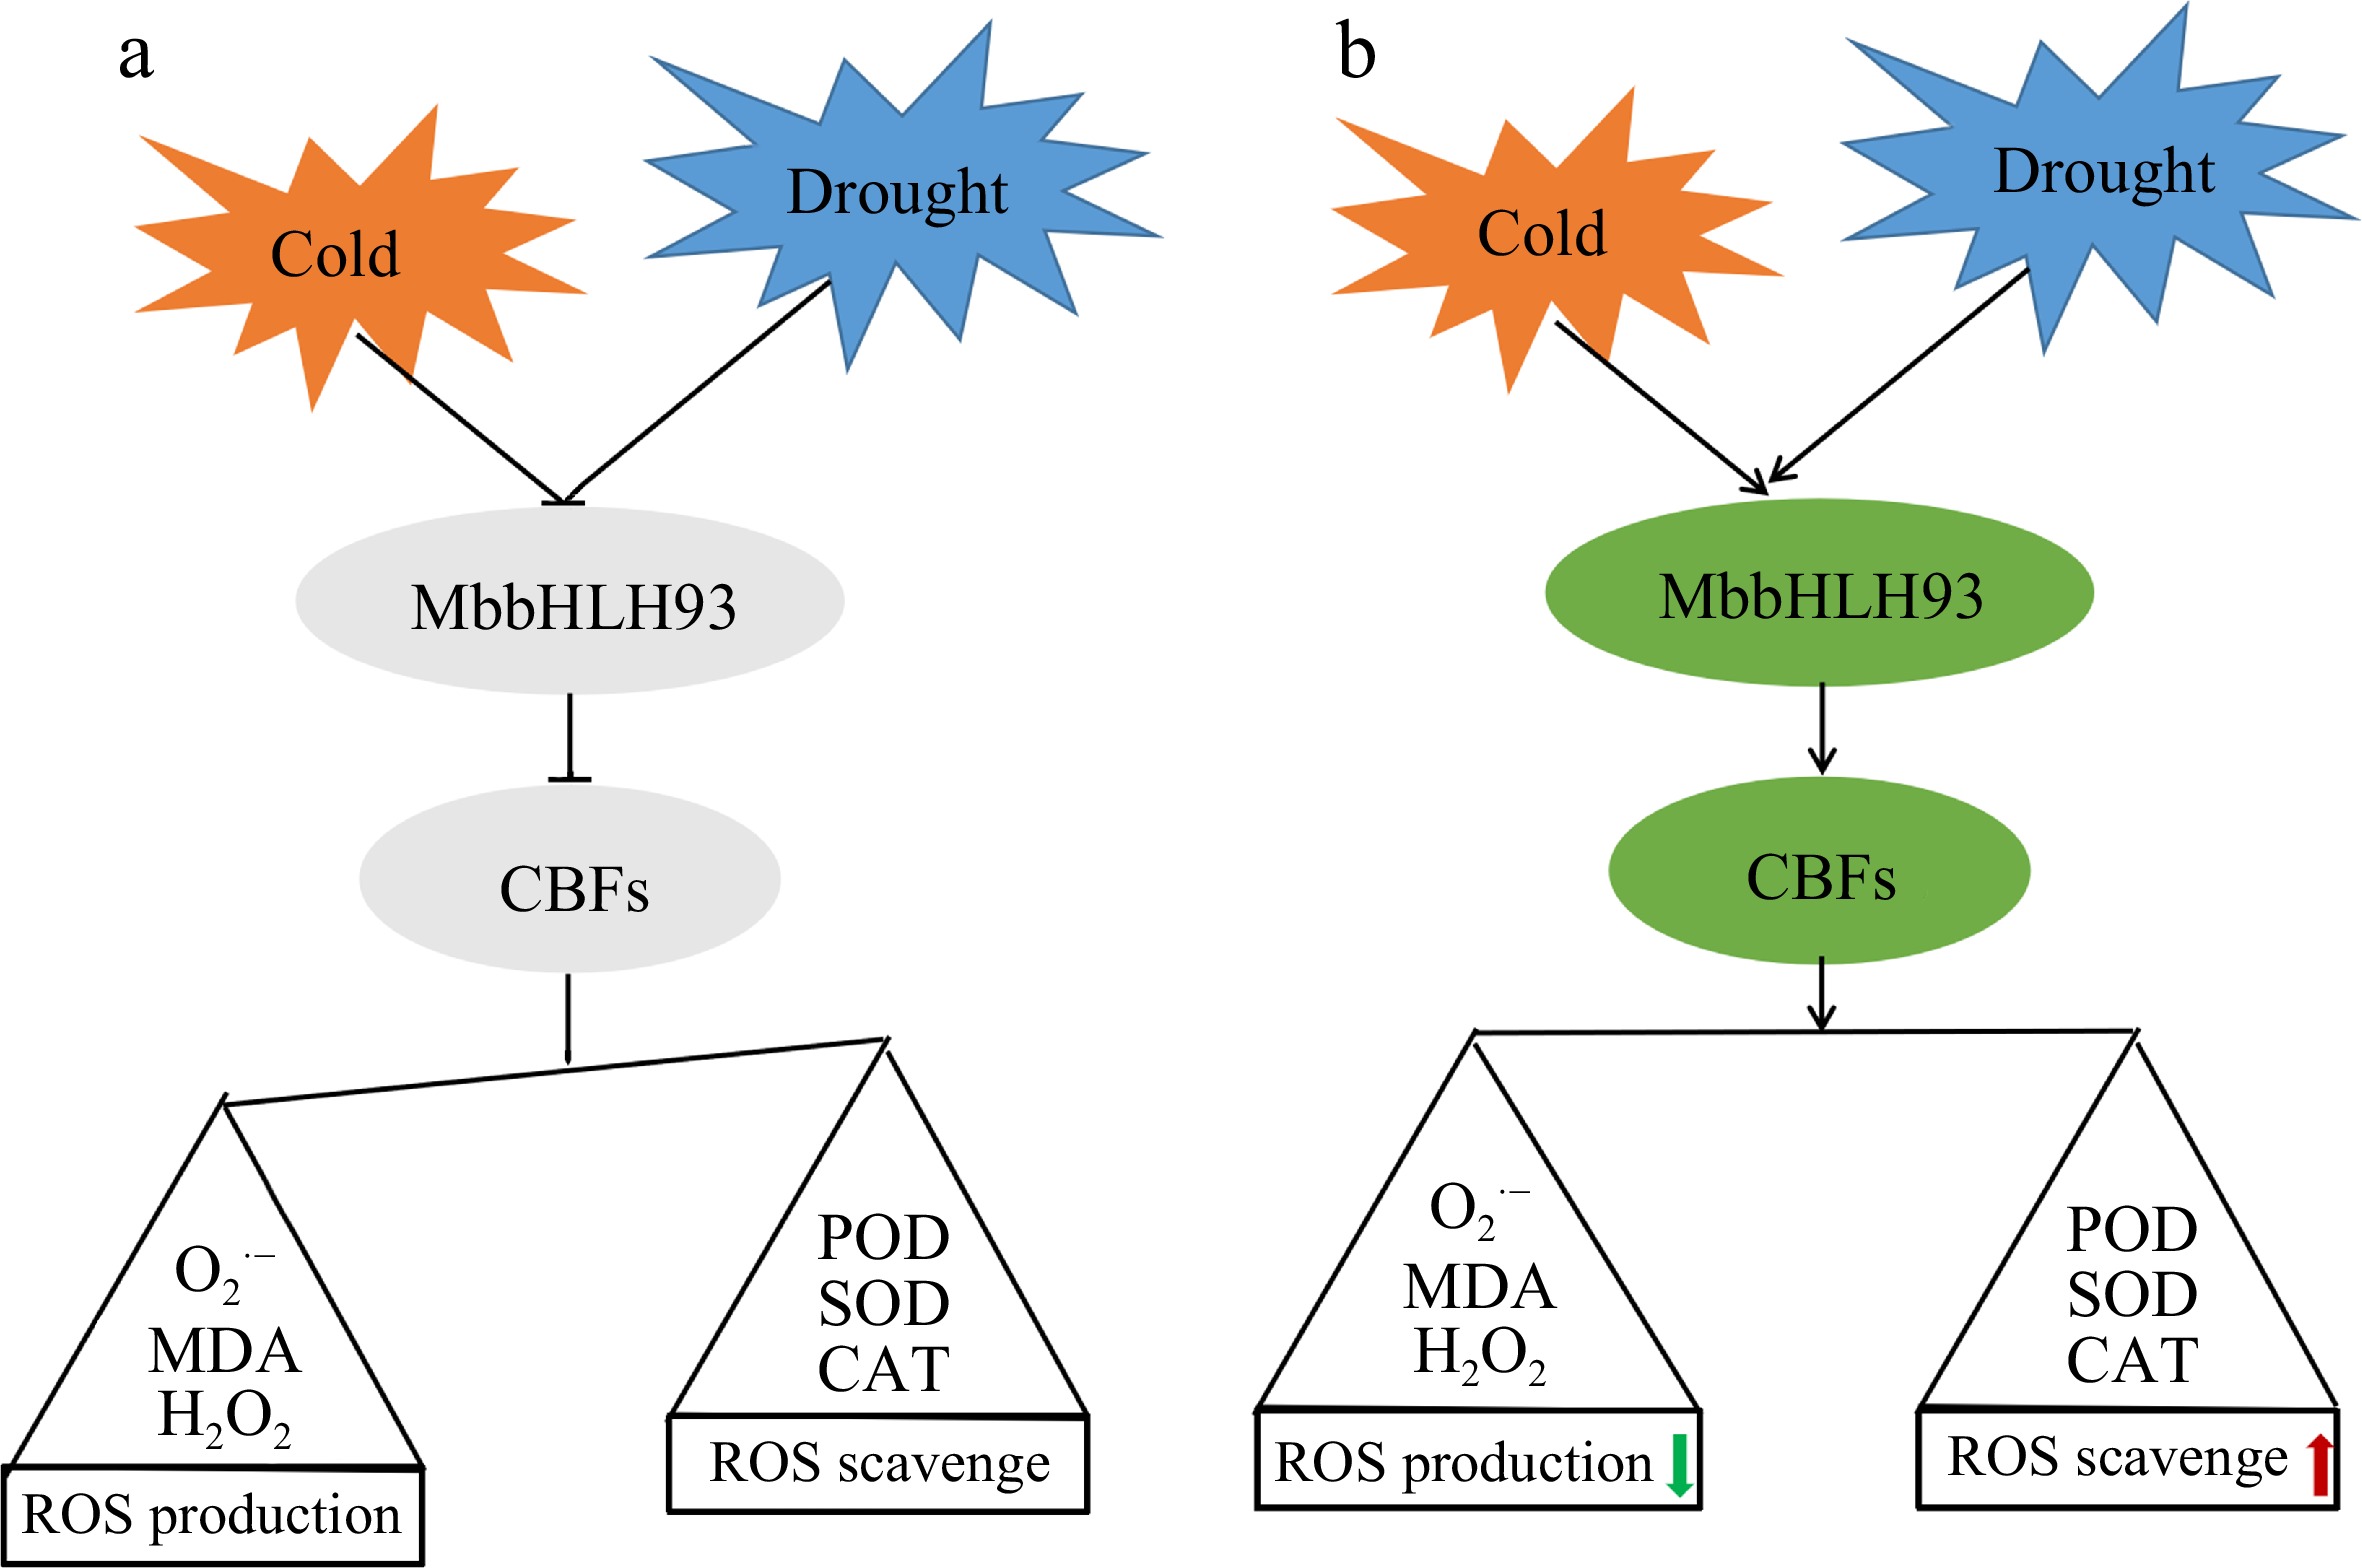
Figure 7.
Working model of MbbHLH93 function on the cold and drought adaptation in lettuce. (a) There is no MbbHLH93 in wild lettuce lines, and a large number of ROS accumulate in the cells under low temperature and drought treatment, threatening the normal growth of plants. (b) Cold and drought stress treatments rapidly induced large expression of transcription factor MbbHLH93 in MbbHLH93-overexpressed lettuce lines, and regulated lettuce plants' adaptation to stress through the classic CBF pathway. Primarily, membrane lipid peroxidation caused by large accumulation of reactive oxygen species in cells was reduced via improving the activities of antioxidant enzymes in transgenic lines, increasing plant stress resistance.
Figures
(7)
Tables
(0)