-
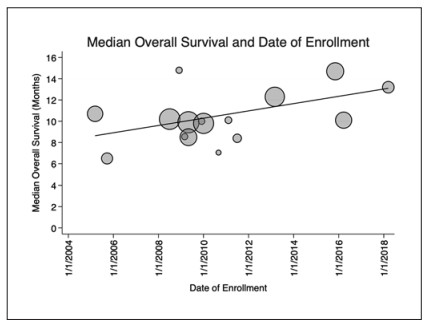
Figure 1.
Median OS and year of enrollment. Scatterplot showing reported median OS in each included trial in months and the first date of enrollment. Since the publication of the first trial to demonstrate an improvement in OS with treatment with sorafenib (SHARP), a significant positive trend in improving OS has emerged in subsequent publications. OS has been improving by 0.34 months per year since the initial study (p= 0.048, R2 = 0.38). Markers are weighted by sample size and trendline represents the weighted linear regression fit.
-
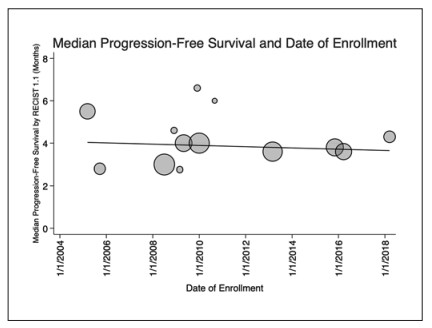
Figure 2.
Median PFS and year of enrollment. Scatterplot showing reported median PFS by RECIST 1.1 and the first date of enrollment. No significant linear trend was noted between PFS by RECIST 1.1 and date of first enrollment (p= 0.69, R2 = 0.021). Markers are weighted by sample size and trendline represents the weighted linear regression line of best fit.
-

Figure 3.
ORRs (by RECIST 1.1) and year of enrollment. Scatterplot showing reported ORRs by RECIST 1.1 and the first date of trial enrollment. ORRs have been significantly increasing over time, at a rate of 0.46% per year (p= 0.003, R2 = 0.50). This trend was driven by results seen on phase Ⅲ trials (p= 0.027, R2 = 0.654), no significant linear trend was identified on a subset analysis of phase Ⅱ trials only. Markers are weighted by sample size and trendline represents the weighted linear regression fit.
-
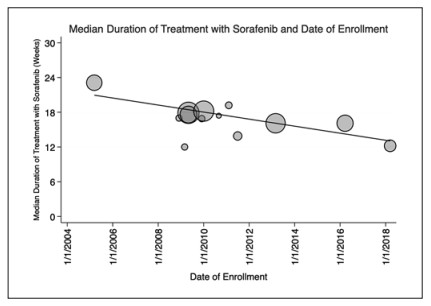
Figure 4.
Median duration of therapy and year of enrollment. Scatterplot showing the median reported durations of therapy with sorafenib and the first date of enrollment. Thirteen studies including 3,021 patients reported duration of therapy. Since the initial study, the median duration of therapy has decreased by 53% (p= 0.0037, R2 = 0.669). Markers are weighted by sample size and trendline represents the weighted linear regression fit.
-
Trial Sorafenib arm, n Date of first enrollment Region Phase Comparison Included outcomes Median OS, months Median PFS, months ORR, % Duration of therapy, weeks Powered OS, months Ref. SHARP 299 10 Mar 2005 Global 3 Placebo OS, PFS, DOT, ORR 10.7 5.5 2 13.1 N/A [3] Asia-Pacific 150 20 Sep 2005 China, South Korea, Taiwan 3 Placebo OS, PFS, ORR 6.5 2.8 3.3 NS N/A [4] SUN1170 544 1 Jul 2008 Global 3 Sunitinib OS, PFS, ORR 10.2 3 6.1 NS 10.7 [16] PRODIGE-10 44 1 Dec 2008 France 2 Sorafanib + gemcitabine and oxaliplatin OS, PFS, DOT, ORR 14.8 4.6 3.9 17 NS [18] B + E 43 1 Mar 2009 USA 2 Bevacizumab + erlotinib OS, PFS, DOT, ORR 8.55 2.76 9 12 8.5 [17] BRISK-FL 578 1 May 2009 Global 3 Brivanib OS, DOT 9.9 NS NS 17.9 10 [14] SEARCH 358 1 May 2009 Global 3 Sorafenib + erlotinib OS, PFS, DOT 8.5 4 6.6 17.6 10.7 [22] SAKK7708 46 1 Dec 2009 Switzerland 2 Sorafenib + everolimus OS, PFS, DOT, ORR 10 6.6 0 16.9 NS [21] Sorafenib versus capecitabine 26 1 Sep 2010 Egypt 2 Capecitabine OS, PFS, DOT, ORR 7.05 6 14.5 17.4 NS [20] Sorafenib-mapatumumab 51 8 Feb 2011 Germany, Poland, Romania, Russia, USA 2 Sorafenib + mapatumumab OS, DOT 10.1 NS NS 19.2 5.5 [19] Sorafenib versus dovitinib 83 1 Jul 2011 Asia-Pacific 2 Dovitinib OS, DOT, ORR 8.4 NS 11 13.9 NS [24] REFLECT 476 1 Mar 2013 Global 3 Lenvatinib OS, PFS, DOT, ORR 12.3 3.6 6.5 16.1 NS [6] LIGHT 521 8 Dec 2014 Global 3 Linifanib OS, PFS, DOT, ORR 9.8 4 6.9 18.2 NS [15] Checkmate-459 371 5 Nov 2015 Global 3 Sorafenib + nivolumab OS, PFS, ORR 14.7 3.8 7 NS 10 [23] Sorafenib versus donafenib 331 21 Mar 2016 China 2 Donafenib OS, PFS, DOT 10 4 9 16.1 NS [25] IMBrave150 165 15 Mar 2018 Global 3 Atezolizumab + bevacizumab OS, PFS, DOT, ORR 13.2 4.3 11.9 12.2 12 [8] DOT, duration of therapy; NS, not stated; N/A, not applicable. Table 1.
Data from included studies
Figures
(4)
Tables
(1)