-
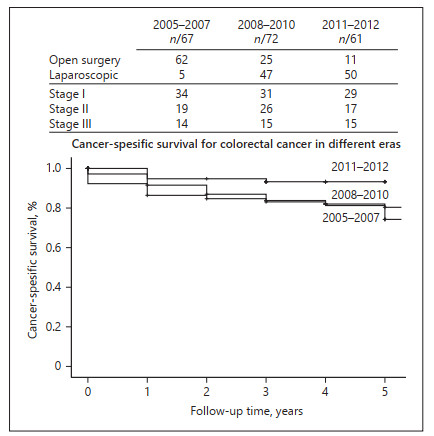
Figure 1.
DSS in different eras. CRC, colorectal cancer; DSS, disease-specific survival.
-
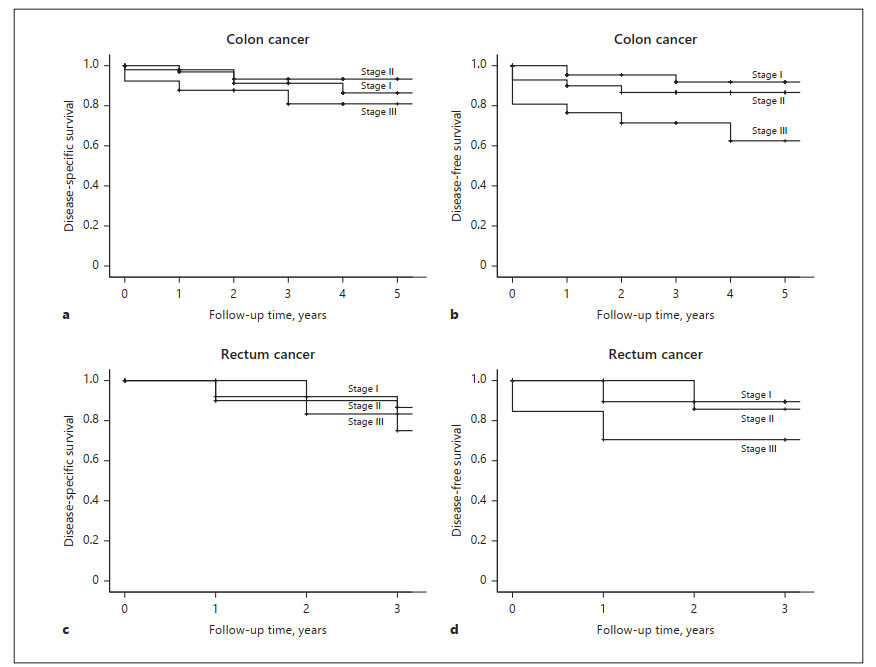
Figure 2.
DSS (a, c) and DFS (b, d) by stages for the laparoscopic colon and rectal cancer. DSS, disease-specific survival; DFS, disease-free survival; RC, rectum cancer.
-
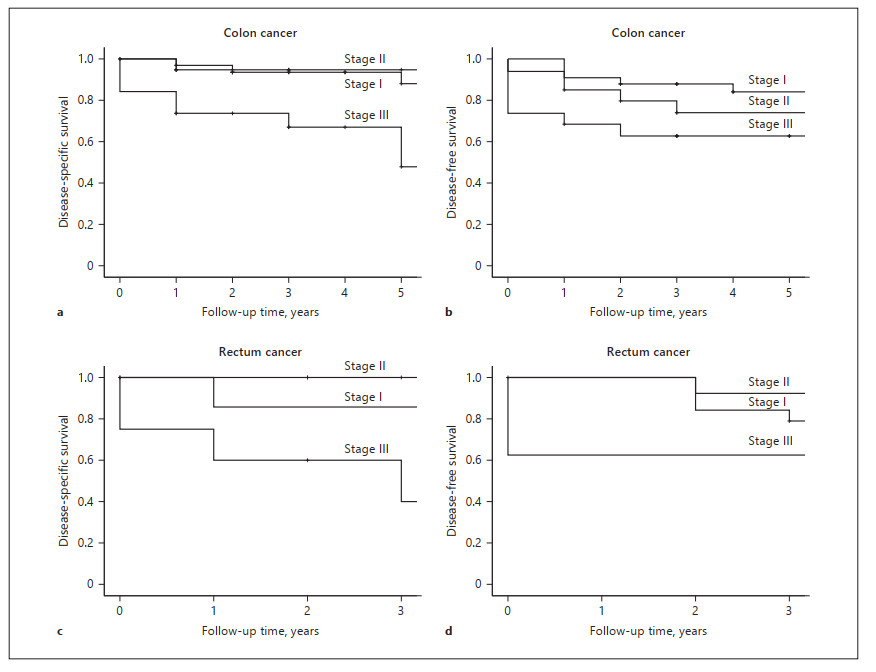
Figure 3.
DSS (a, c) and DFS (b, d) by stages for the open surgery colon and rectal cancer. DSS, disease-specific survival; DFS, disease-free survival; RC, rectum cancer.
-
CC, n/241 % RC, n/108 % Age at diagnosis < 70 years 89 37 57 53 70–80 years 107 44 36 33 > 80 years 45 19 15 14 BMI Median (IQR) Male 26.2 (24–29) 25.6 (24–28) Female 25.7 (23–30) 27.3 (23–30) Sex Male 126 52 66 61 Female 115 48 42 39 ASA Ⅰ 7 2.9 1 0.9 Ⅱ 74 31 40 37 Ⅲ 118 49 48 44 Ⅳ 26 11 11 10 Missing data 16 6.6 8 7.4 ASA, American Society of Anesthesiologists; CC, colon cancer; RC, rectal cancer. Table 1.
Patient characteristics
-
CC patients RC patients n/241 % n/108 % 30-d mortality 2 0.8 3 2.8 90-d mortality 2 0.8 4 3.7 30-d reoperation rate 21 8.7 22 20 Clavien-Dindo classification Ⅲa 18 7.5 20 19 Ⅲb 21 8.4 22 20 Ⅳ 4 1.7 2 1.9 Ⅴ 4 1.7 3 2.8 CC, colon cancer; RC, rectal cancer. Table 2.
Combined laparoscopic and open surgery postoperative complications
-
CC RC n/241 % n/108 % Tumor grade 1 56 25.2 34 31 2 120 54.1 54 50 3 41 18.5 19 18 Missing data 1 1.0 Tumor stage Ⅰ 91 38 42 39 Ⅱ 66 27 23 21 Ⅲ 45 19 20 19 Ⅳ 38 16 23 20 Missing data 1 0.5 1 1.0 T Class 1 21 8.7 8 7.4 2 82 34 35 32 3 73 30 36 33 4 61 25 25 23 Missing data 4 1.7 4 3.7 Lymph nodes 0 170 71 69 64 1 53 22 26 24 2 16 6.6 12 11 Missing data 2 0.8 1 1.0 Number of harvested lymph nodes (mean) 11 12 Distal metastases Negative 200 83 86 80 Positive 40 17 22 19 Missing data 1 0.4 1 1.0 CC, colon cancer; RC, rectal cancer. Table 3.
Tumor characteristics
-
Laparoscopic Open surgery CC Patients, n 5-year DSS, % HR 95% CI Patients, n 5-year DSS, % HR 95% CI Stage Ⅰ 55 83.3 1.0 Reference 36 91.8 1 Reference Stage Ⅱ 43 89.8 0.8 0.2–3.4 23 90.7 1.7 0.2–12.3 Stage Ⅲ 29 76.6 2.0 0.6–7.0 16 75.0 8.4 1.7–41.8 5-year DFS, % 5-year DFS, % Stage Ⅰ 55 89.9 1 Reference 36 88.1 1 Reference Stage Ⅱ 43 82.9 2.6 0.7–8.7 22 80.3 2.6 0.7–9.3 Stage Ⅲ 29 60.7 5.3 1.6–17.5 16 62.5 4.6 1.3–16.4 Laparoscopic Open surgery RC Patients, n 3-year DSS, % HR 95% CI Patients, n 3-year DSS, % HR 95% CI Stage Ⅰ 28 91.1 1 Reference 14 90.0 1 Reference Stage Ⅱ 11 100 0.0 0.0 12 83.3 5.5 0.6–47.2 Stage Ⅲ 14 85.7 1.1 0.1–10.7 6 60.0 22.7 2.1–239.3 3-year DFS, % 3-year DFS, % Stage Ⅰ 28 84.6 1 Reference 14 72.5 1 Reference Stage Ⅱ 11 100 0.0 0.1 12 90.1 0.8 0.2–3.6 Stage Ⅲ 14 77.1 2.2 0.6–8.0 6 80.0 0.7 0.1–6.2 No statistical difference between laparoscopic and open surgery groups within stages; data not shown. CC, colon cancer; RC, rectal cancer; DSS, disease-specific survival; DFS, disease-free survival; CI, confidence interval; HR, hazard ratio. Table 4.
Long-term oncological results from laparoscopic and open surgery for colon and rectal cancer
Figures
(3)
Tables
(4)