-
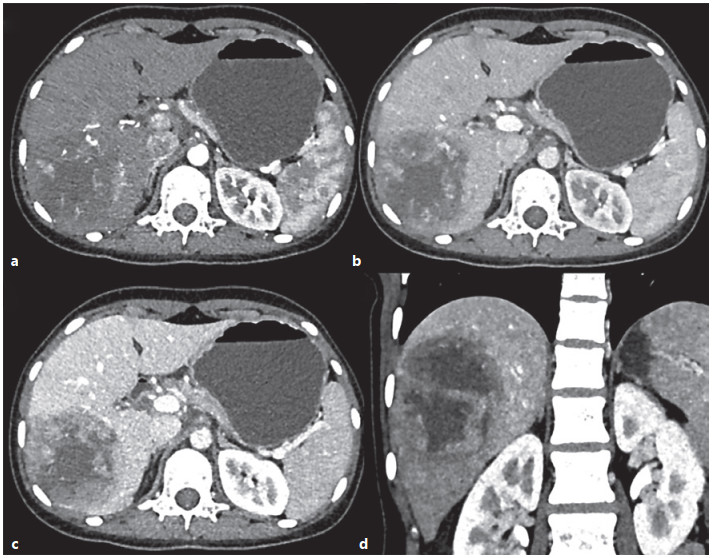
Figure 1.
CASE 1: Triple-phase contrast-enhanced CT axial (a–c) and coronal (d) images: in arterial phase, mass in right lobe shows peripheral arterial enhancement (a), portal venous (b), hepatic venous phases – progressive enhancement is seen in the periphery of the tumor with cystic nonenhancing areas in the center of the tumor (c, d). The rest of the liver shows normal enhancement.
-
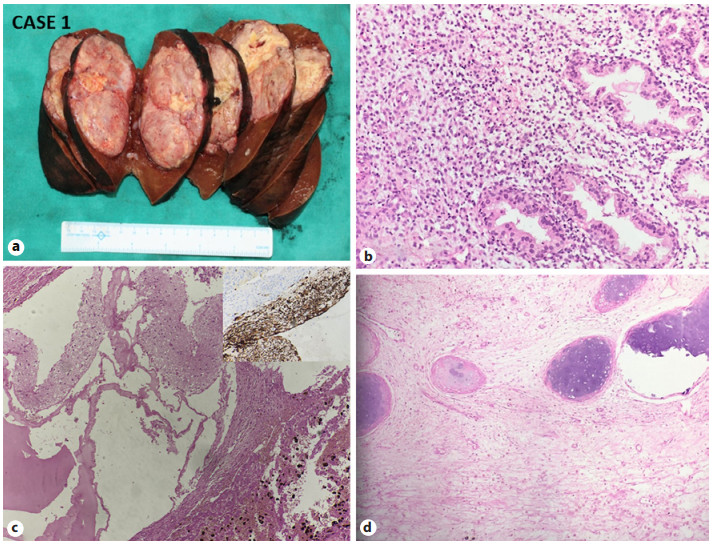
Figure 2.
CASE 1: Mixed HB with the teratoid feature. a Gross: well-defined tumor nodule, abutting the capsular surface (H and E, ×200). b Microphotograph shows an epithelial component of HB. c Microphotograph shows Glial component and melanin pigment (H and E, ×200) (right upper inset showing GFAP immunopositivity). d Microphotograph shows osteoid and cartilage formation H and E, ×200). HB, hepatoblastoma.
-
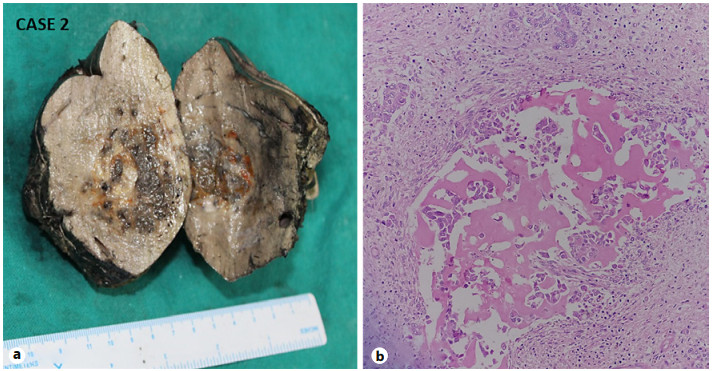
Figure 3.
CASE 2: Mixed hepatoblastoma. a Gross: a tumor shows a variegated cut surface. b Microphotograph shows an epithelial component admixed with the mesenchymal component (H and E, ×200).
-
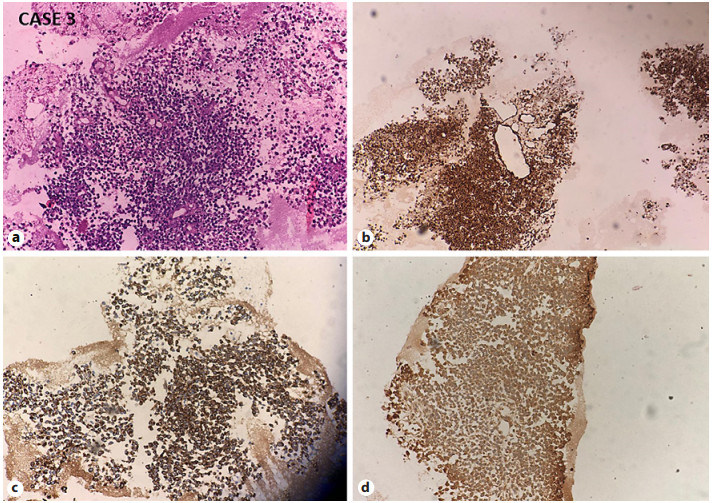
Figure 4.
CASE 3: Small-cell undifferentiated HB. a Microphotograph shows sheets and perivascular arrangement of dyscohesive small blue cells with scant cytoplasm (H and E, ×200). Tumor cells are immunoreactive for cytokeratin (b), vimentin (c), and focally for alpha-fetoprotein (d). HB, hepatoblastoma.
Figures
(4)
Tables
(0)