-
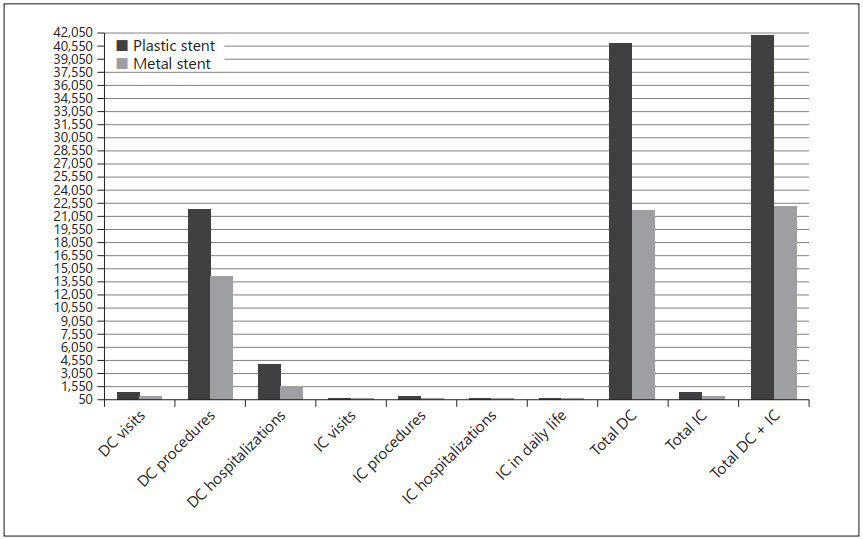
Figure 1.
Per patient costs over 12 months. ERCP, endoscopic retrograde cholangiopancreatography; DC, direct costs; IC, indirect costs.
-
Cost item Cost value, EGP Visit (gastroenterology) 150 Consultation (gastroenterology) 300 Total cost for an ERCP procedure with plastic stent application 7, 000 Total cost for an ERCP procedure with metal stent application 14, 000 Hospitalization for cholangitis 4, 224 Average per diem cost for hospitalizations due to biliary re-obstruction 350 Cost of time lost per day 75 Values were rounded to the nearest integer in Egyptian pounds. ERCP, endoscopic retrograde cholangiopancreatography. Table 1.
Unit costs
-
Plastic stent group (n=45) Metal stent group (n=45) p value Total visits to gastroenterology 6.56(1.0) 2.77(0.4) 0.0001 Total visits to consultants 7.2(2.1) 3.1(0.81) 0.0001 Total ERCP procedures 3.6(1.1) 1.56(0.32) 0.0001 Total days of hospitalization 5.7(1.8) 1.65(0.25) 0.0001 Direct costs, EGP Visits to gastroenterology 882.2(167.3) 334.5(95.6) 0.0001 Visits to consultants 1,000.1(241.6) 487.3(75.9) 0.0001 All ERCP procedures 21,880(823.4) 14,189(634.2) 0.0001 Lab investigations 3,378.2(329.5) 1,320.4(137.6) 0.0001 Imaging 1,701.4(401.5) 653.2(217.5) 0.0001 Medications 5,810.2(1,080.7) 2,360.3(732.6) 0.0001 Follow-up 2,178.24(530.5) 845.12(198.4) 0.0001 Hospitalization 4,027.5(1,165.7) 1,612.8(623.8) 0.0001 Indirect costs, EGP 1,198.3(287.3) 600.1(87.4) 0.0001 Absence from work 1,198.3 (287.3) 600.1 (87.4) 0.0001 Data are presented as the mean (SD). Values were rounded to the nearest 2 decimals. The Student t test was used to assess significant differences in the cost of plastic and metal stents. Differences in both formulas are because each patient differed in number of hospitalizations. Therefore, to calculate the cost of hospitalization per patient we added the number of each patient's hospitalizations then divided it by the total number of patients who were hospitalized, then multiplied by the mean cost of each hospitalization. ERCP, endoscopic retrograde cholangiopancreatography. Table 2.
Medical resource utilization per patient
-
Patients with plastic stents Patients with plastic stents average cost per patient, EGP proportion of total direct/ indirect costs, % lower bound, EGP upper bound, EGP average cost per patient, EGP proportion of total direct/ indirect costs, % lower bound, EGP upper bound, EGP Directcosts Gastroenterology visits 882.2 2.16 240 880 334.5 1.53 110 330 Consultant visits 1,000.10 2.45 300 875 487.3 2.24 135 450 Investigations 3,378.20 8.27 1,000 3,000 1,320.40 6.06 450 1,200 Imaging 1,701.40 4.16 520 1,550 653.2 2.99 220 600 ERCP procedure 21,880 53.55 7,500 21,000 14,189 65.08 4,750 14,000 Medications 5,810.20 14.22 1,900 5,750 2,360.30 10.83 780 2,240 Hospitalizations 4,027.50 9.86 1,230 3,890 1,612.80 7.39 575 1,580 Follow-up 2,178.24 5.33 720 2,100 845.12 3.88 284 788 Total direct costs 40,857.84 100 13,410 39,045 21,802.62 100 7,304 21,188 Indirect costs Time spent on gastroenterology visits 260 29 120 350 95 21 50 150 Time spent on ERCP procedures 284 32 130 330 140 31 60 230 Time spent at hospital 124 14 50 180 61 13 30 100 Time spent away from ADL 220 25 130 300 158 35 90 250 Total indirect costs 888 100 430 1,160 454 100 230 730 Total direct and indirect costs, EGP 41,745.84 13,840 40,205 22,256.62 7,534 21,918 Values were rounded to the nearest integer. Low and high values are based on the lower (25%) and upper (75%) quartiles. ADL, activities of daily living; ERCP, endoscopic retrograde cholangiopancreatography. Table 3.
Total direct and indirect costs
-
Plastic stent group (n = 45) Metal stent group (n = 45) p value Total time spent for visits in gastroenterology 28.78 (8.72) 13.82 (4.6) 0.0001 Total time spent to undergo ERCP 12.29 (4.1) 3.08 (1.0) 0.0001 Total time spent at hospital 42.89 (9.72) 13.23 (4.8) 0.0001 Total of additional time spent away from ADL1 16.37 (5.3) 5.42 (1.6) 0.0001 Data are presented as the mean number of days (SD). Values were rounded to the nearest 2 decimals. The Mann-Whitney test was used to assess significant differences in the cost of plastic and metal stents. ADL, activities of daily living; ERCP, endoscopic retrograde cholangiopancreatography.
1 Differences in the sum of all the days spent away from ADL for all patients/number of patients in both formulas arise because patients had variable numbers of events causing days away from ADL.Table 4.
Time lost in days per patient
Figures
(1)
Tables
(4)