-
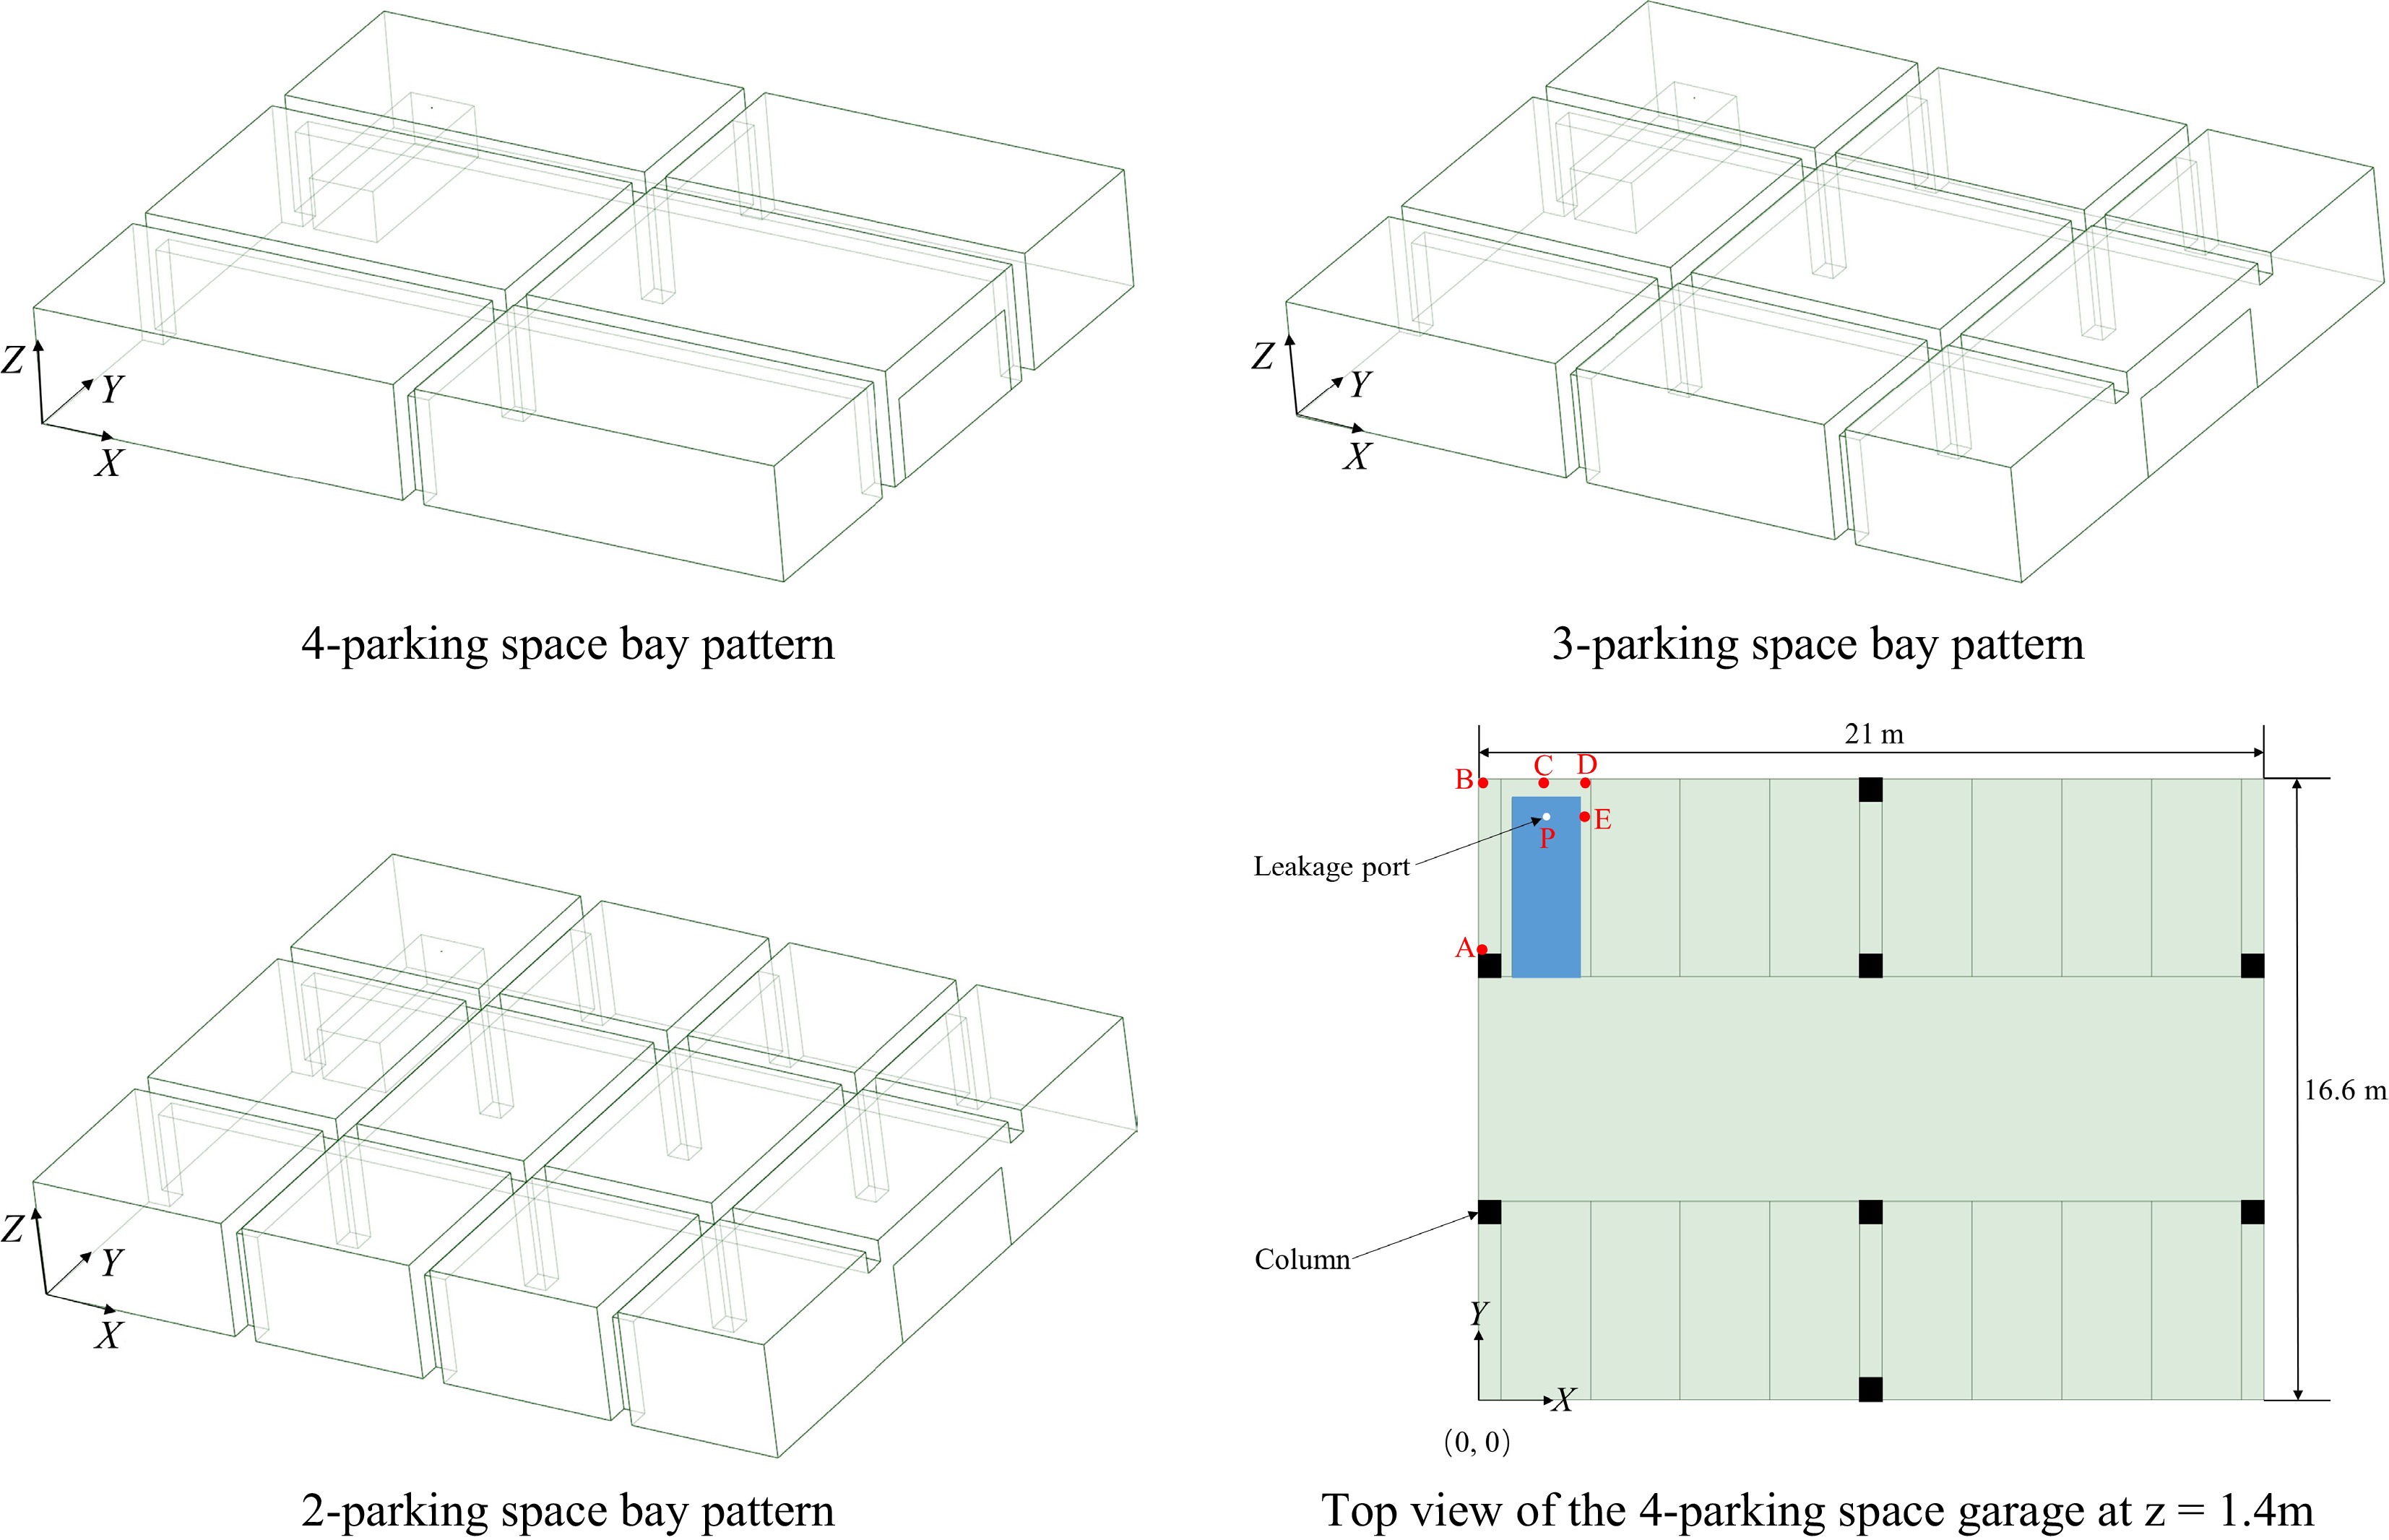
Figure 1.
Geometric model of the garage with different parking space modes and the base view of the garage with a 4-parking space mode.
-

Figure 2.
Modelling of underground garage with different numbers of vents.
-
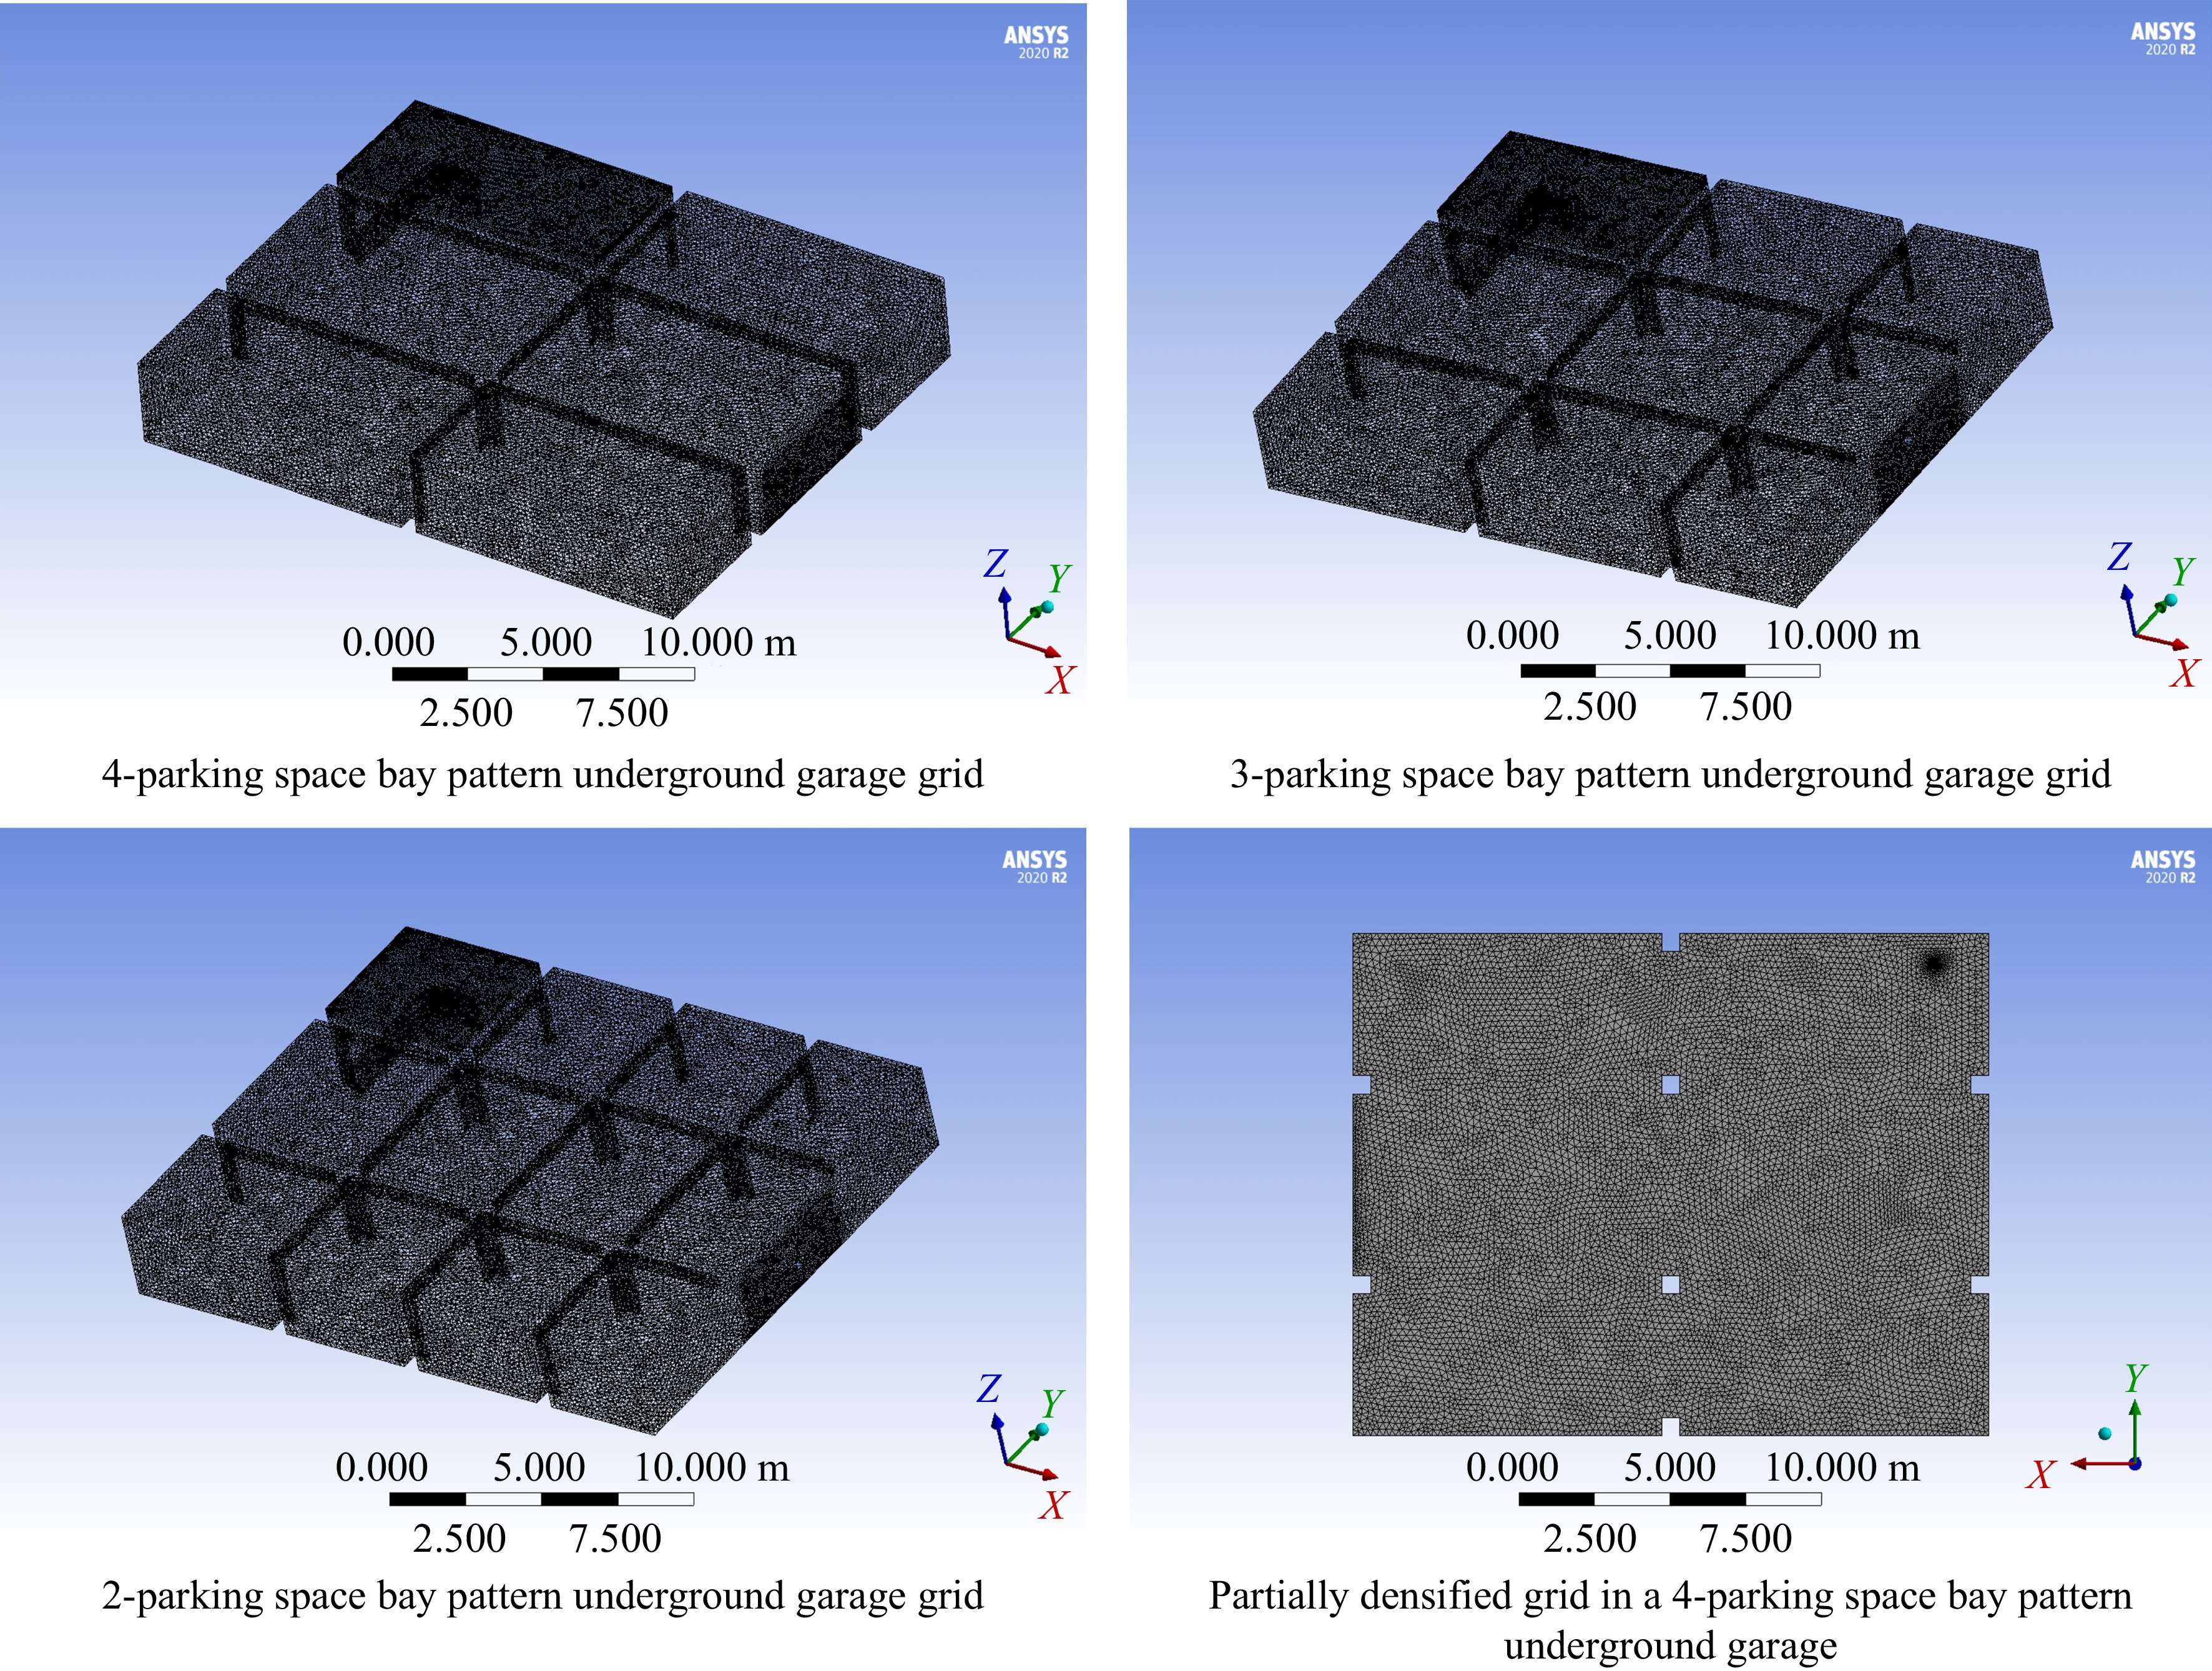
Figure 3.
Schematic diagram of grid division and local encrypted grid for underground garage with different parking space modes.
-

Figure 4.
Experimental scenario of hydrogen leakage diffusion.
-

Figure 5.
Geometric model and meshing diagram of the garage.
-
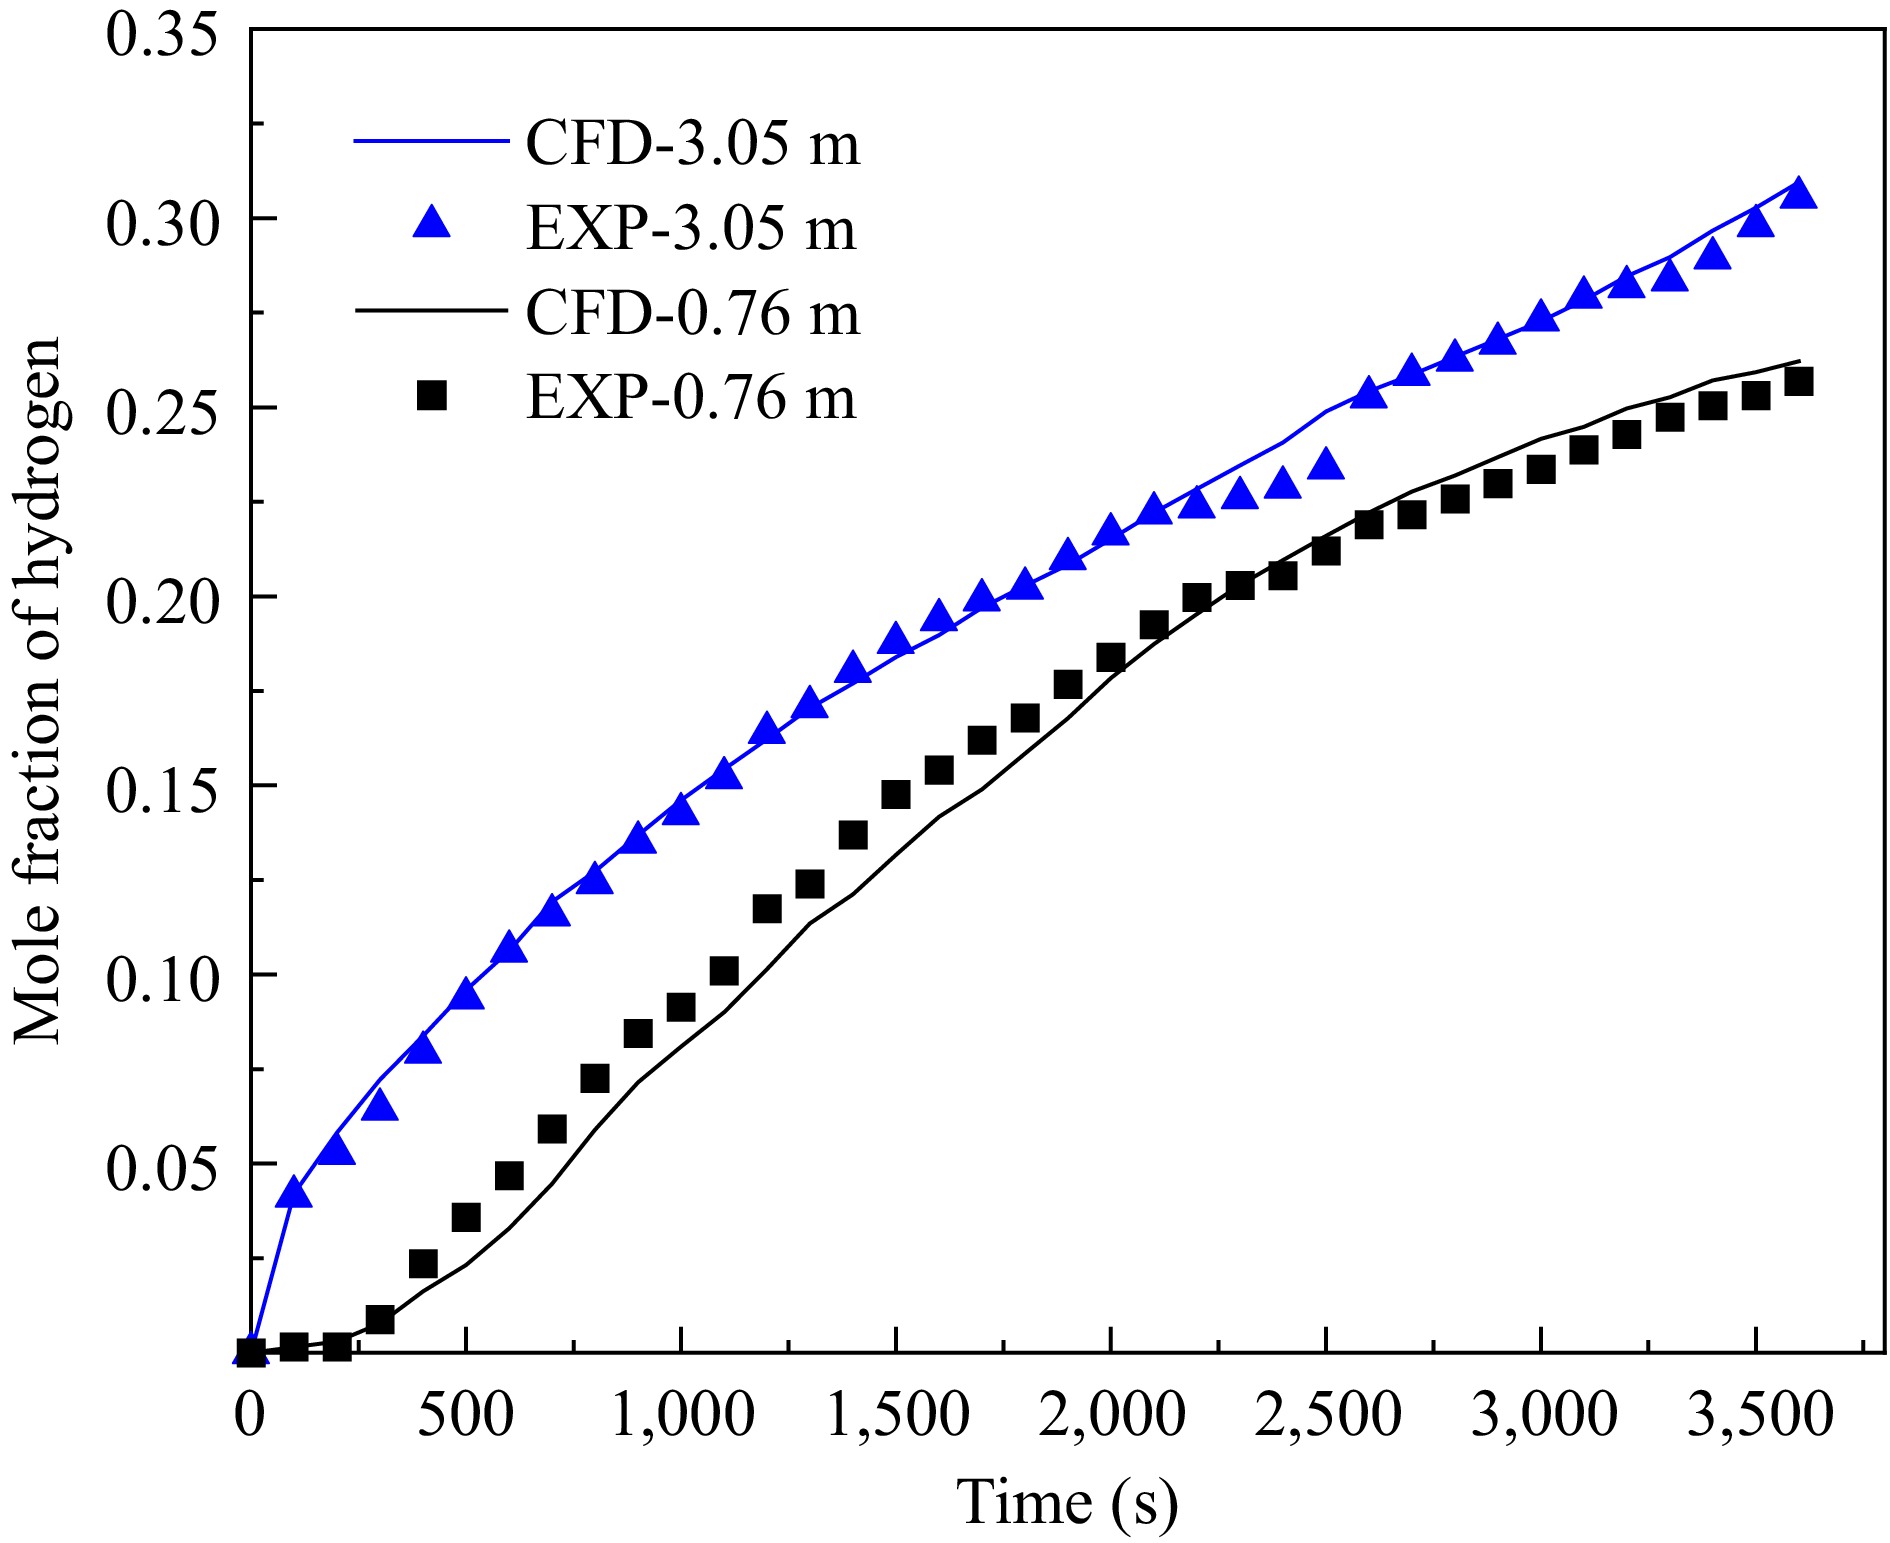
Figure 6.
Comparison results between experimental data and simulation data.
-
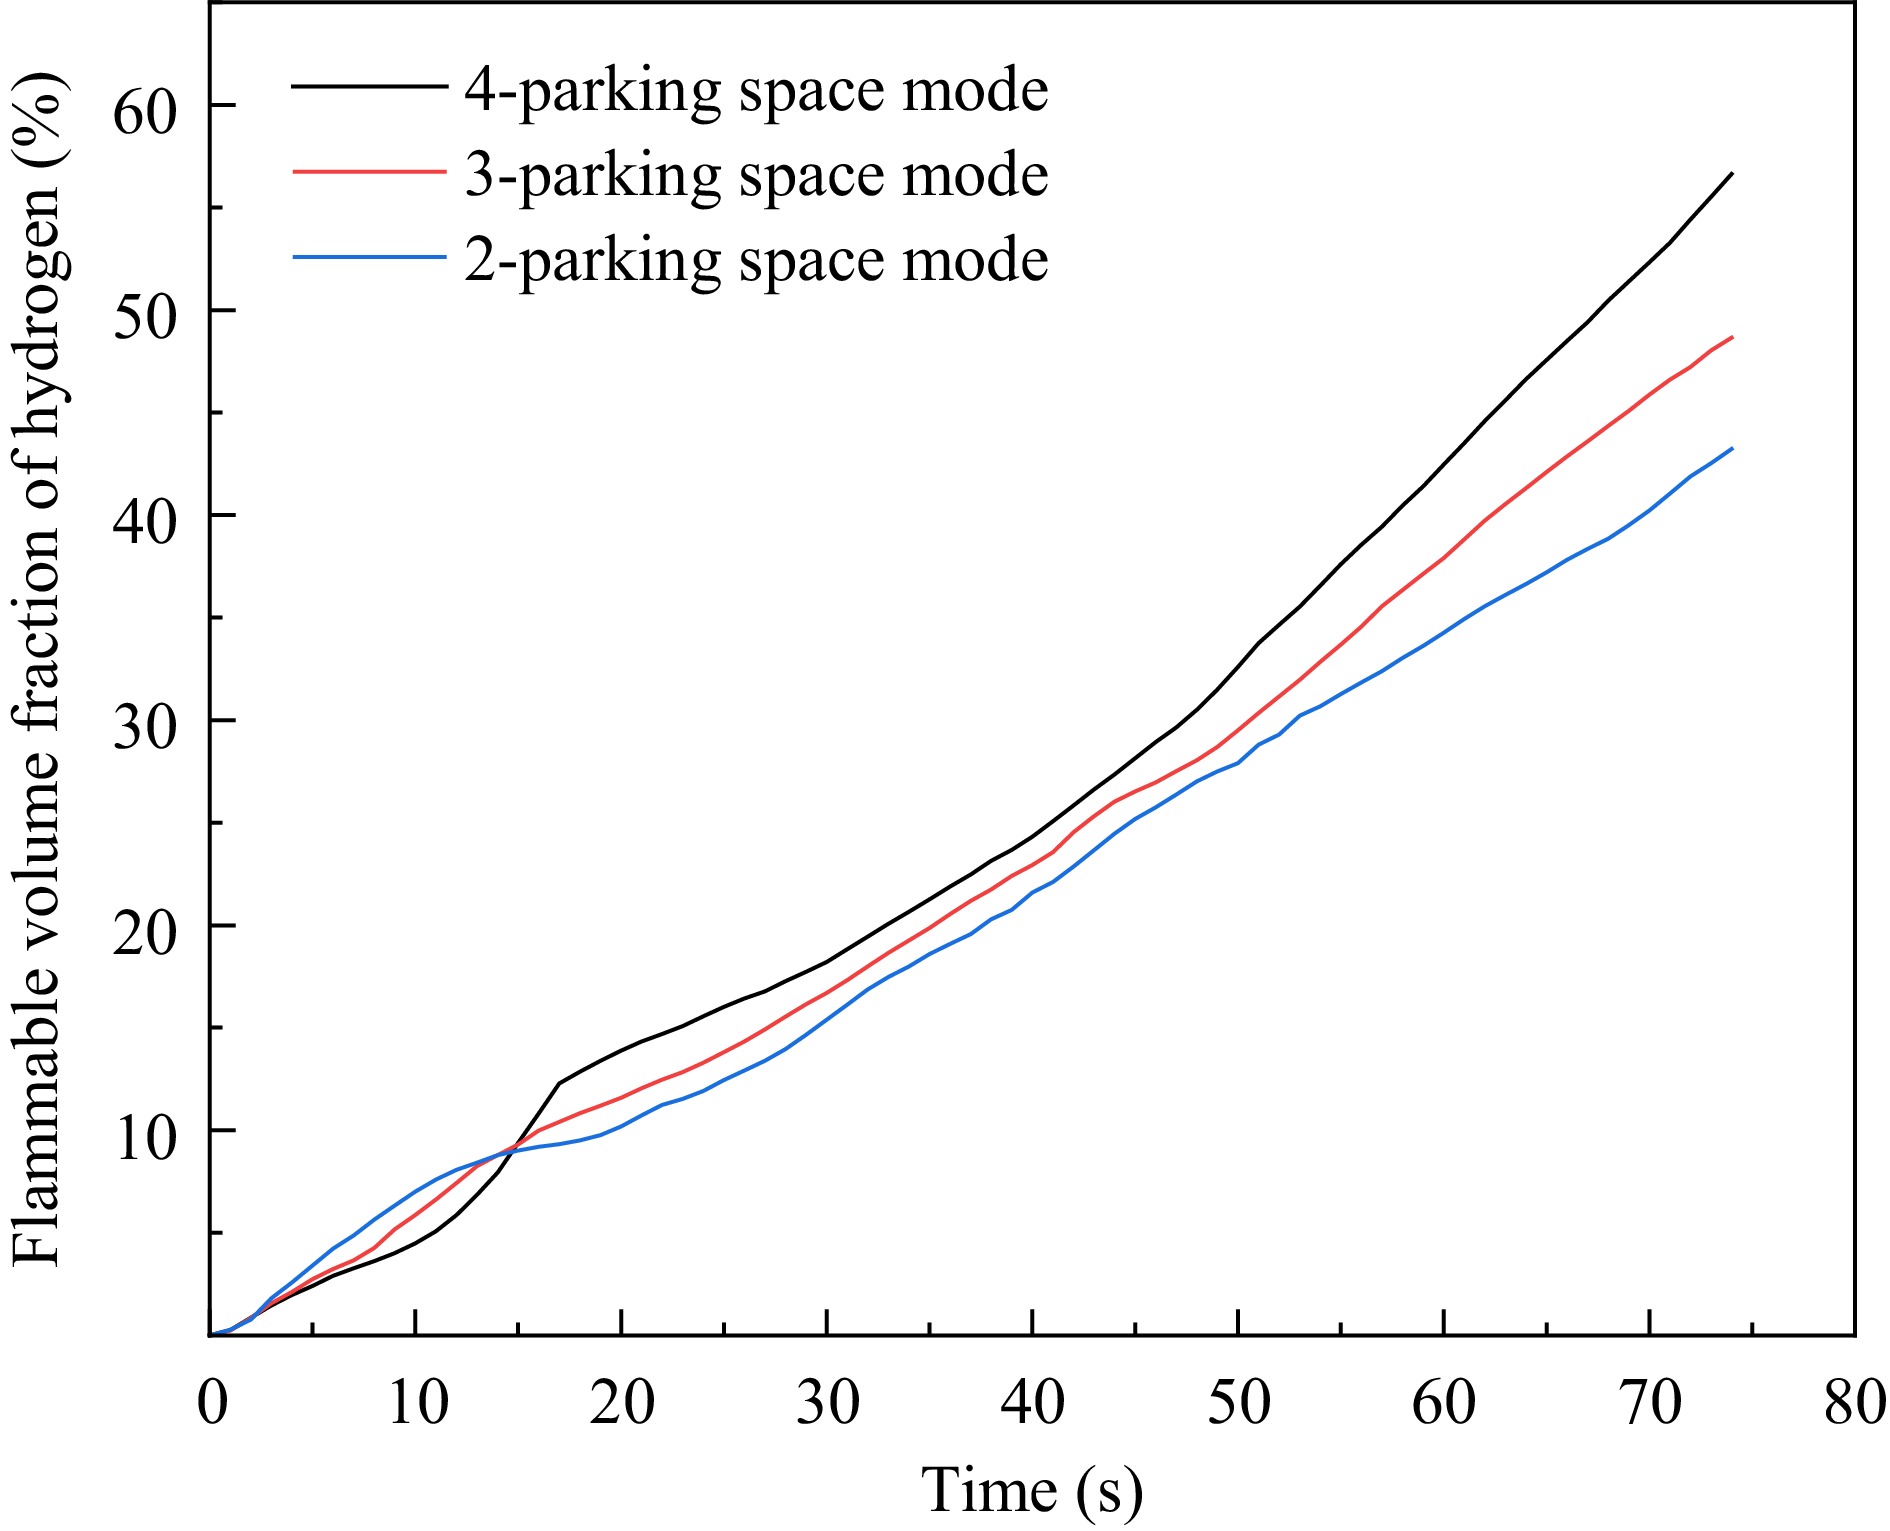
Figure 7.
Volume fraction of hydrogen flammable region in the garage for different parking space modes.
-
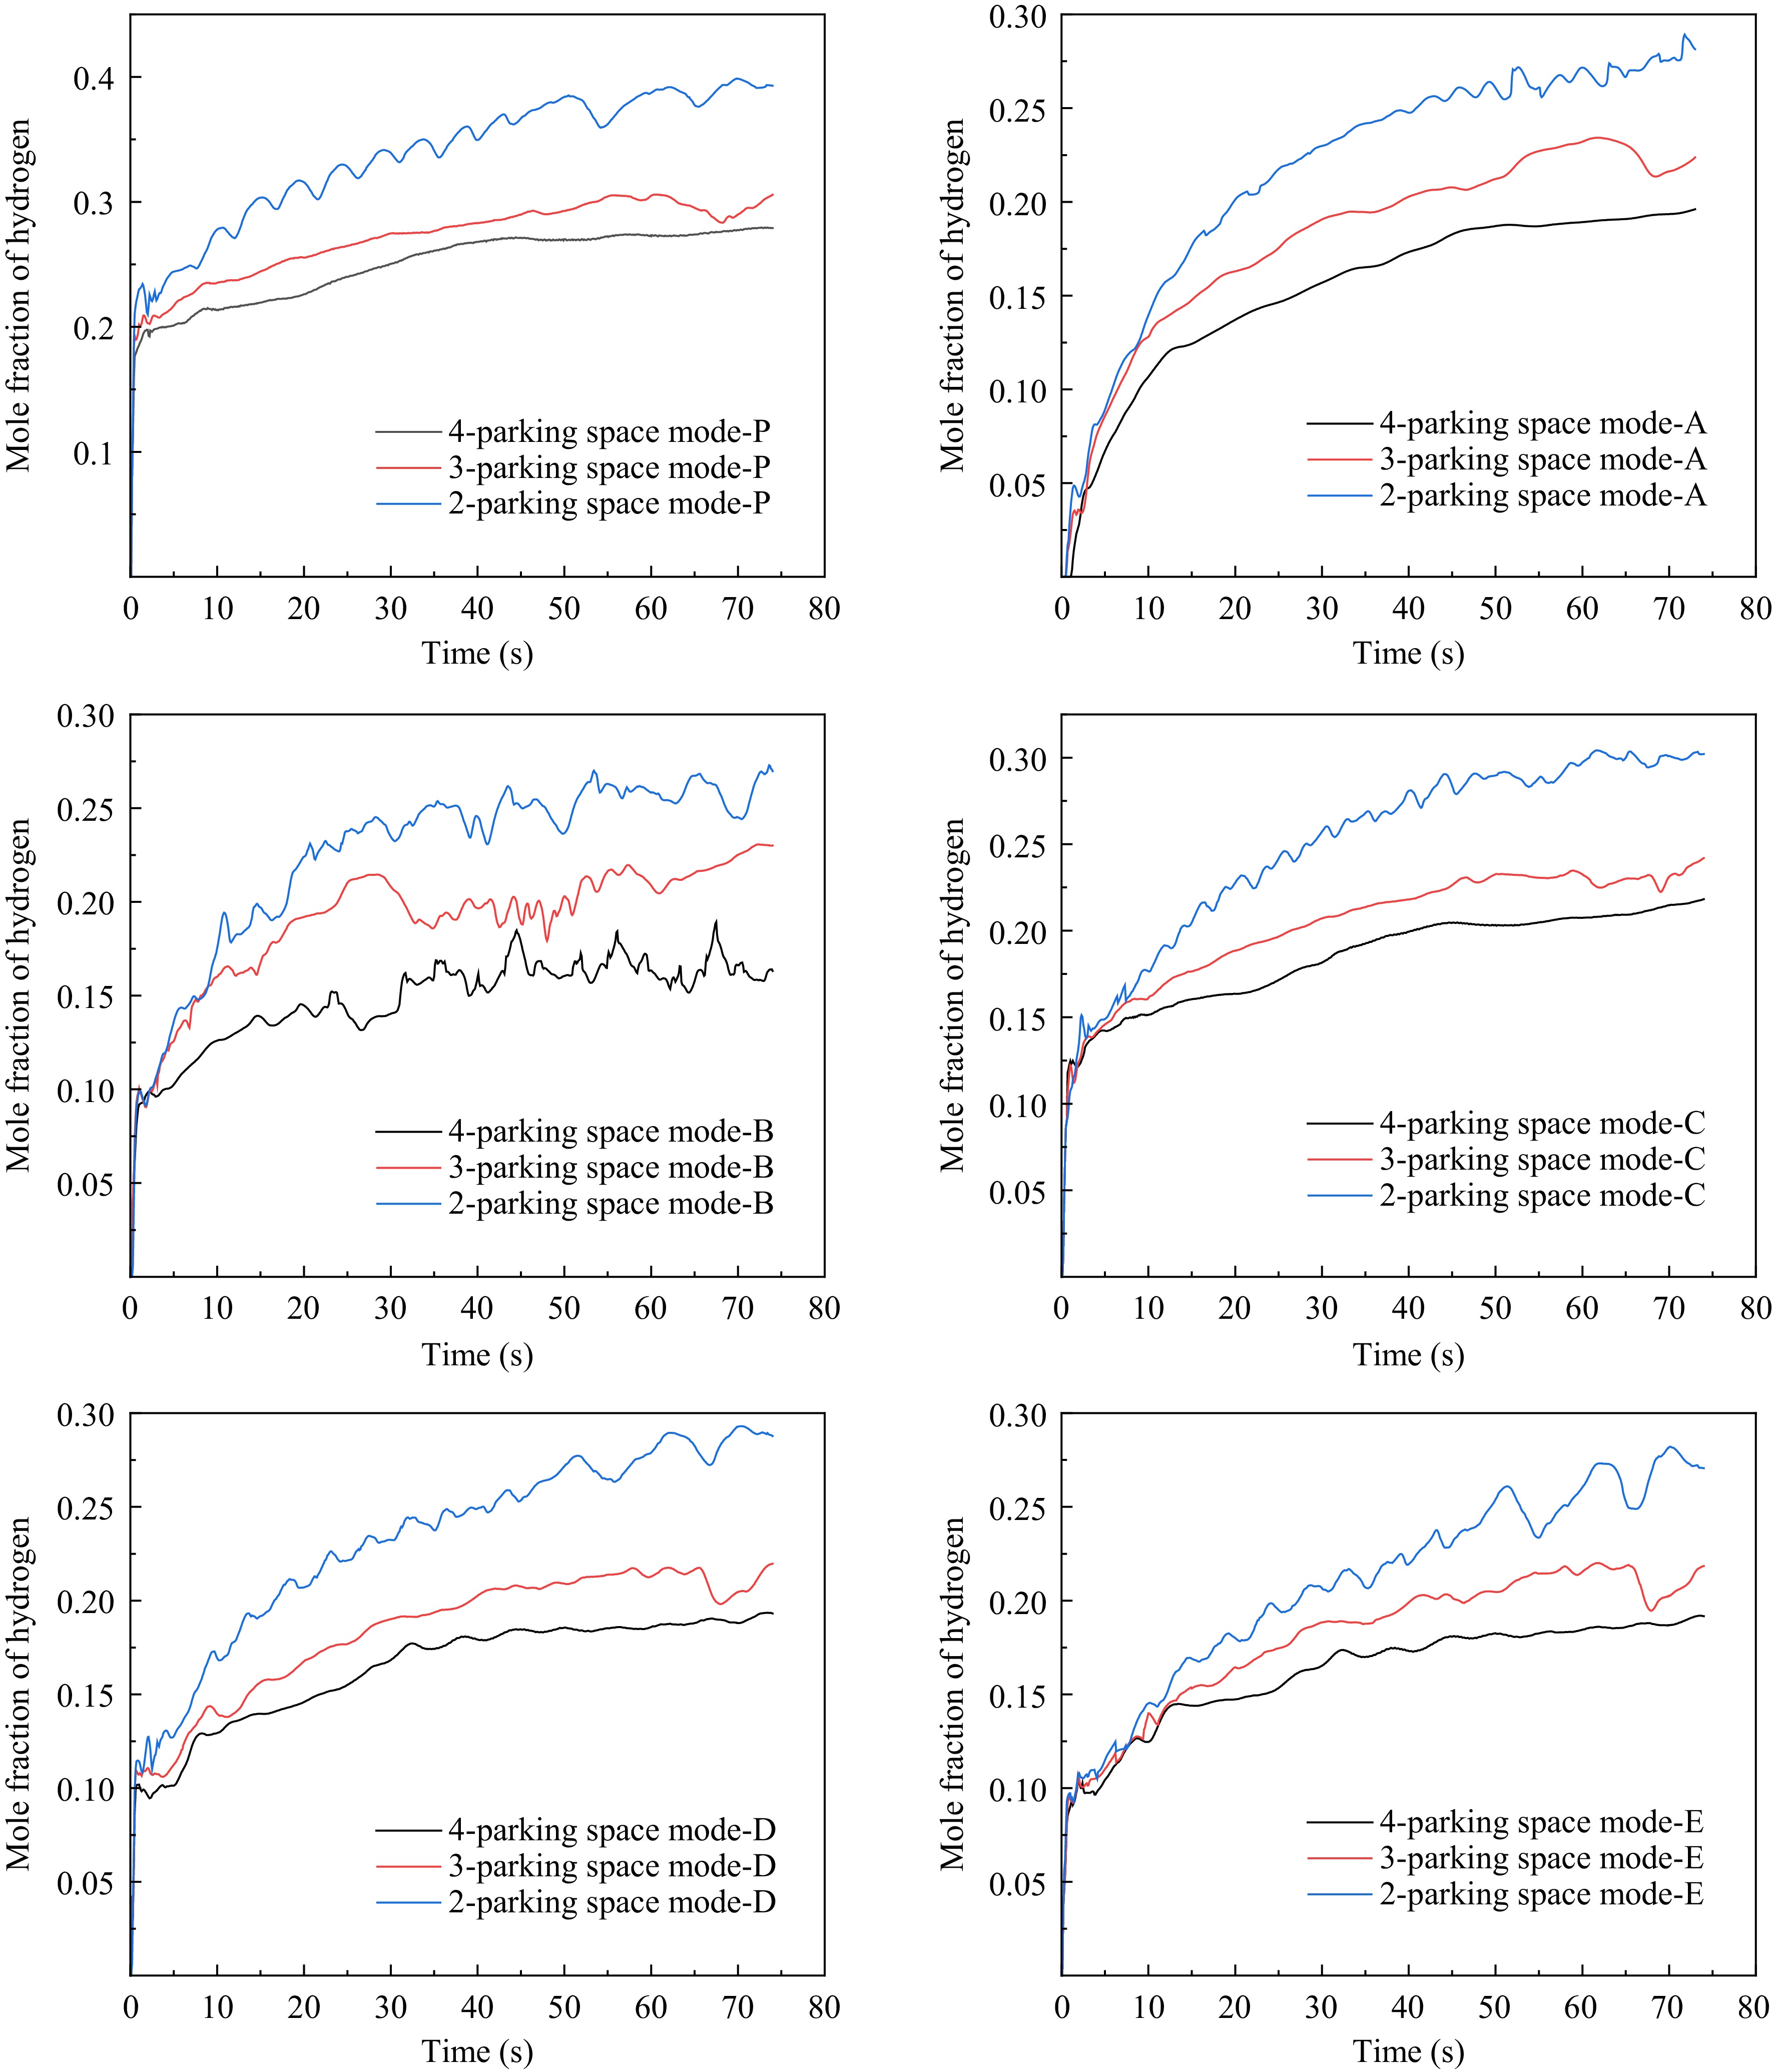
Figure 8.
Variation of hydrogen molar fraction at each monitoring point under different parking space modes.
-
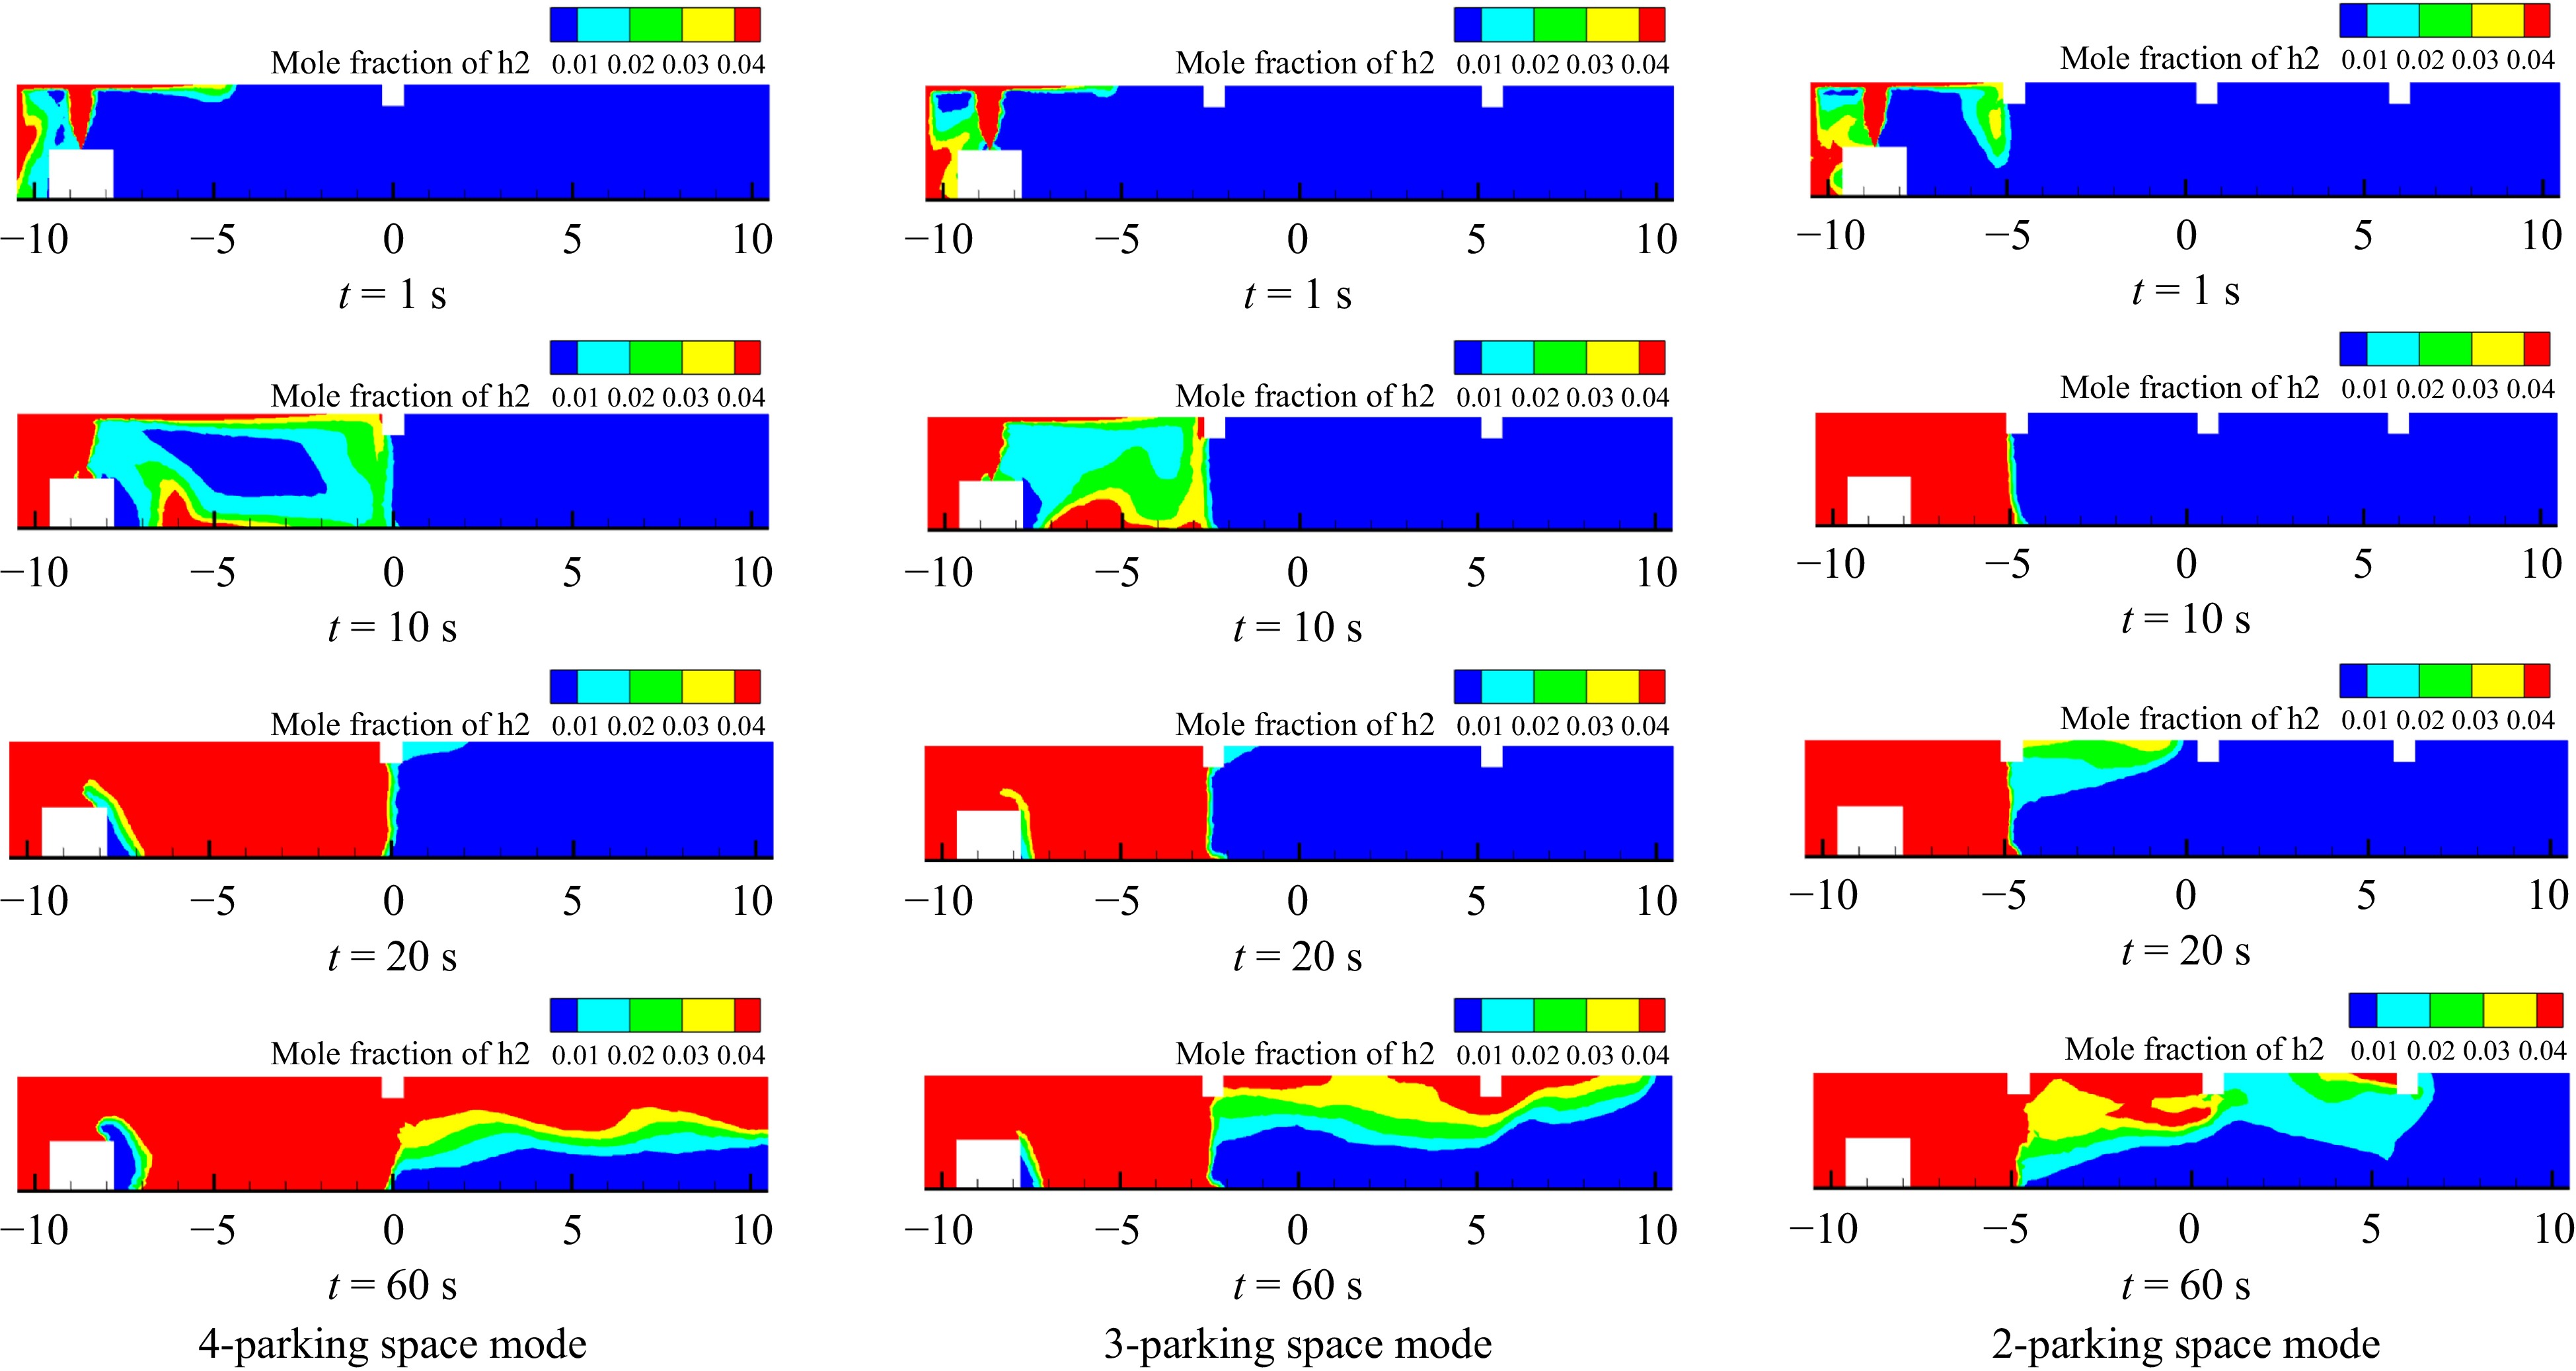
Figure 9.
Cloud plot of hydrogen concentration distribution in the garage at y = 7.3 m for different parking space modes.
-
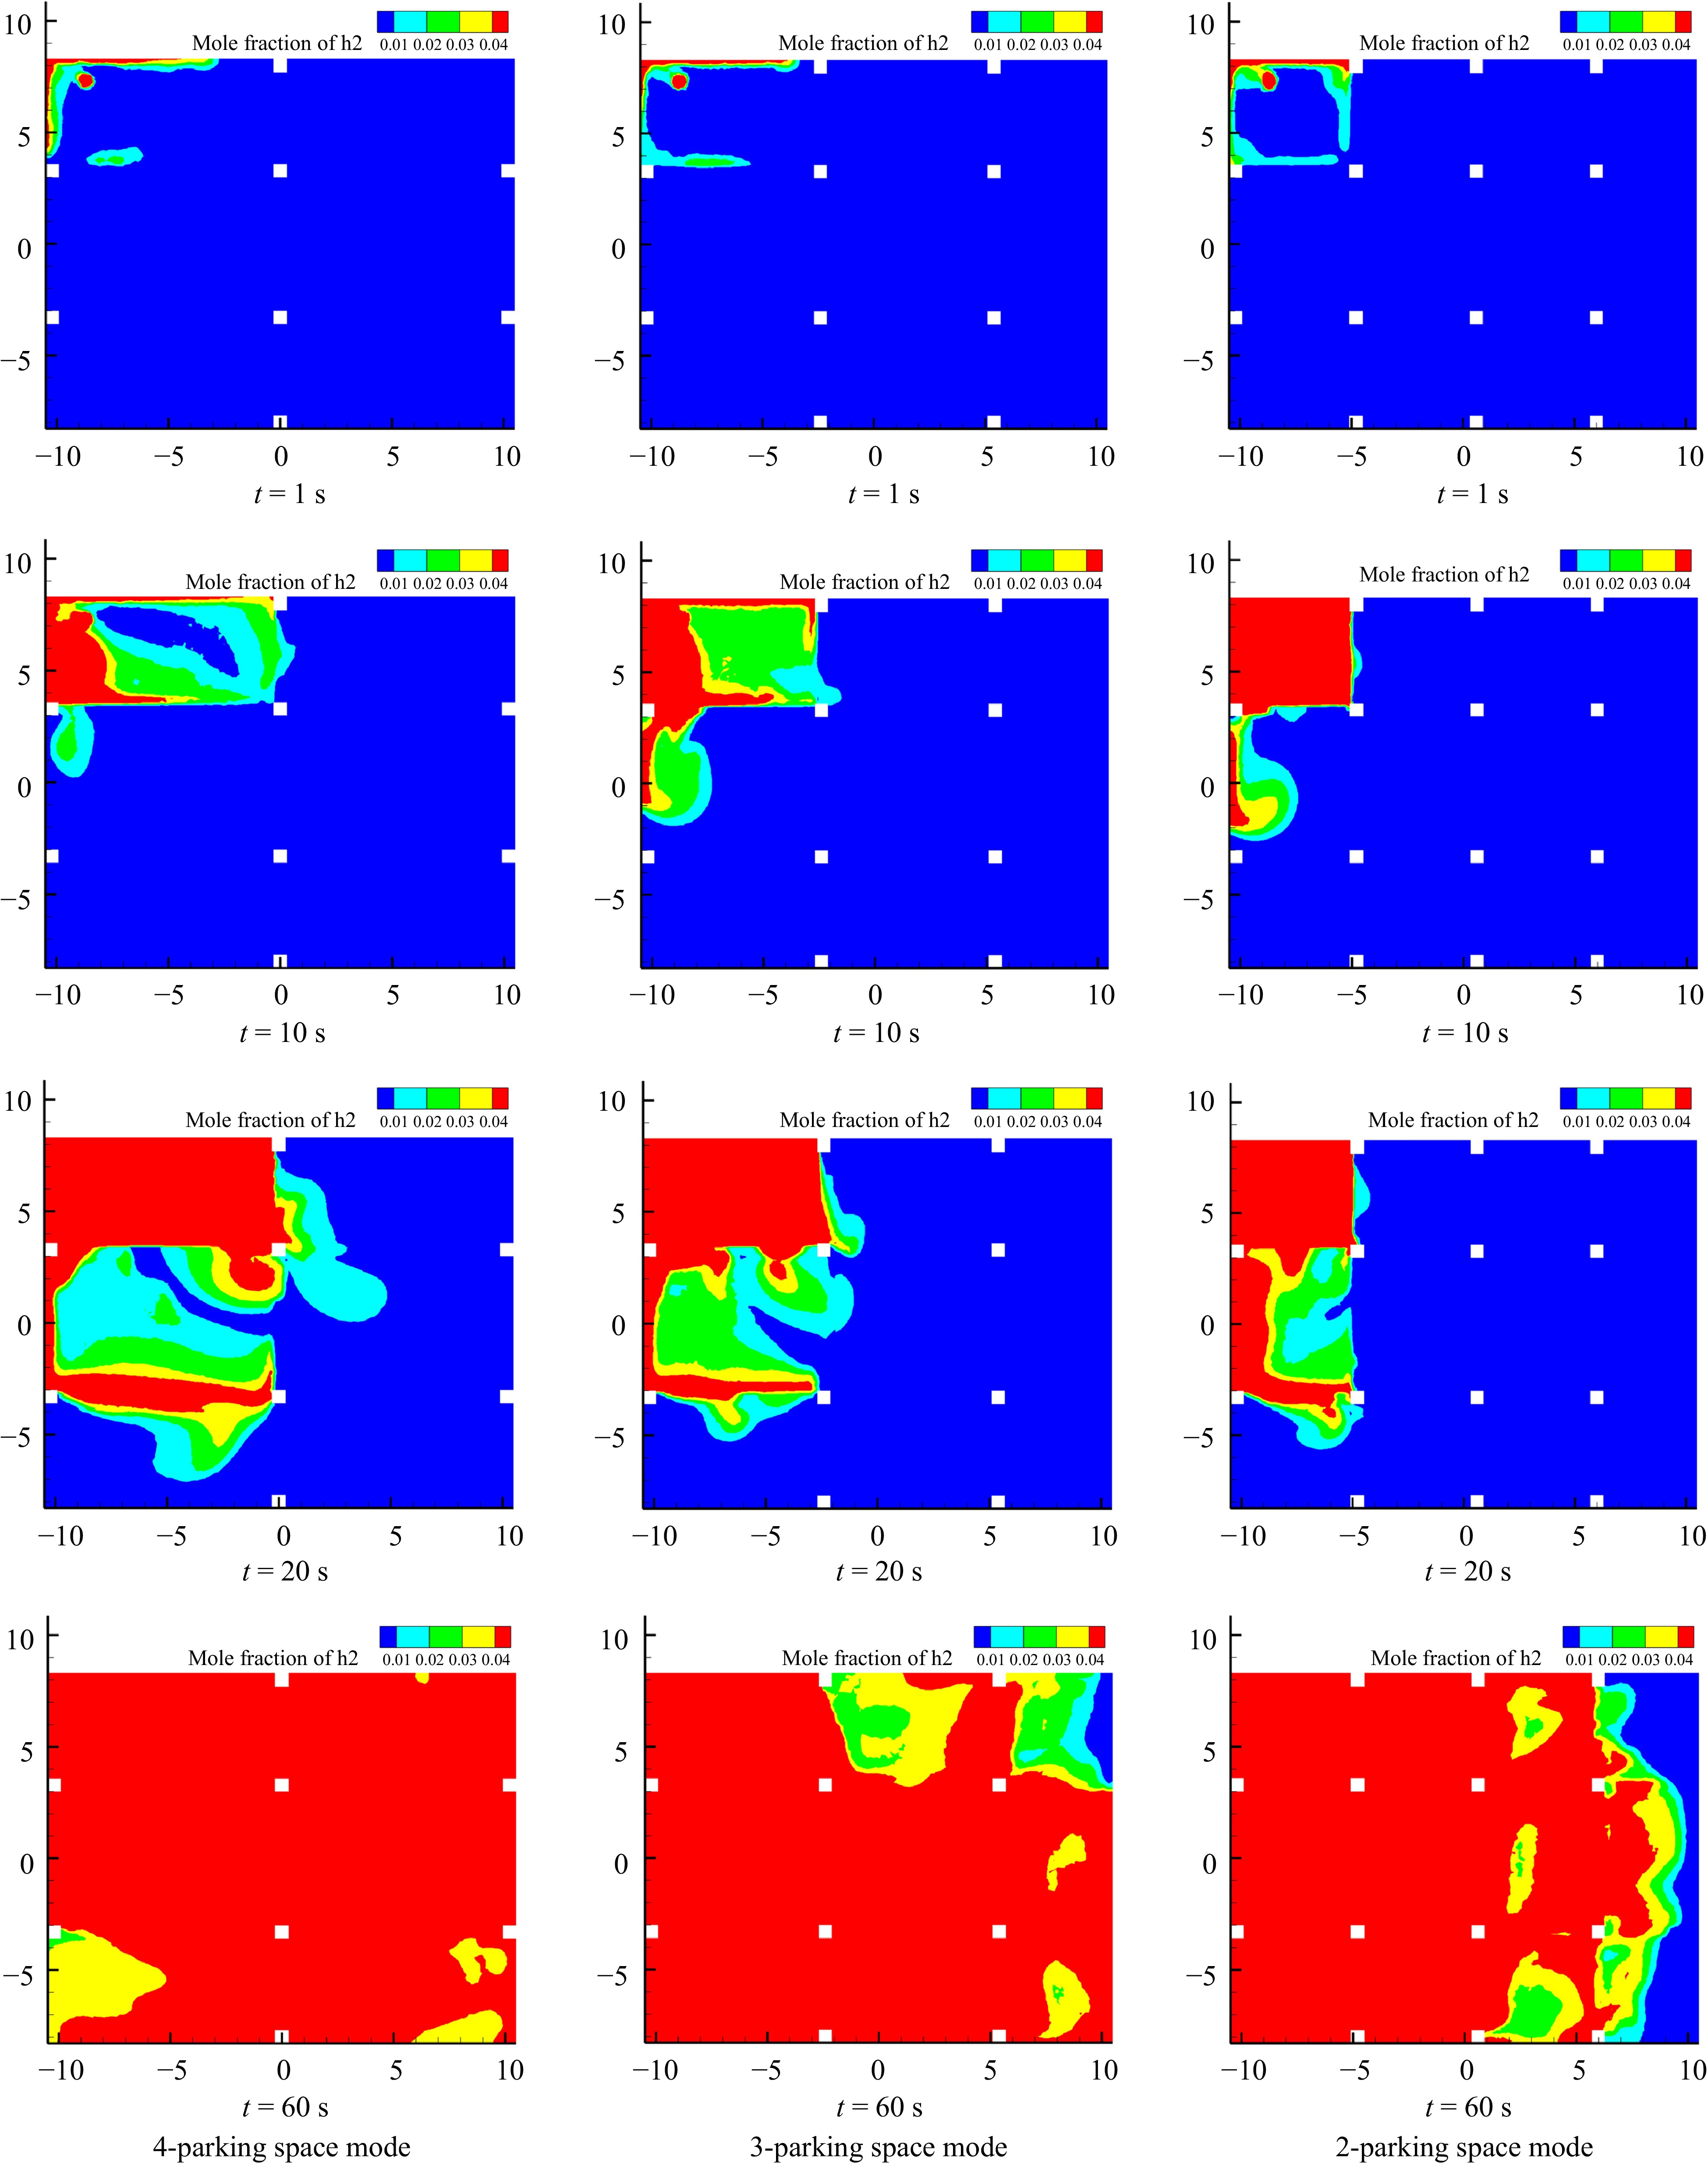
Figure 10.
Cloud plot of hydrogen concentration distribution in the garage at z = 2.6 m for different parking space modes.
-
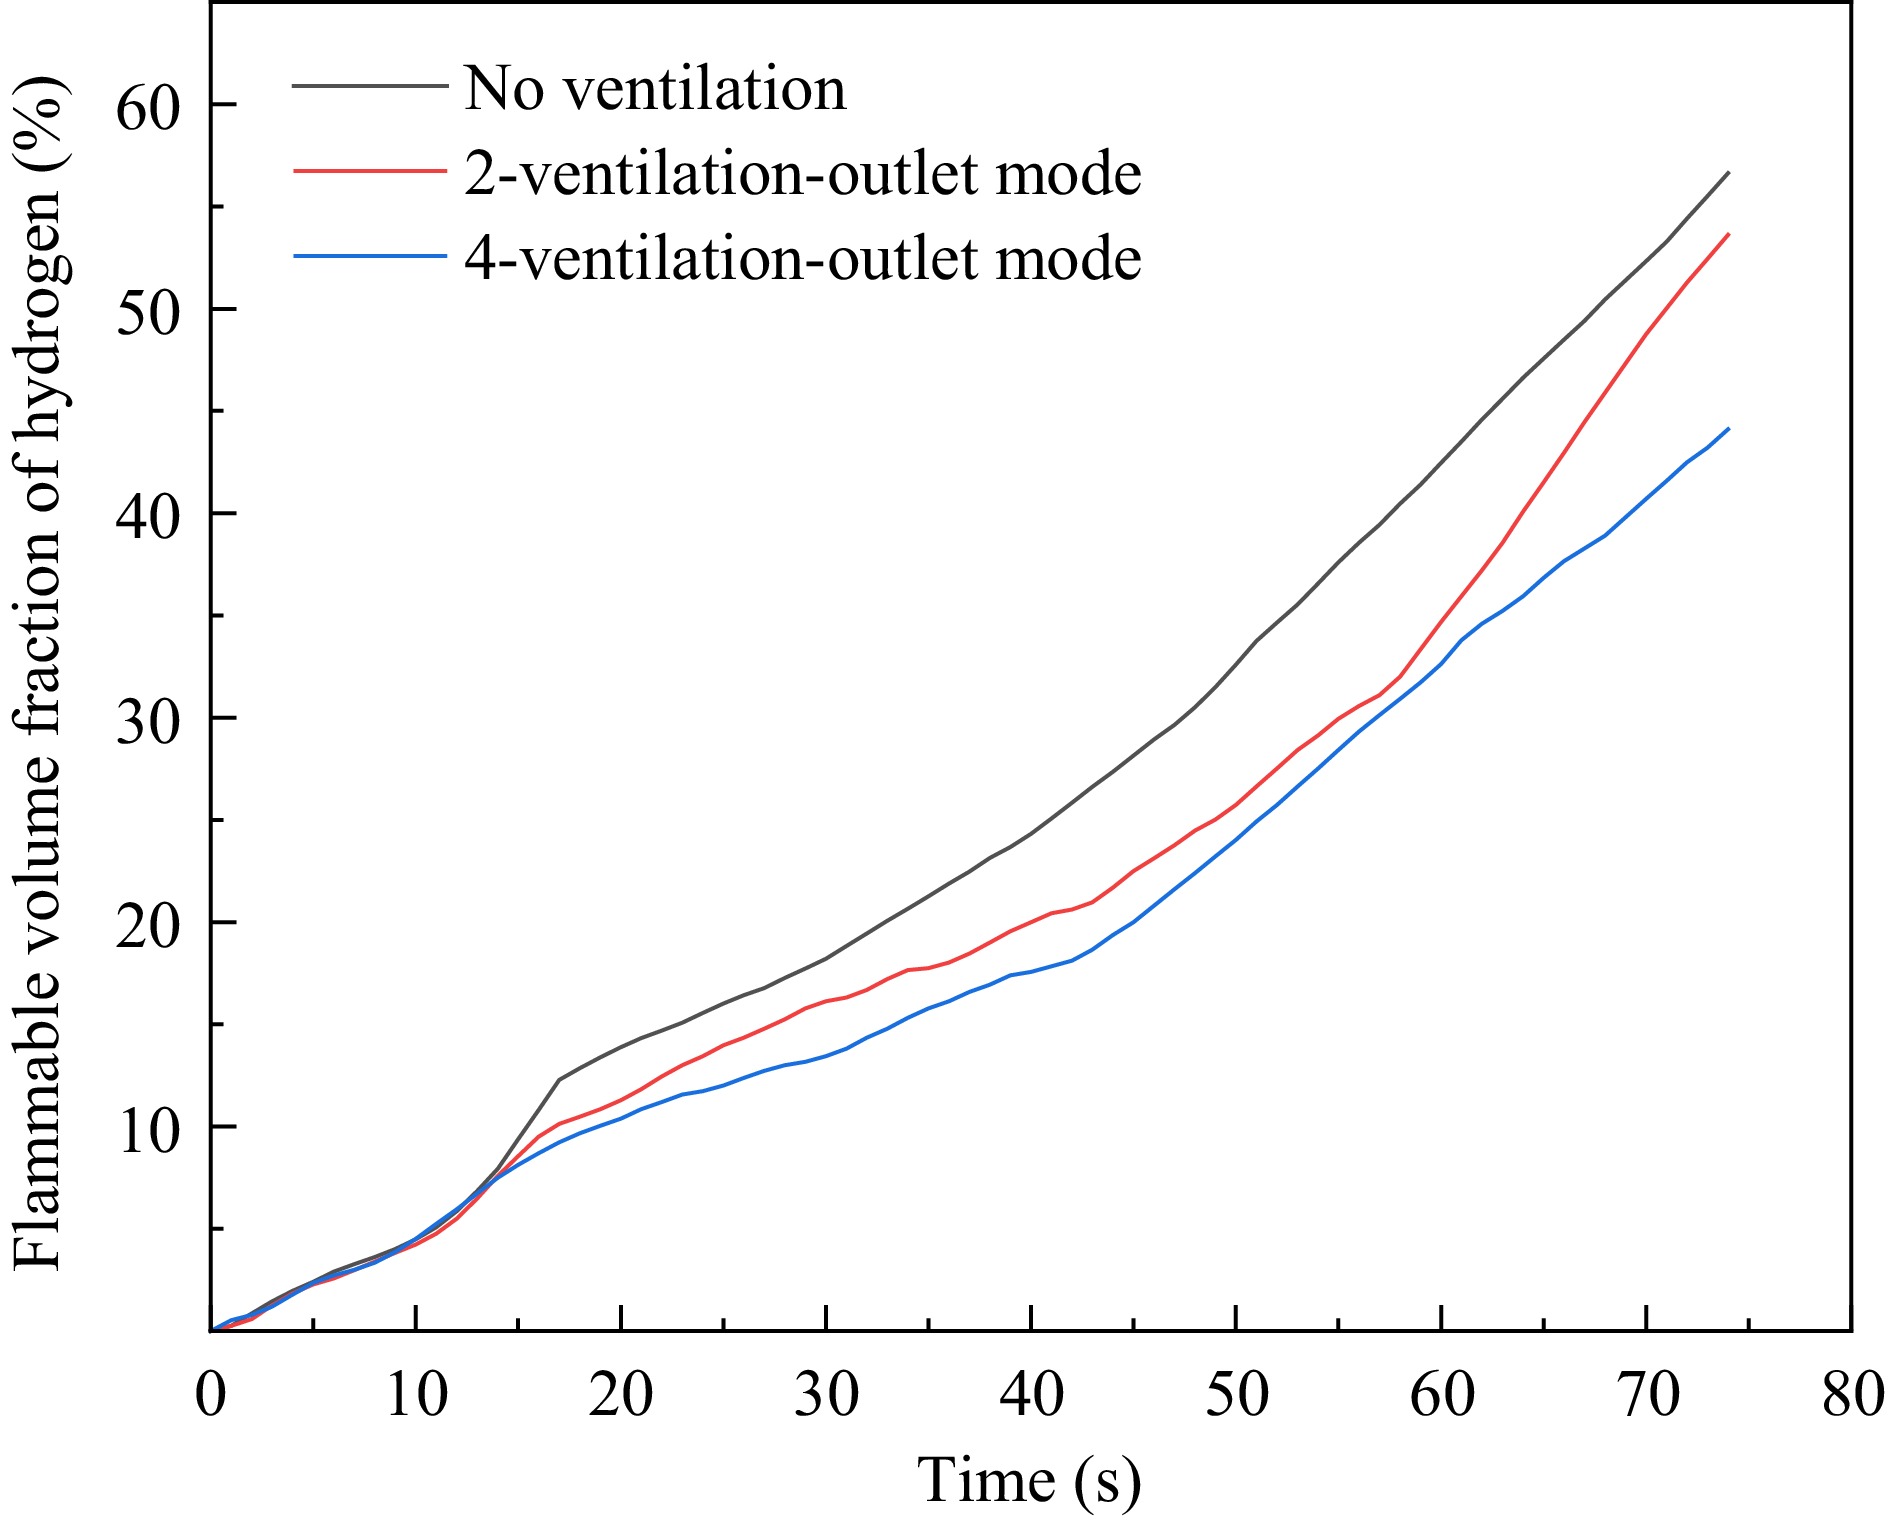
Figure 11.
Volume fraction of hydrogen flammable area in the garage under different ventilation conditions.
-
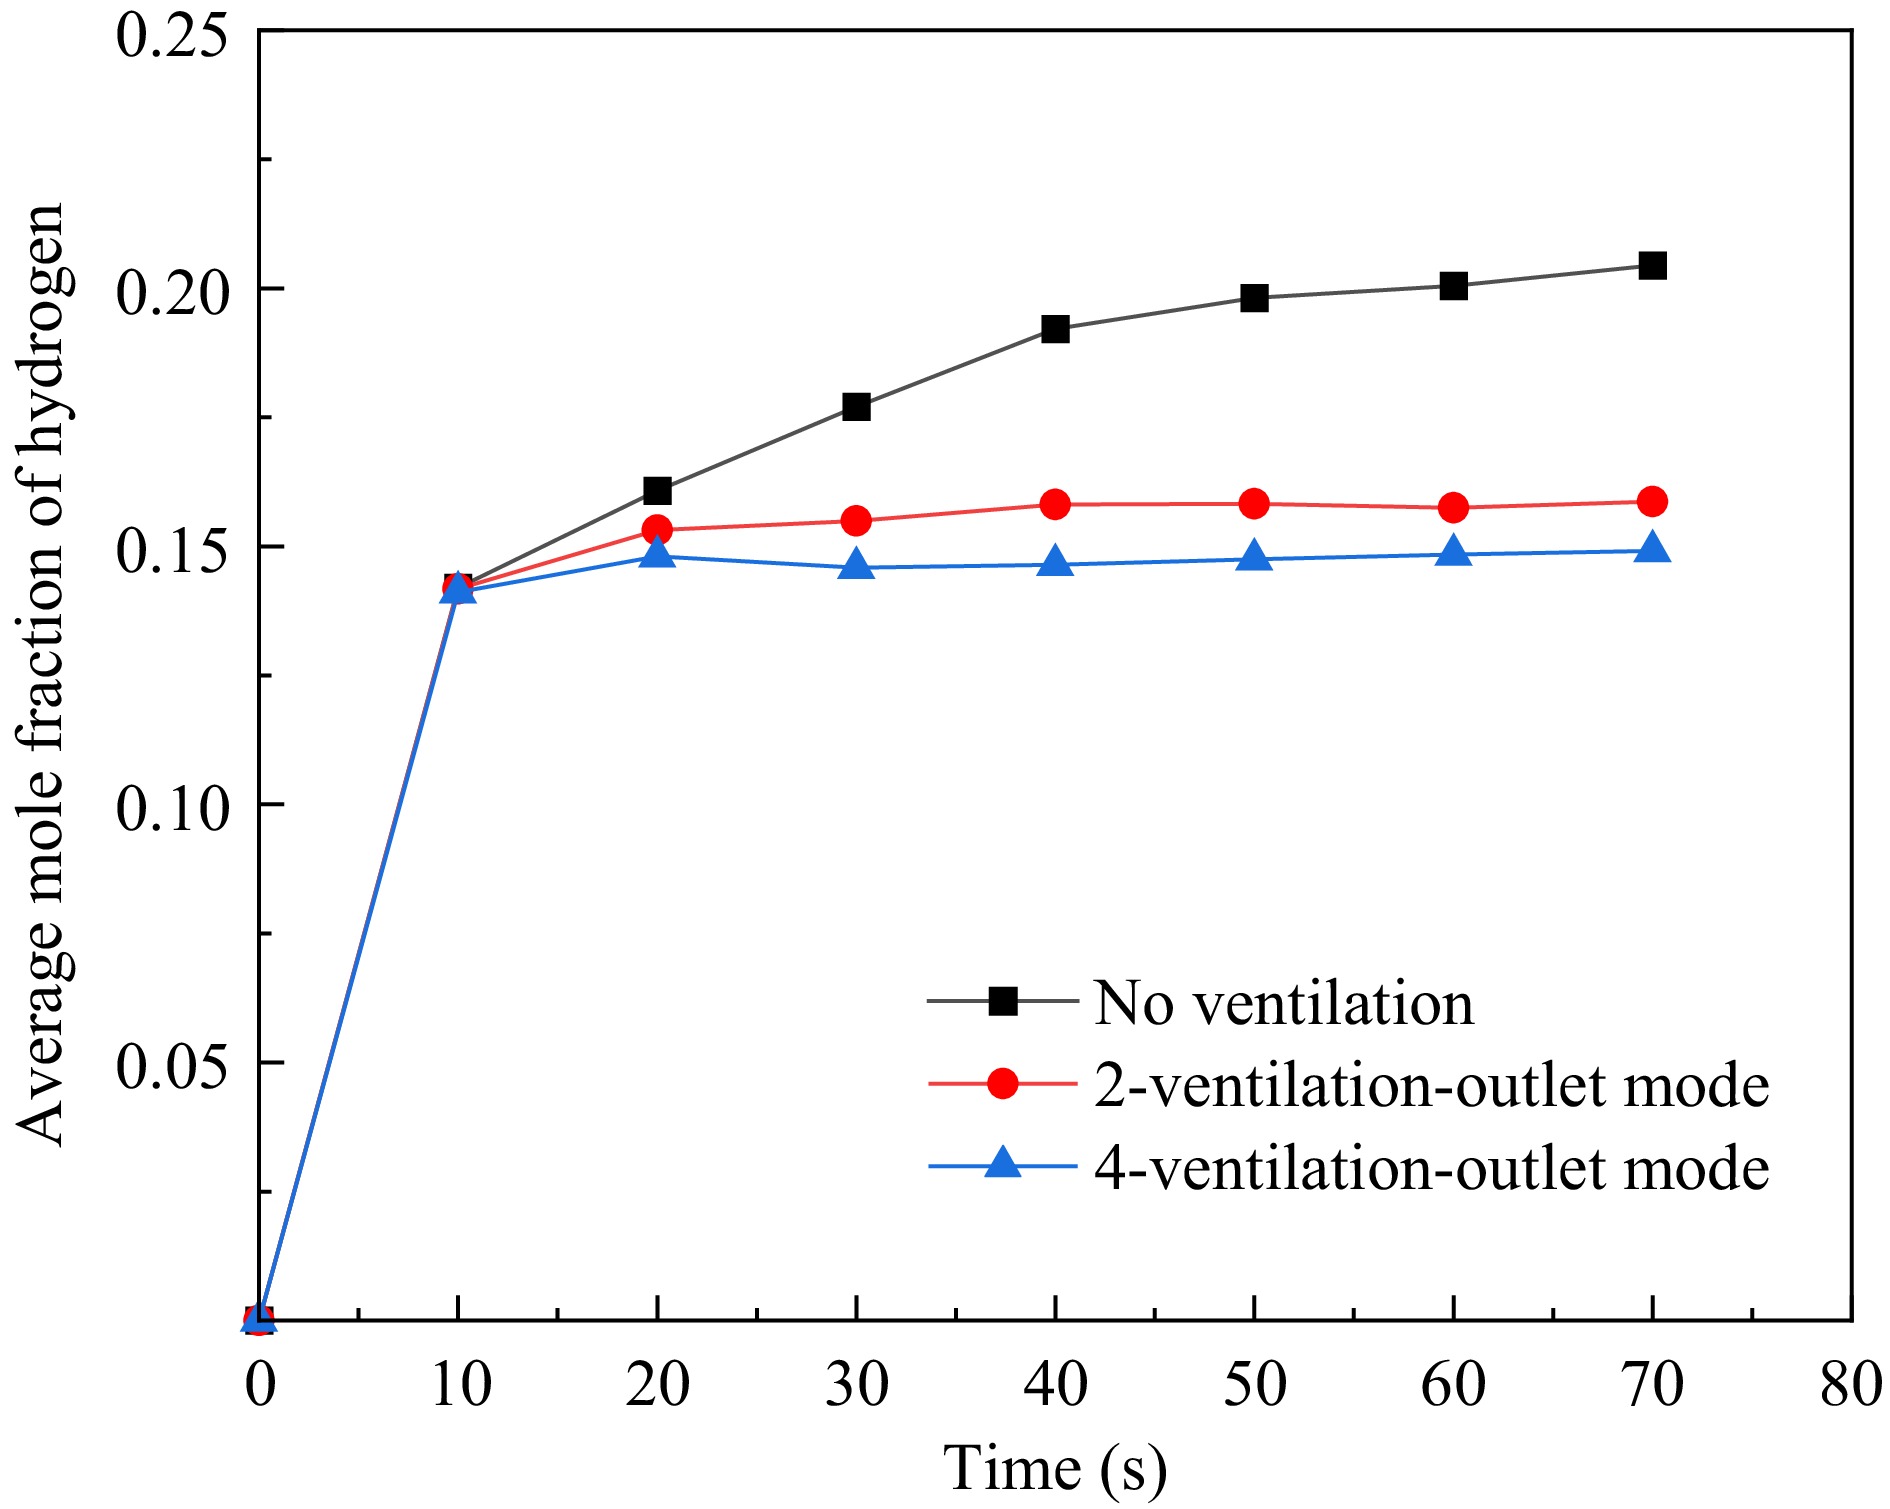
Figure 12.
Average hydrogen concentration at various monitoring points in the garage under different ventilation scenarios.
-
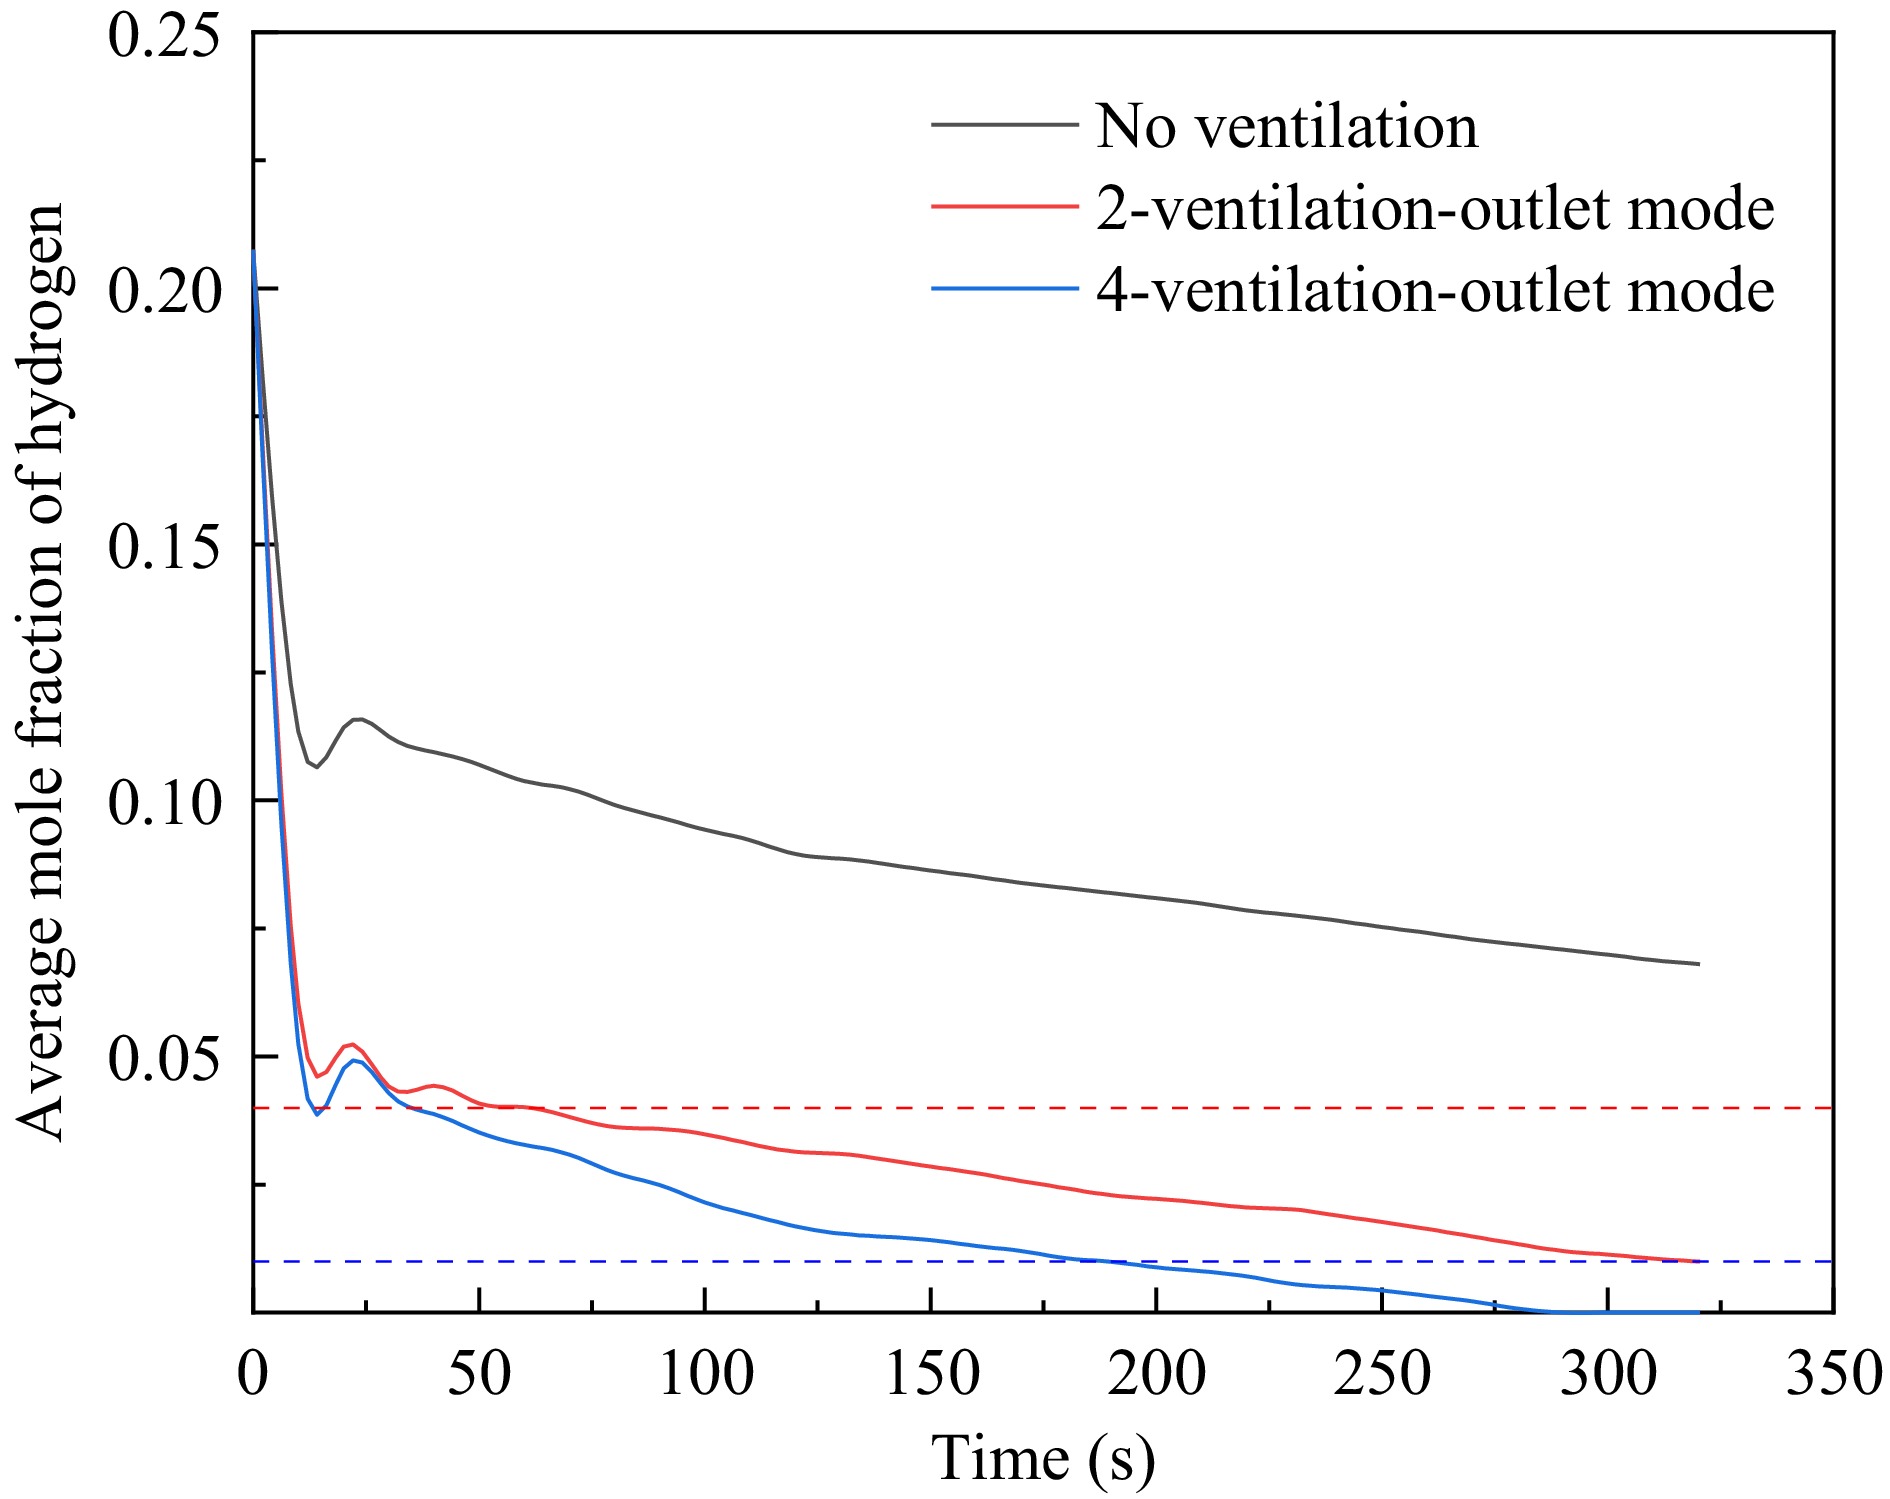
Figure 13.
Average hydrogen concentration at various monitoring points in the garage under different ventilation conditions after the cessation of leakage.
-
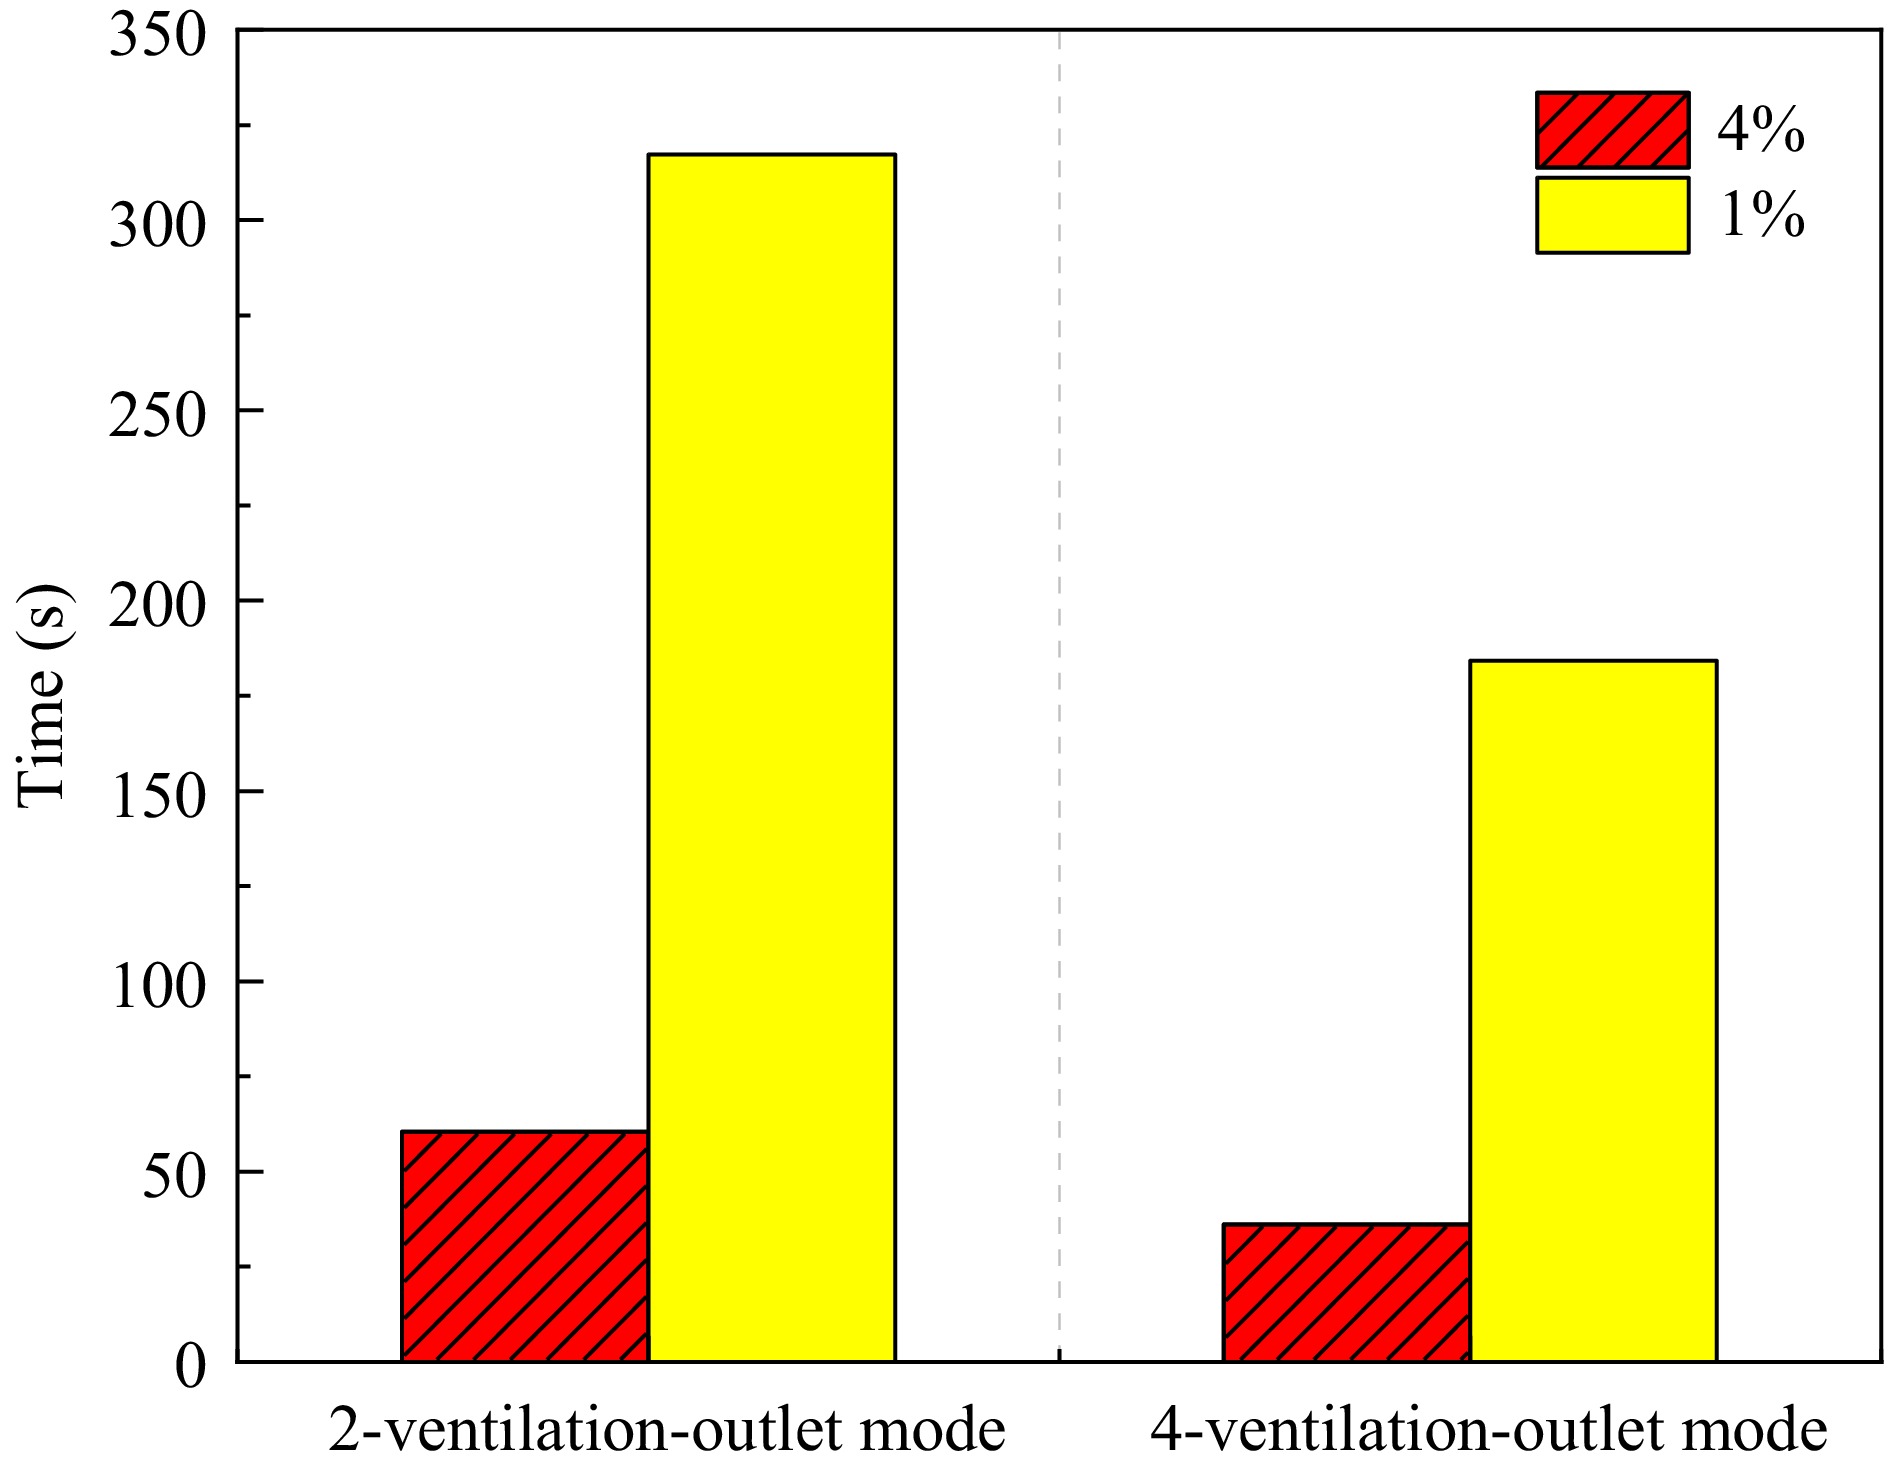
Figure 14.
Time to reach 4% and 1% hydrogen molar fractions in the garage under different ventilation modes.
-
Parameter Actual leakage port Virtual nozzle Diameter (mm) 2 21.8 Velocity (m/s) 1369.3 2217.9 Temperature (K) 249 300 Pressure (MPa) 18.4 0.101325 Pressure inside the bottle (MPa) 35 Temperature inside the bottle (K) 300 Ambient temperature (K) 300 Ambient pressure (MPa) 0.10325 Table 1.
Summary of hydrogen leakage port parameters.
-
Serial number Parking space
bay patternVentilation mode No. of ventilation openings 1 2 No 0 2 3 No 0 3 4 No 0 4 4 Mechanical ventilation 2 5 4 Mechanical ventilation 4 Table 2.
Summary of modelled conditions.
Figures
(14)
Tables
(2)