-

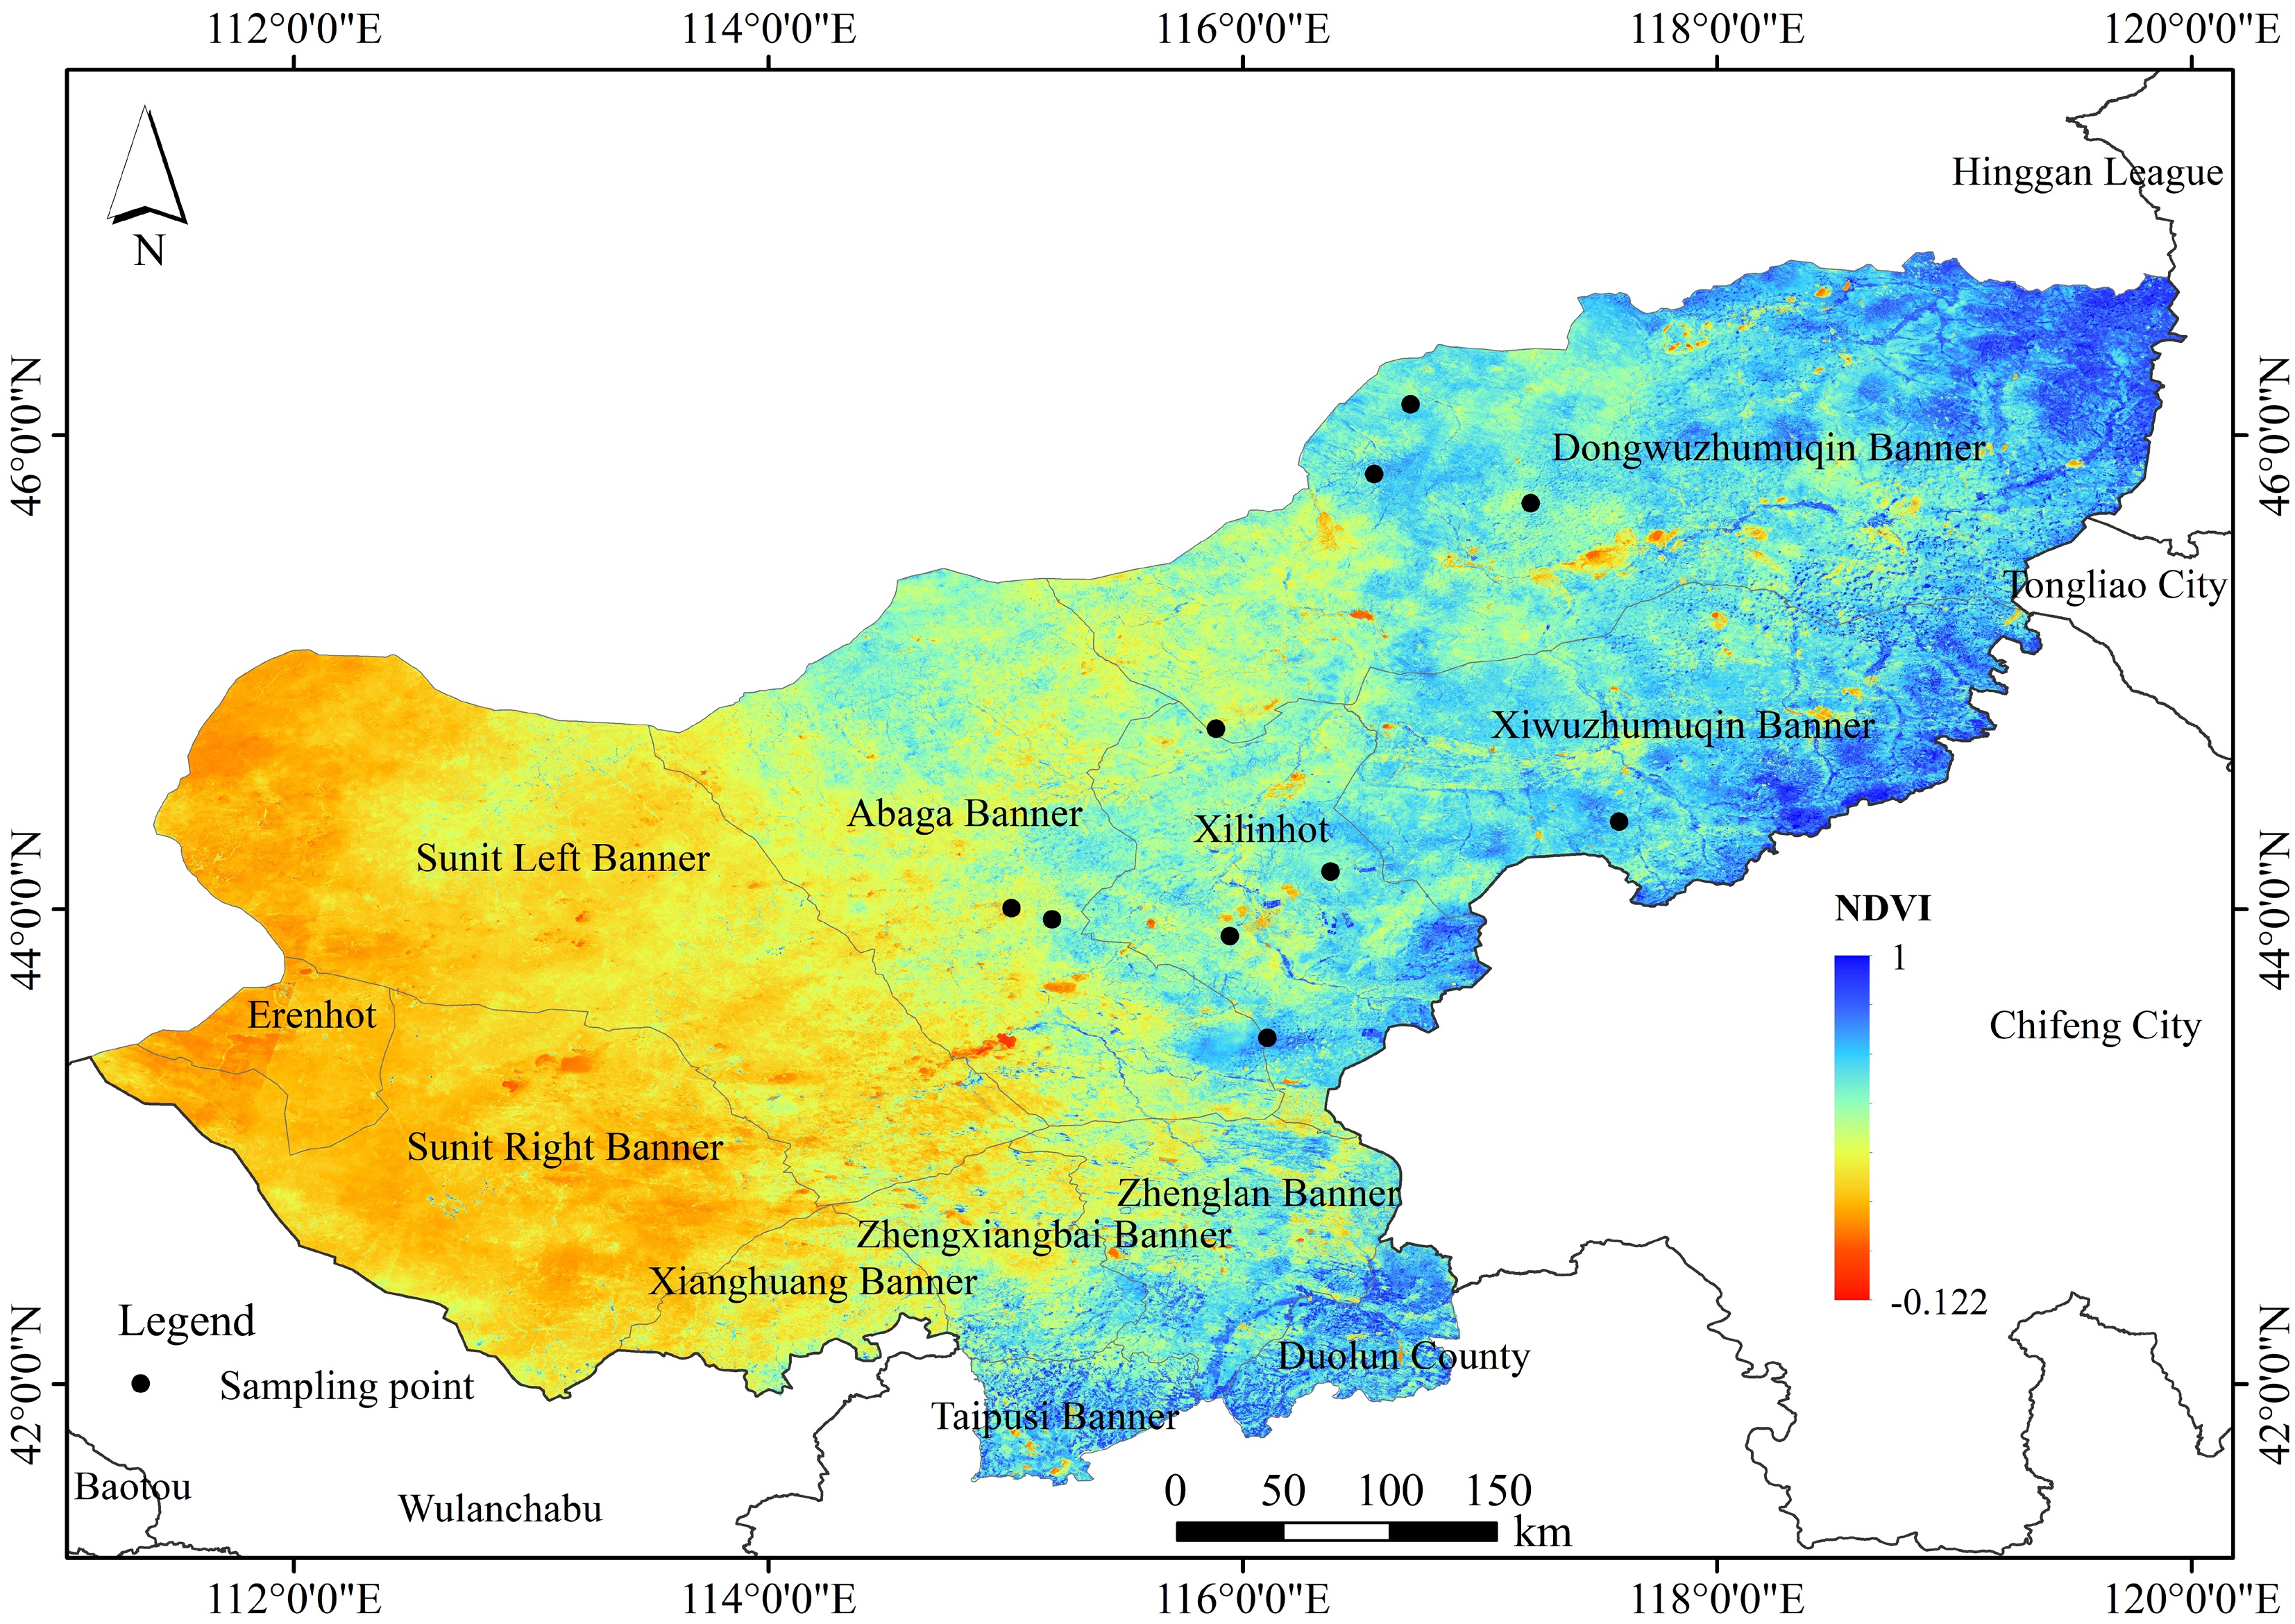
Figure 1.
Geographic distribution of the 10 sampling sites containing 296 sampling individuals. Sampling sites are described in detail in Supplementary Table S1.
-

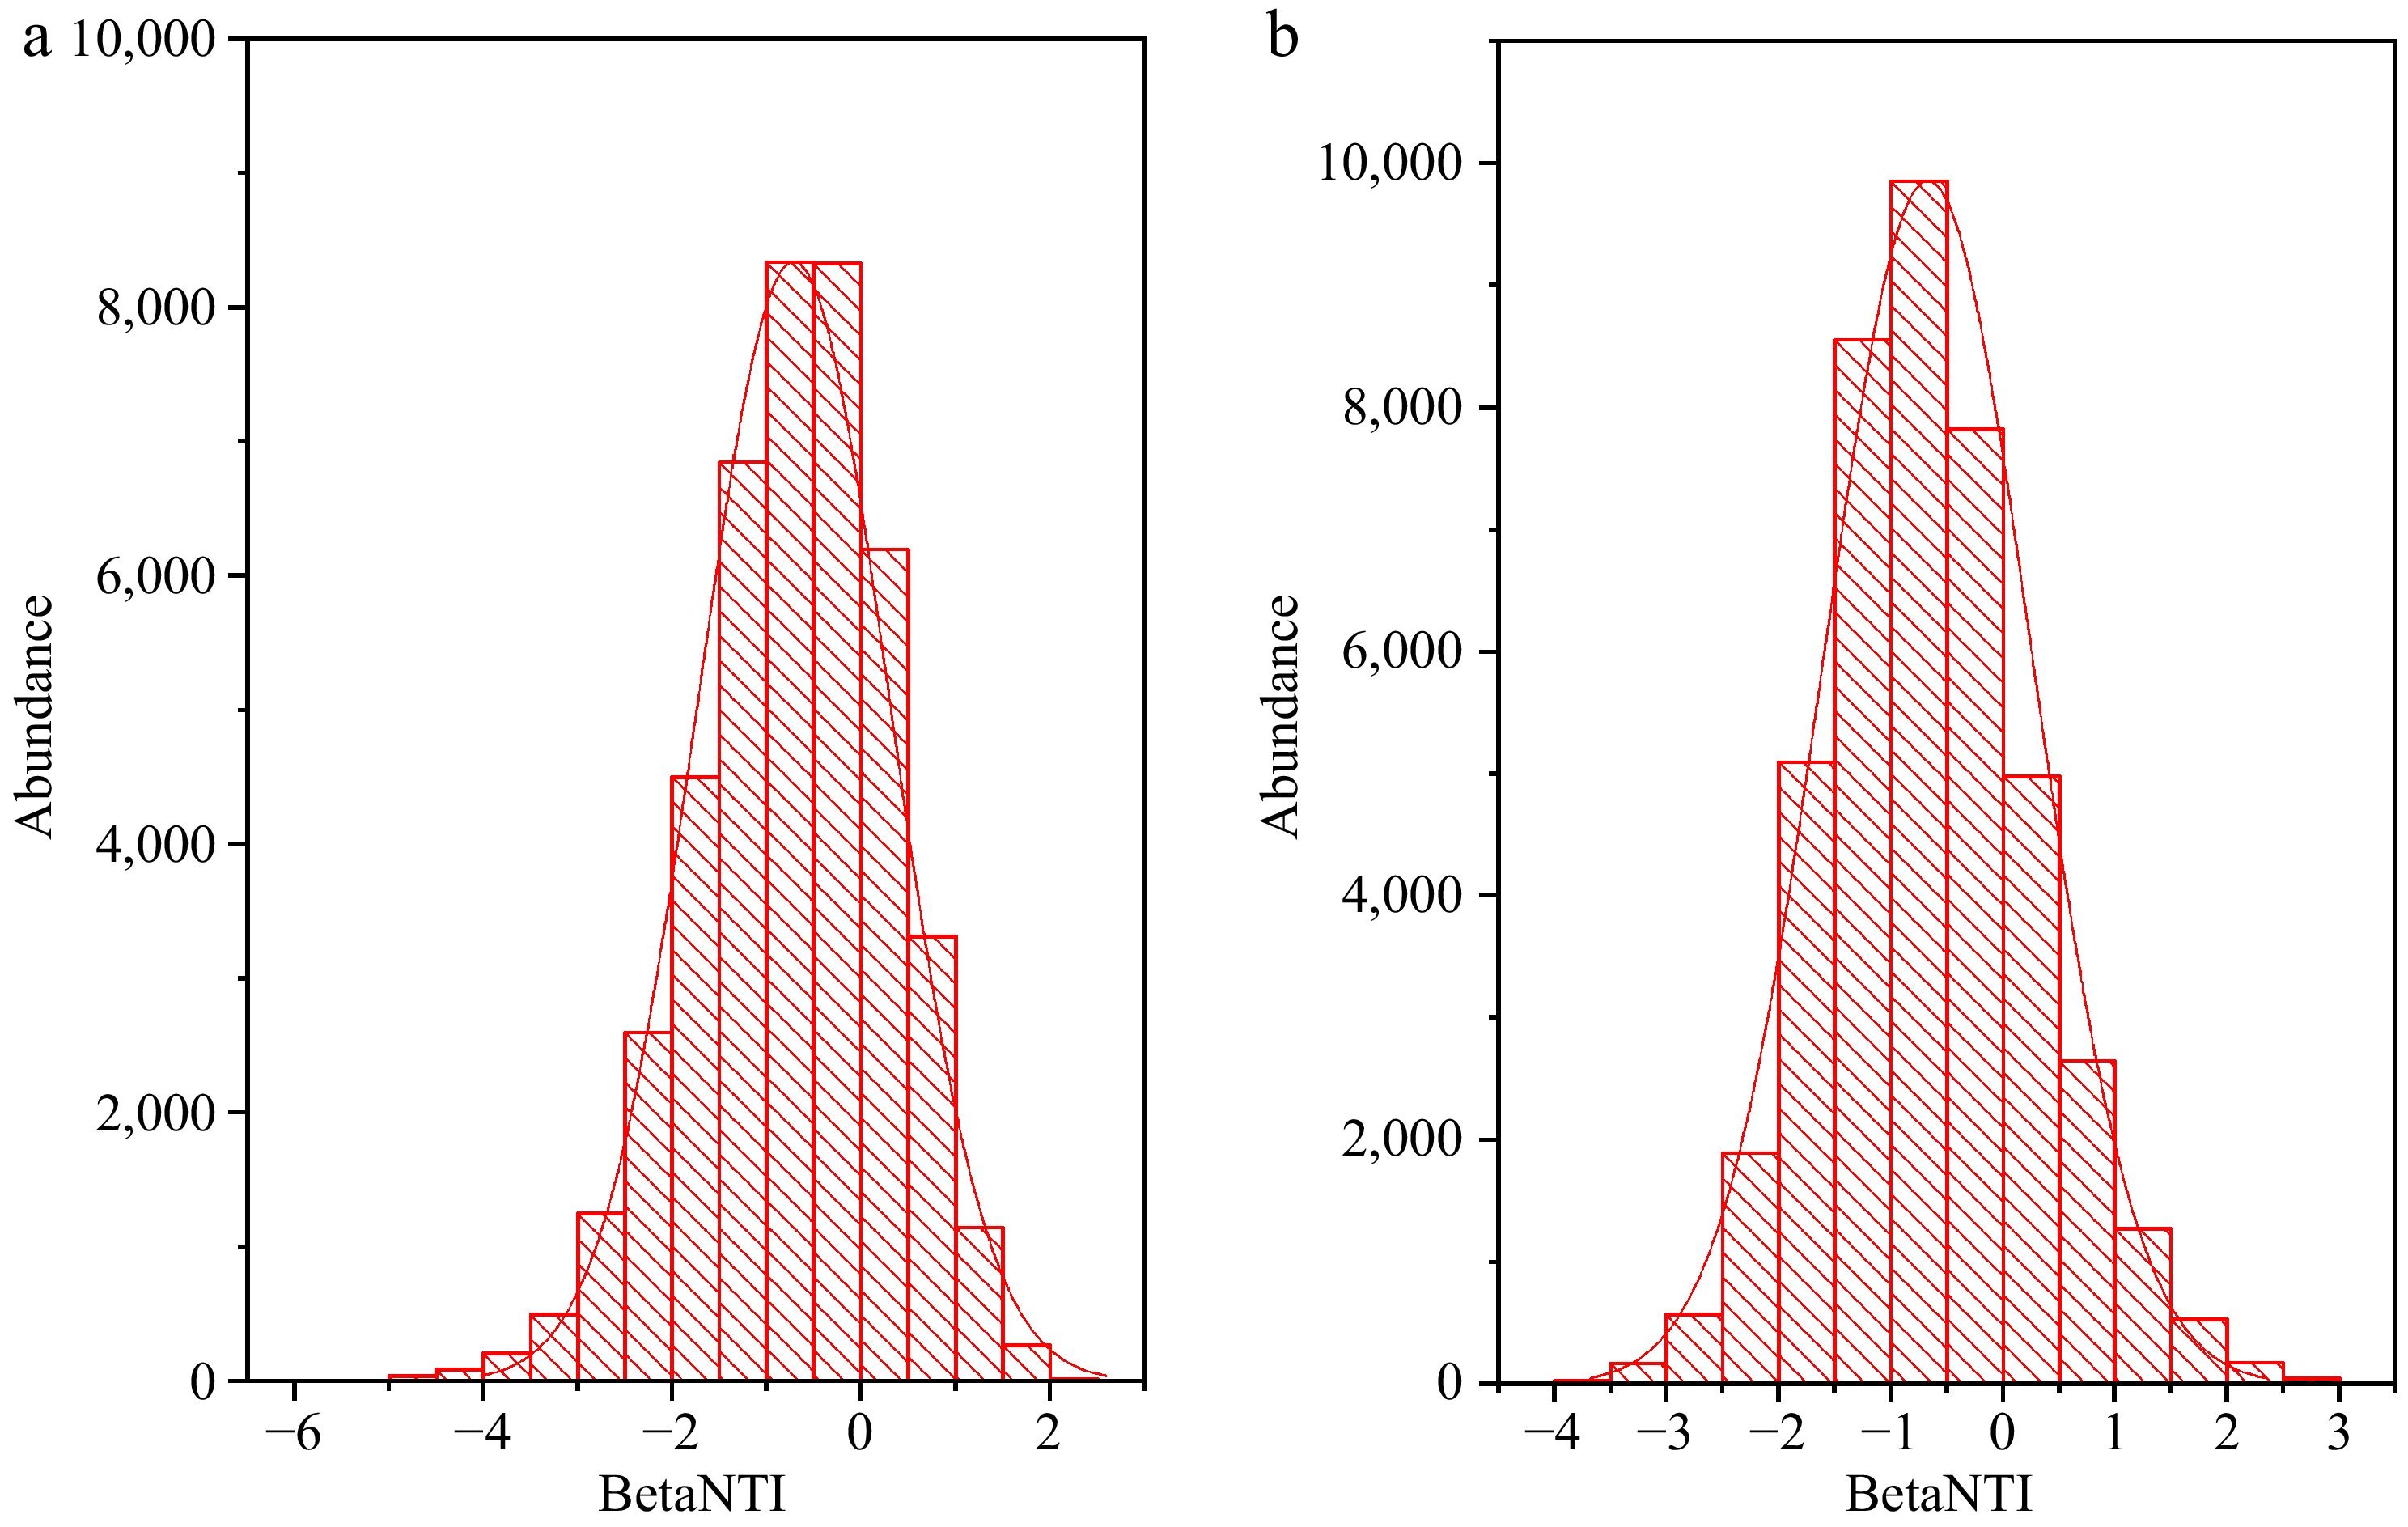
Figure 2.
Distribution of betaNTI and betaNRI values.
-
PCPS1 BetaMNTD BetaMPD Post mean 95% CI Post mean 95% CI Post mean 95% CI Geographical distance 2.2 × 10⁻¹⁰ (1.3 × 10⁻¹², 6.1 × 10⁻¹⁰) 1.9 × 10⁻⁹ (1.9 × 10⁻¹⁶, 8.5 × 10⁻⁹) 1.4 × 10⁻⁸ (5.0 × 10⁻¹⁴, 4.7 × 10⁻⁸) Plant phylogeny 4.5 × 10⁻³ (−1.5 × 10⁻², 2.5 × 10⁻²) −4.6 × 10⁻⁶ (−1.1 × 10⁻⁵, 1.8 × 10⁻⁶) −7.8 × 10⁻⁶ (−2.3 × 10⁻⁵, 6.9 × 10⁻⁶) Environment 1.5 × 10⁻³ (−3.0 × 10⁻³, 5.9 × 10⁻³) 3.7 × 10⁻³ (−9.6 × 10⁻³, 2.0 × 10⁻²) −5.3 × 10⁻⁴ (−3.5 × 10⁻², 3.8 × 10⁻²) Values in bold represent the 95% credible interval did not overlap with 0 and p < 0.05. Table 1.
GLMMMCMC analysis on effects of plant phylogeney, geographical distance and environmental variables on the phylogenetic turnover of AMF communities with sampling site as a random factor. Bayesian postmean estimates and 95% credible intervals are shown. Geographical distance was the only factor significantly explaining phylogenetic turnover of AMF communities, as the 95% credible interval did not overlap with 0 and p < 0.05.
-
PCPS1 BetaMNTD BetaMPD r p r p r p Plant phylogeny 0.008 0.600 0.053 0.043 0.049 0.252 Geographical distance 0.051 0.004 0.179 0.003 0.058 0.012 Environment 0.002 0.998 0.021 0.037 0.022 0.924 p values were FDR adjusted. Values in bold represent the 95% credible interval did not overlap with 0 and p < 0.05. Table 2.
Mantel test between unweighted betaMNTD/betaMPD of AMF communities and plant phylogeny, geographical distance, or environmental variable.
-
Controlling PCPS1 BetaMNTD BetaMPD r p r p r p Plant phylogeny Geographical distance 0.007 0.598 0.046 0.068 0.046 0.237 Environment 0.008 0.597 0.055 0.045 0.047 0.312 Geographical distance Plant phylogeny 0.051 0004 0.177 0.006 0.056 0.009 Environment 0.067 0.001 0.185 0.006 0.072 0.006 Environment Plant phylogeny 0.028 0.996 0.023 0.048 0.019 0.999 Geographical distance 0.005 0.999 0.051 0.999 0.049 0.999 p values were FDR adjusted. Values in bold represent the 95% credible interval did not overlap with 0 and p < 0.05. Table 3.
Partial Mantel test between unweighted betaMNTD/betaMPD of AMF communities and plant phylogeny, geographical distance, or environmental variable, after controlling one of these three factors.
Figures
(2)
Tables
(3)