-

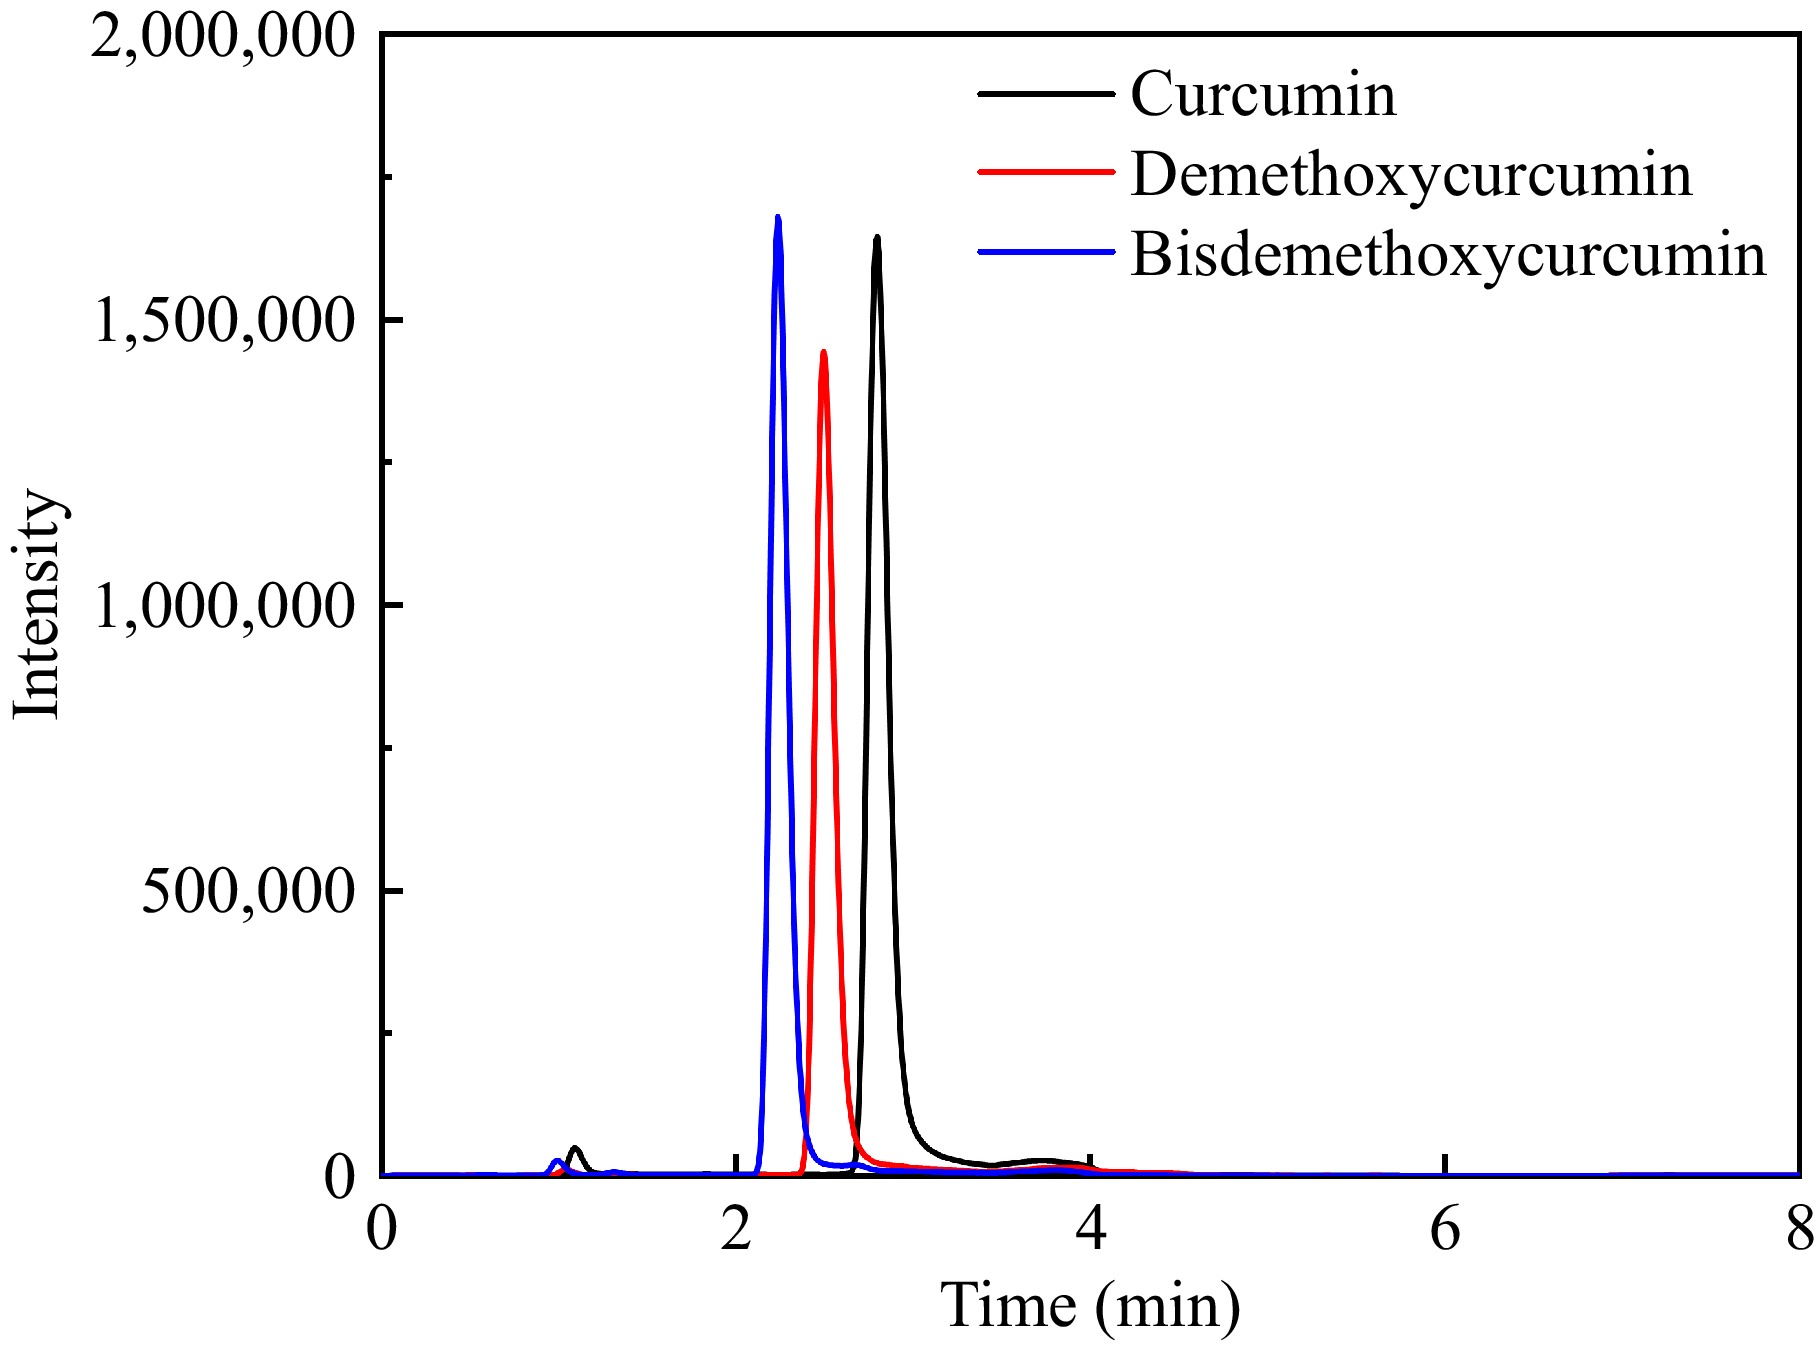
Figure 1.
Extracted ion chromatogram of the three curcumin compounds.
-

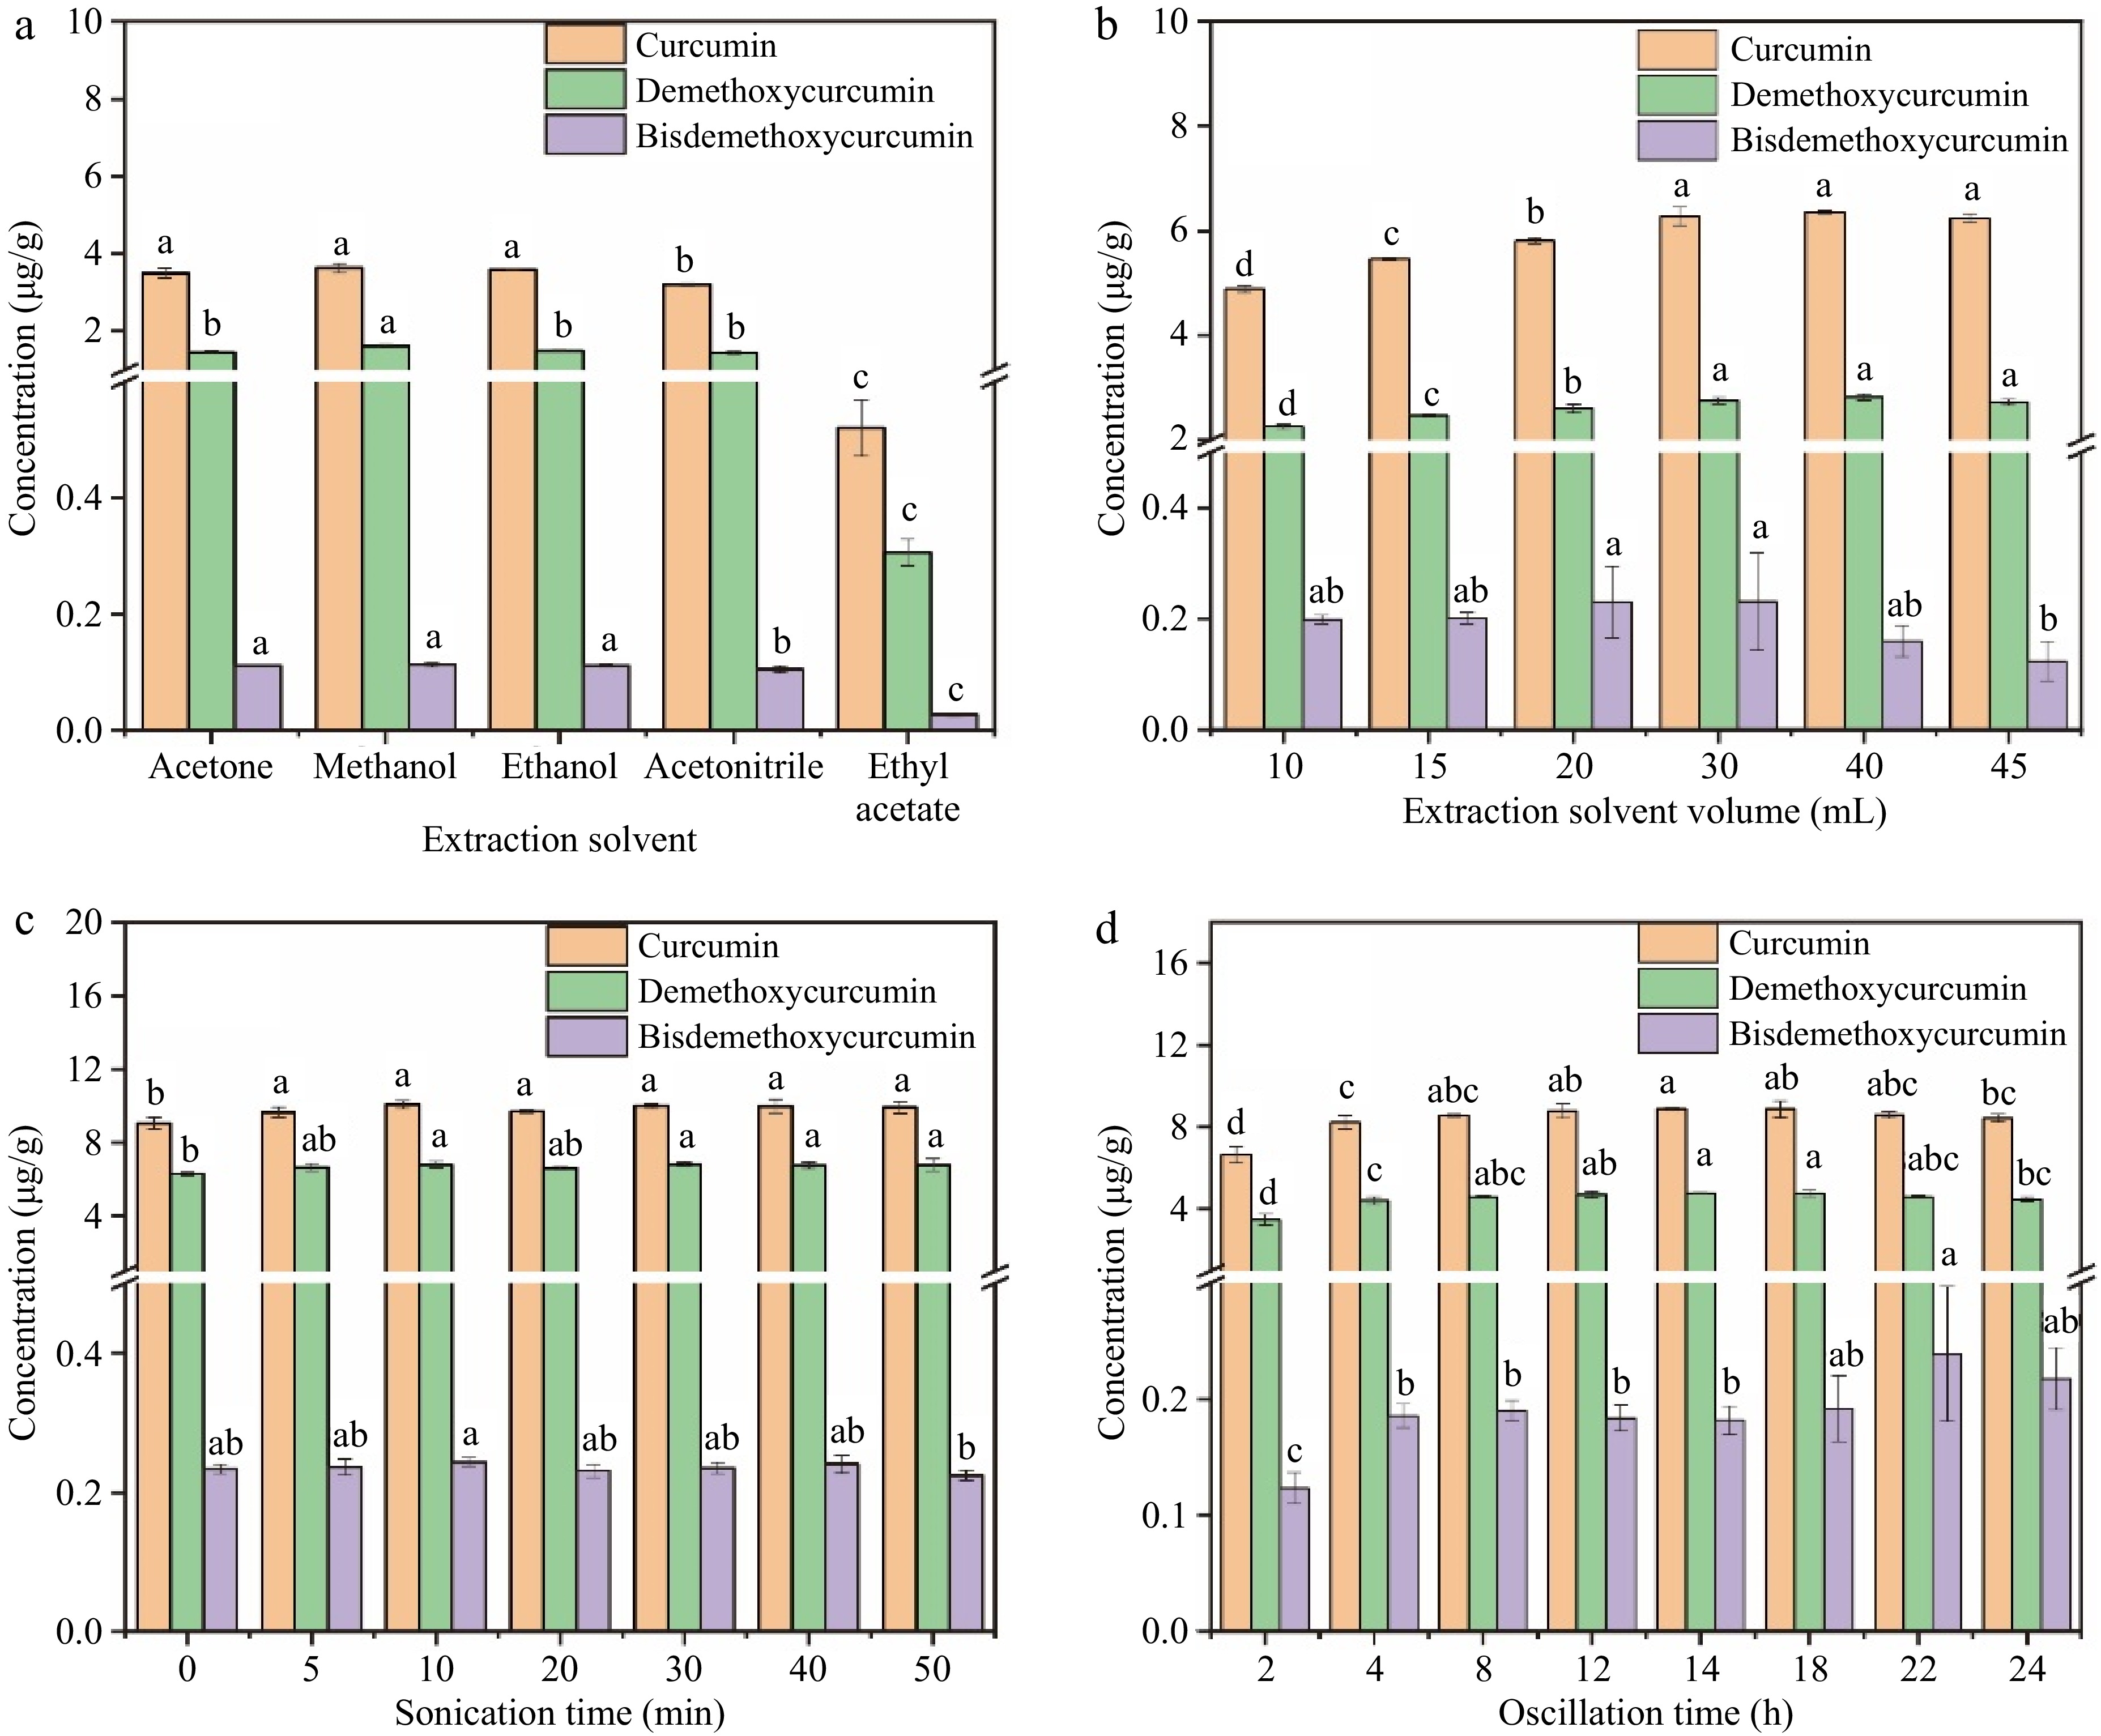
Figure 2.
Effects of extraction conditions on the extraction efficiency of the three curcumin compounds. (a) Extraction solvent, (b) extraction solvent volume, (c) sonication time, (d) oscillation time.
-
Compound RT (min) Precursor ion (m/z) Product ion (m/z) Fragmentor (V) CE (V) Curcumin 2.75 369.2 285.1*/177.1 139 16/18 Demethoxycurcumin 2.45 339.2 255.1*/147.1 148 15/21 Bisdemethoxycurcumin 2.18 309.1 225.1*/147.1 128 13/21 * represents the quantitative ion. Table 1.
MS parameters of the three curcumin compounds.
-
Compound LOD (mg∙kg−1) LOQ (mg∙kg−1) Linear range (mg∙kg−1) R2 Matrix
effect (%)Recovery (%) ± SD Intra-day RSD (%) Inter-day RSD (%) Low Mid High Curcumin 0.006 0.015 0.015-30 0.9999 94.6 97.1 ± 10.7 90.4 ± 19.6 96.8 ± 5.6 5.3 1.8 Demethoxycurcumin 0.006 0.015 0.015-30 0.9990 98.8 100 ± 4.6 94.5 ± 6.1 95.2 ± 4.1 3.5 2.6 Bisdemethoxycurcumin 0.003 0.015 0.015-30 0.9995 96.1 85.0 ± 9.9 81.7 ± 10.5 83.8 ± 1.6 5.2 5.4 SD means standard deviation (n = 6); RSD means relative standard deviations (n = 6). Table 2.
Method validation results of the established methods.
-
Compound name Analysis methodb LOD LOQ R2 Matrix
effect (%)Recovery
(%)RSD (%) Ref. Curcumin HPLC-UV 0.028 ng∙mL−1 0.093 ng∙mL−1 0.9983 / > 98 0.94 and 1.07 (intra-day)
4.44 (inter-day)[20] Curcumin RRS 0.018 mg∙L−1 0.047 mg∙kg−1 1.000 / 97.7–103 2.0–2.6 (intra-day)
2.0–2.6 (inter-day)[49] DWO-VIS 0.013 mg∙L−1 0.33 mg∙kg−1 0.9999 96.3–104 2.3–2.6 (inter-day)
2.2–2.8 (intra-day)Curcumin UHPLC-IM-Q-TOF/MS 1.53 ng∙mL−1 5.09 ng∙mL−1 0.9910 / 93 1.17 (intra-day),
2.73 (inter-day)[23] Demethoxycurcumin 0.77 ng∙mL−1 2.57 ng∙mL−1 0.9922 106 1.91 (intra-day),
3.72 (inter-day)Bisdemethoxycurcumin 1.09 ng∙mL−1 3.63 ng∙mL−1 0.9906 85 2.85 (intra-day),
3.2 (inter-day)Curcumin UHPLC-MS/MS 0.006 mg∙kg−1 0.015 mg∙kg−1 0.9999 94.6 98.7–104.2 5.3 (intra-day),
1.8 (inter-day)Current
studyDemethoxycurcumin 0.006 mg∙kg−1 0.015 mg∙kg−1 0.9990 98.8 100.7–102.9 3.5 (intra-day),
2.6 (inter-day)Bisdemethoxycurcumin 0.003 mg∙kg−1 0.015 mg∙kg−1 0.9995 96.1 80.0–83.3 5.2 (intra-day),
5.4 (inter-day)'/', not provided. b. HPLC-UV, high-performance liquid chromatography; RRS, resonance Rayleigh scattering; DWO-VIS, dual wavelength visible absorption spectroscopy; UHPLC-IM-Q-TOF/MS, ultra-high-performance liquid chromatograph ion mobility quadrupole time-of-flight mass spectrometry; HPLC-MS/MS, ultra-high-performance liquid chromatography coupled with tandem mass spectrometry. Table 3.
Comparison of the present study for the determination curcumin compound by different methods in ginger*.
-
Compound Concentration (mg∙kg−1)* Sample A Sample B Sample C Sample D Sample E Sample F Curcumin 0.575 ± 0.042 0.719 ± 0.008 5.228 ± 0.043 7.304 ± 0.095 10.143 ± 0.095 4.16 ± 0.073 Demethoxycurcumin 0.368 ± 0.029 0.511 ± 0.009 3.148 ± 0.042 4.589 ± 0.049 7.196 ± 0.081 3.05 ± 0.037 Bisdemethoxycurcumin 0.019 ± 0.001 0.019 ± 0.001 0.218 ± 0.009 0.276 ± 0.004 0.281 ± 0.005 0.191 ± 0.005 * The data were expressed as 'mean values ± standard deviation'. Table 4.
Concentration of the three curcumin compounds in ginger samples.
Figures
(2)
Tables
(4)