-

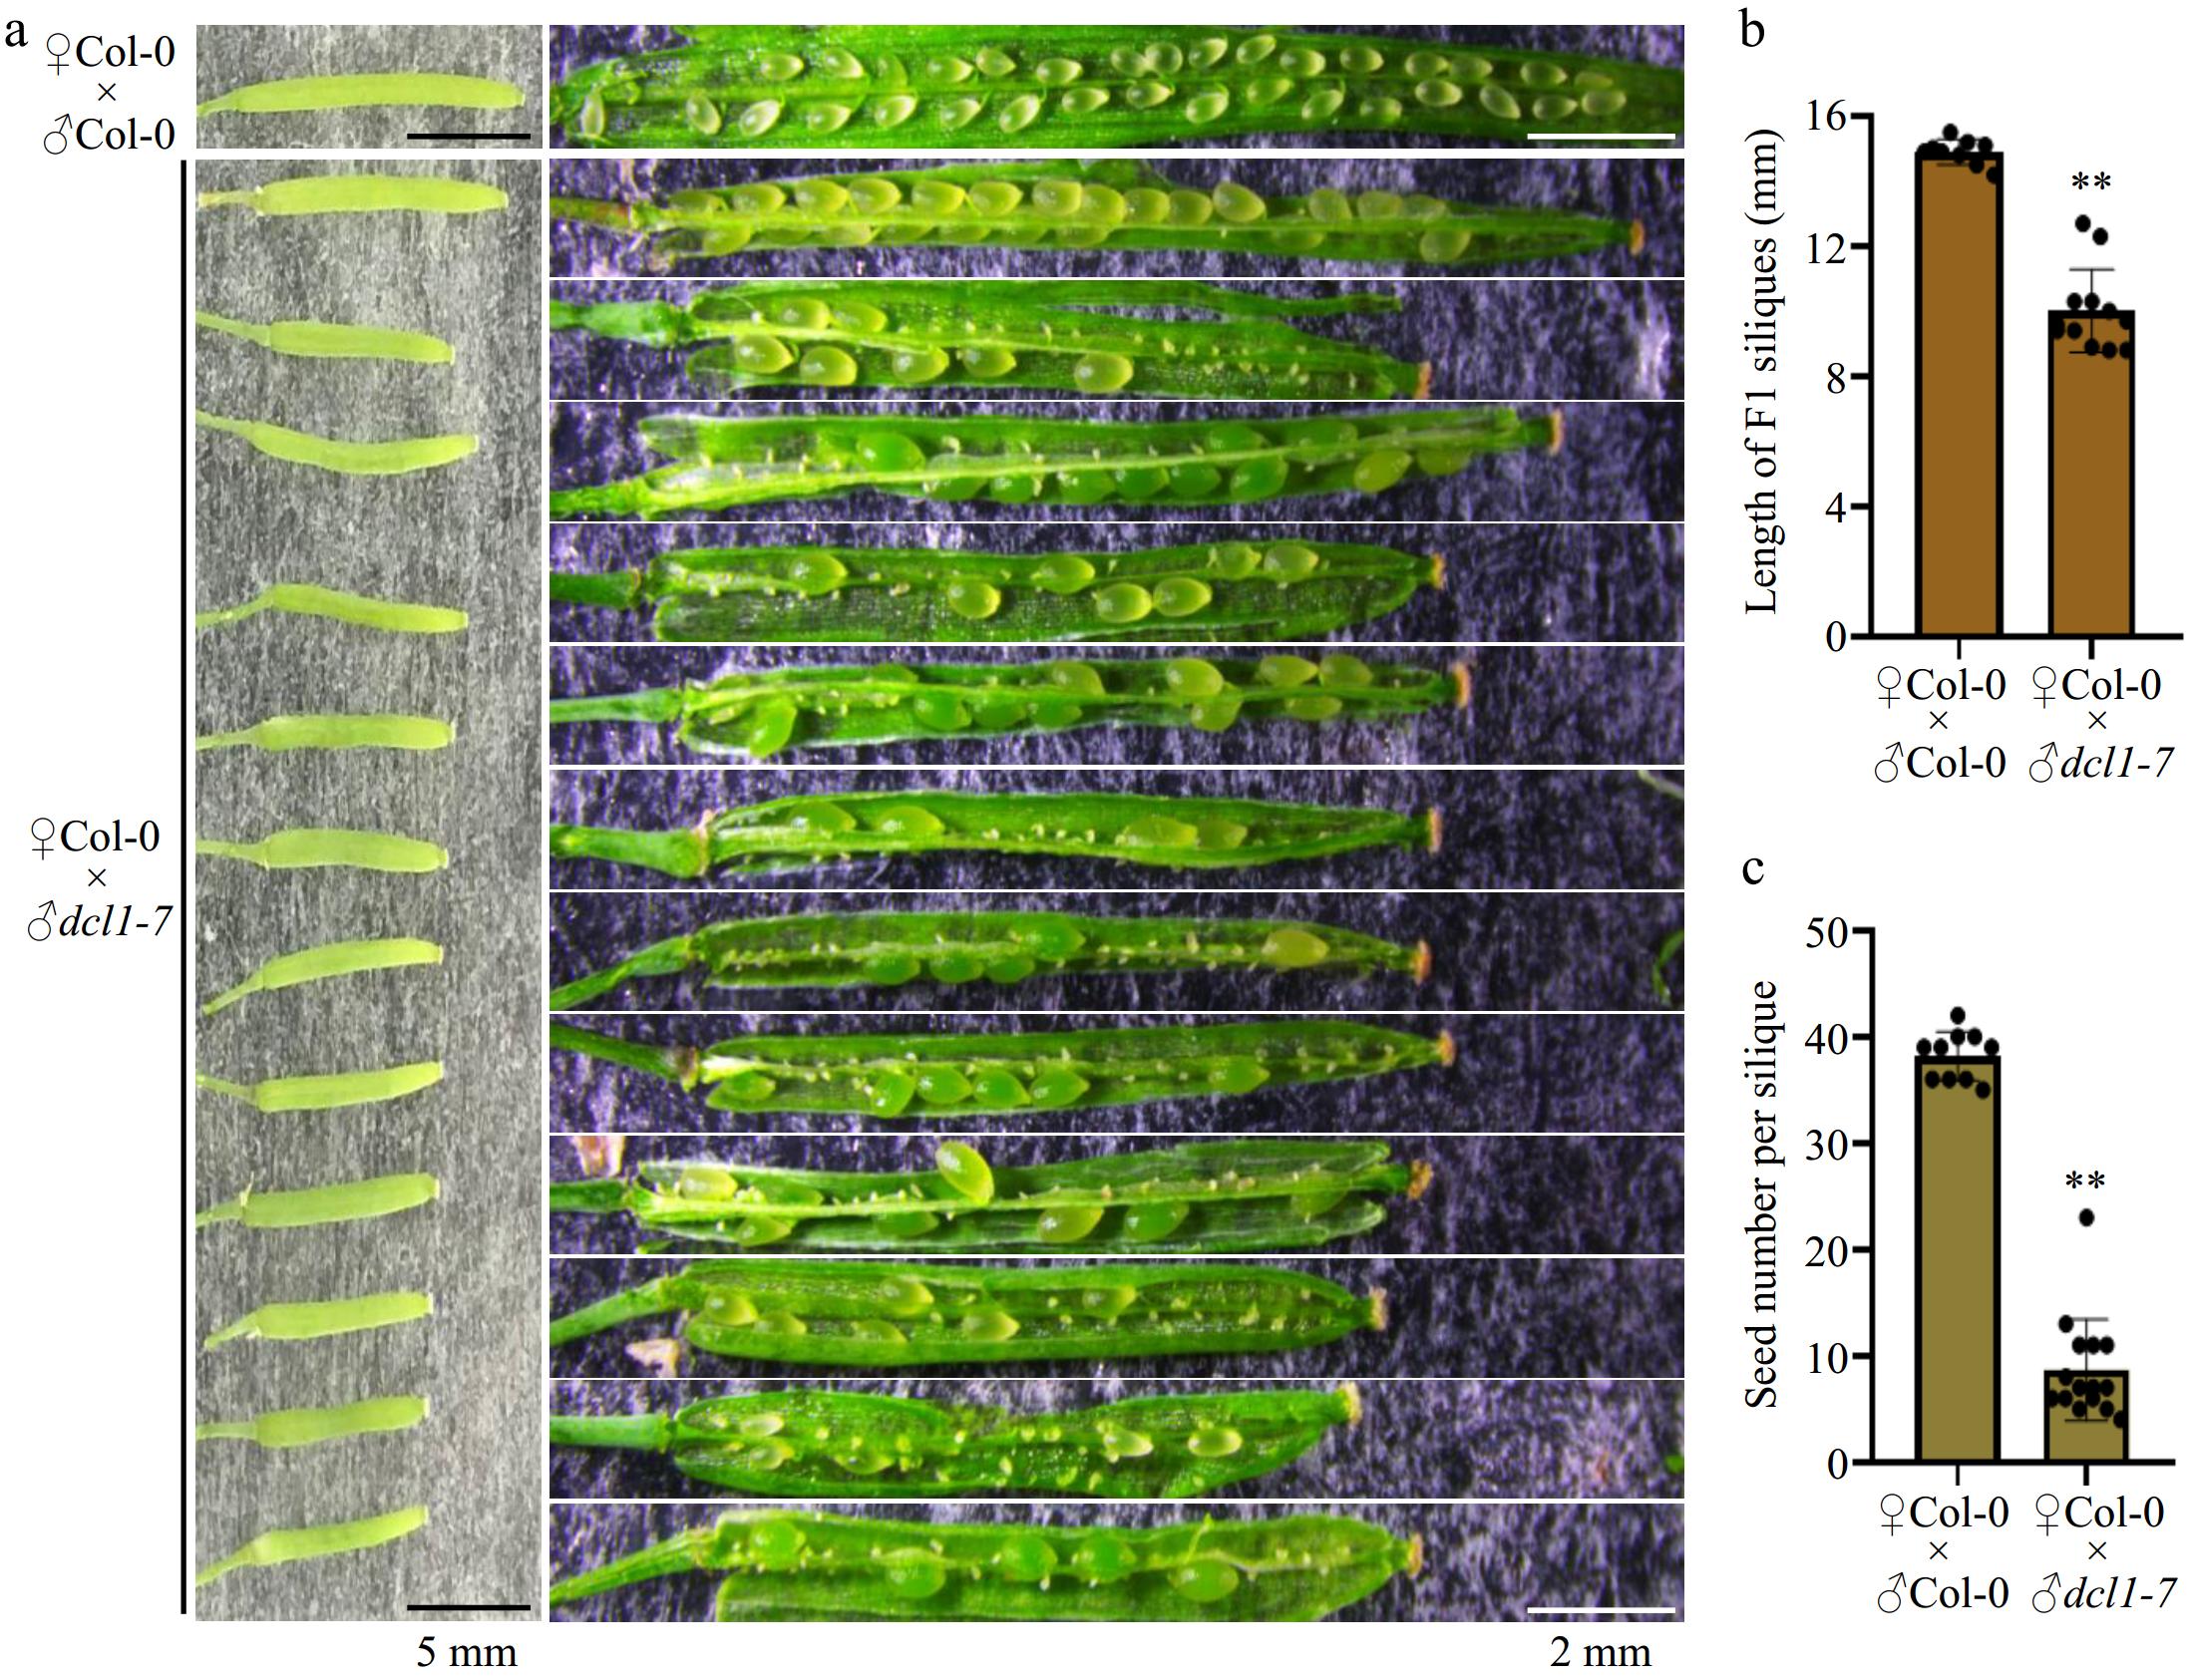
Figure 1.
Hand-pollination by the dcl1-7 mutant pollen caused defects in seed production. (a) Representative F1 siliques from ♀Col-0 × ♂Col-0 and ♀Col-0 × ♂dcl1-7 respectively. The dcl1-7 mutant pollen as the male causes aborted seeds. Black bars indicate 5 mm length, and the white bars indicate 2 mm length. (b), (c) Statistical analysis showing the (b) length, and (c) the total number of the F1 siliques. Each point indicates one silique, p-value were calculated using an unpaired, two-sided Student t-test (** p < 0.01). Scale bars are shown.
-

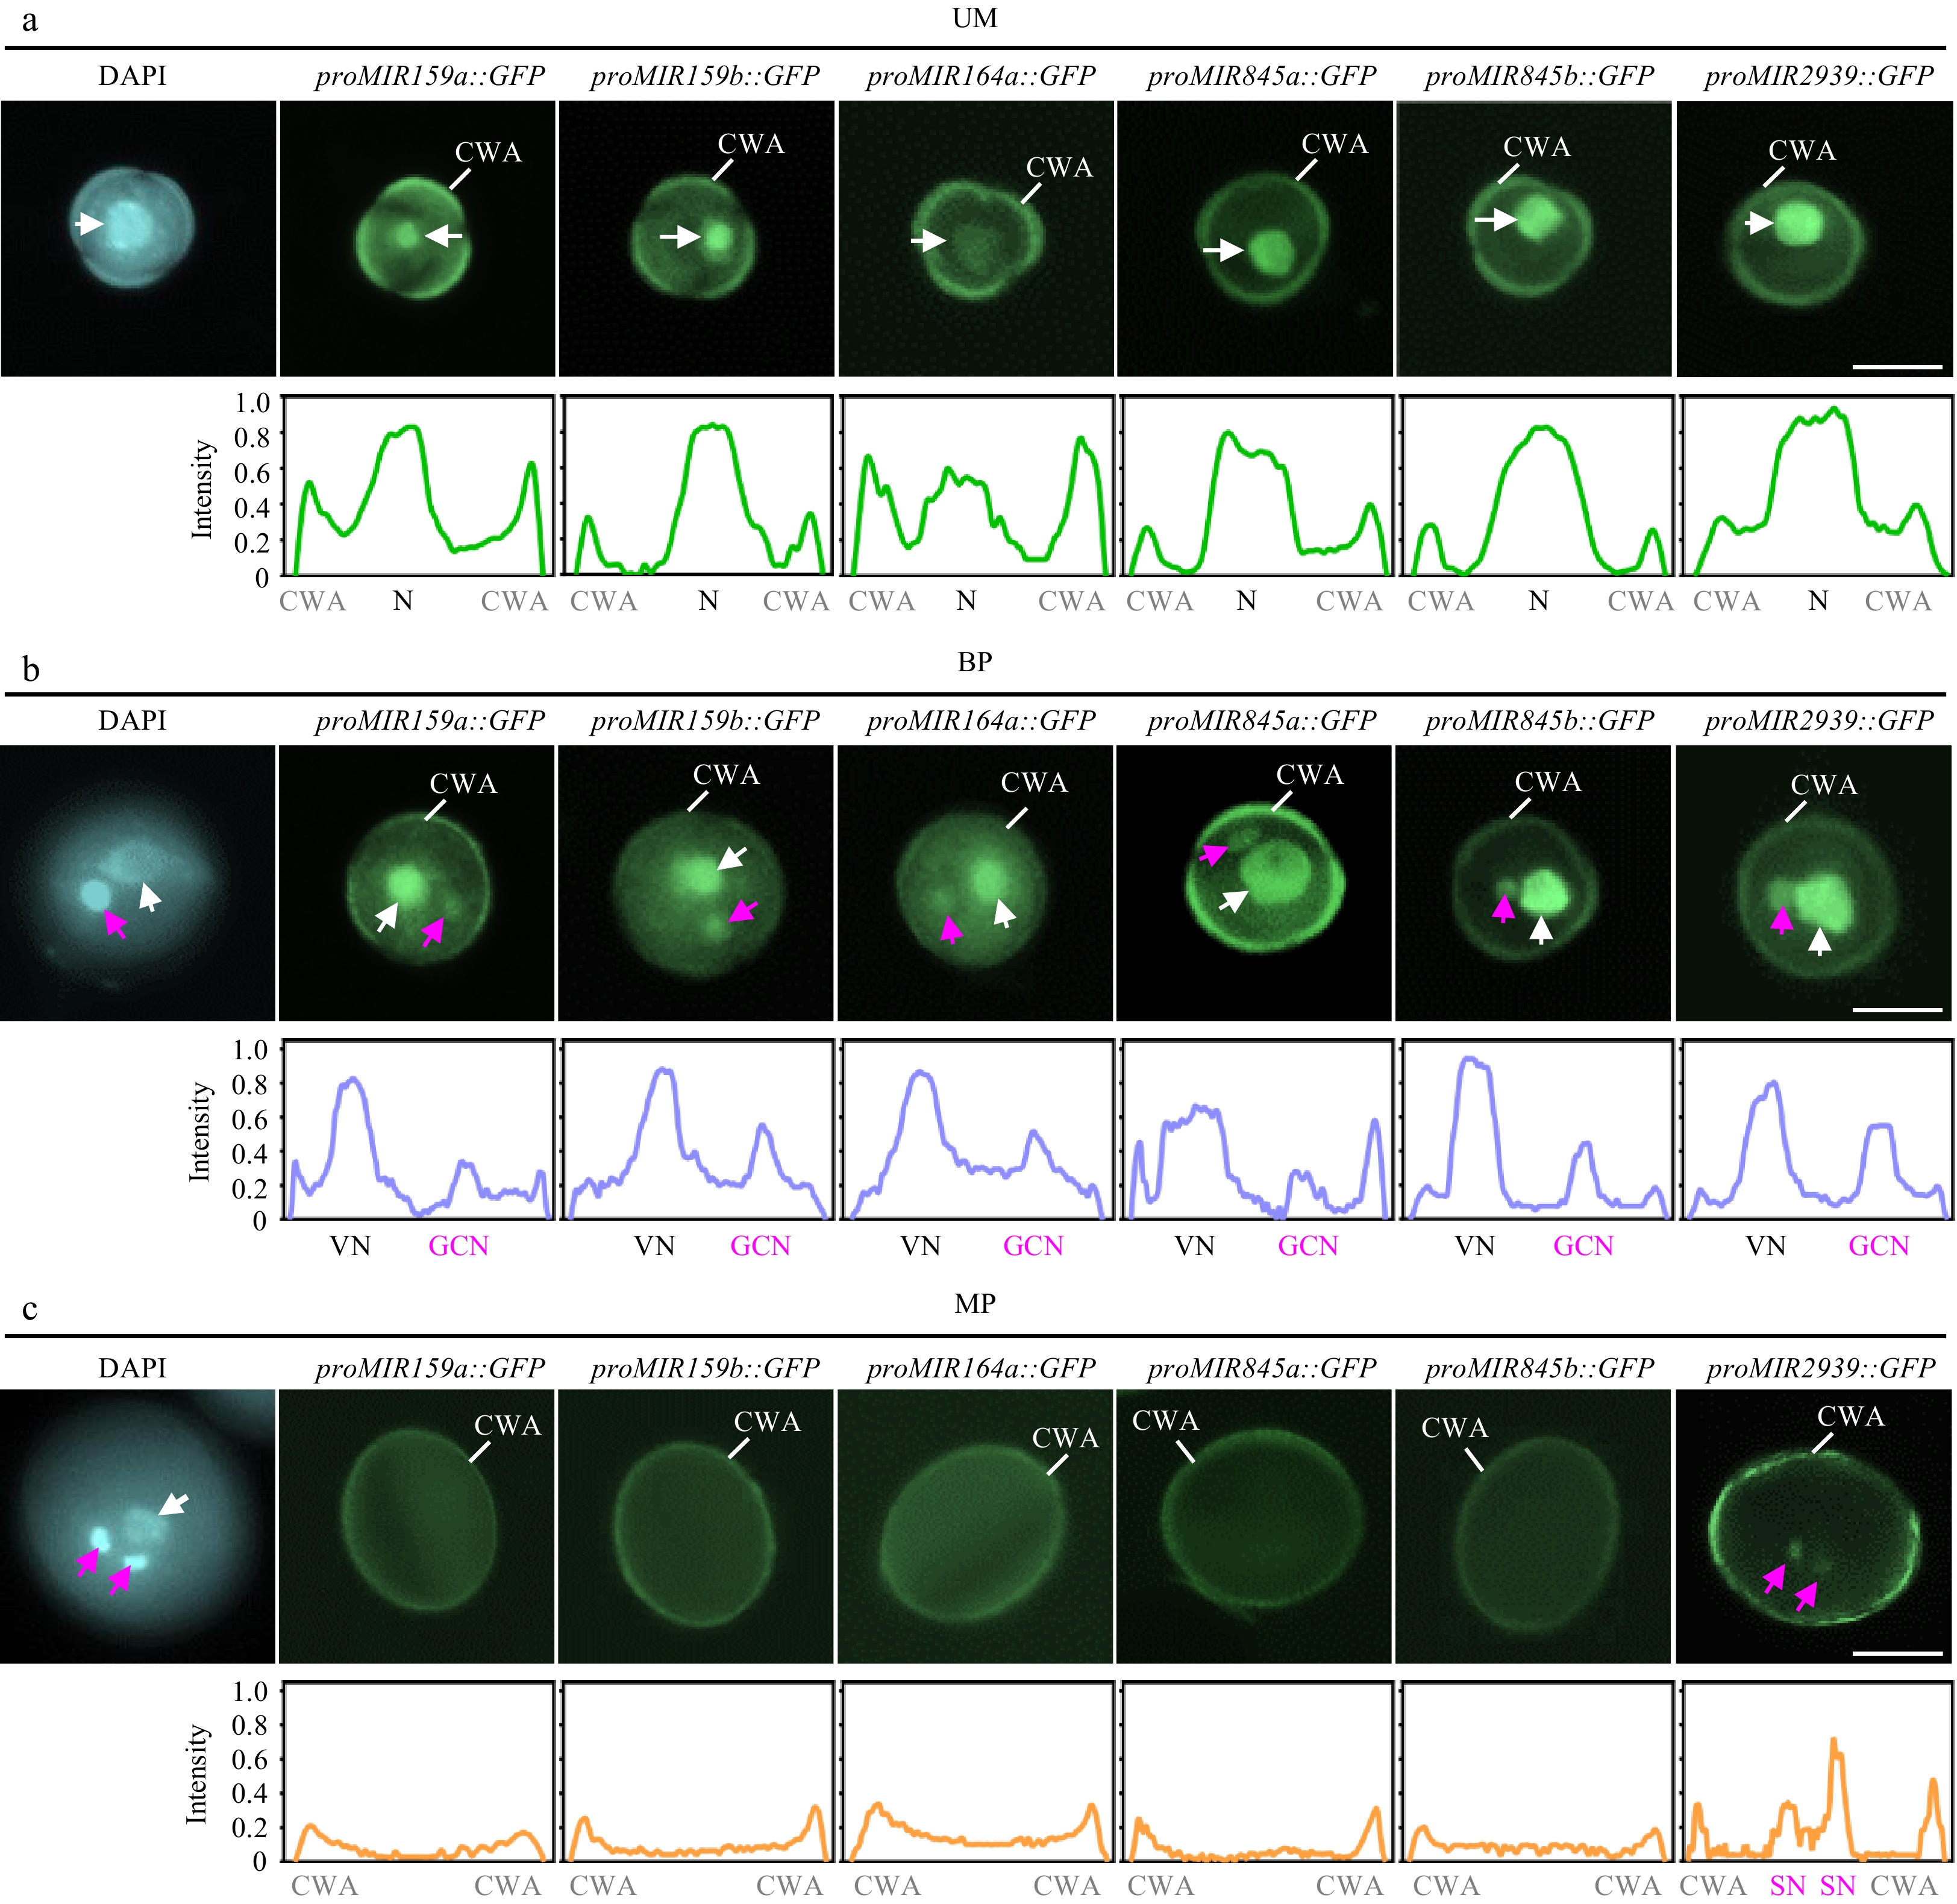
Figure 2.
Spatiotemporal patterns of MIR transcription during pollen development. The expression of proMIR159a::GFP, proMIR159b::GFP, proMIR164a::GFP, proMIR845a::GFP, proMIR845b::GFP, and proMIR2939::GFP was observed during pollen development by fluorescence microscopy. Representative pollen grains show DAPI fluorescence (left, blue) and GFP fluorescence (right, green) at unicellular microspore [(a), UM], bicellular pollen [(b), BP], and mature pollen [(c), MP] stages. White arrowhead indicates N or VN; magenta arrowhead indicates GCN or SN. Relative intensity curve of the GFP signal were shown below the images. VN, vegetative nucleus; GCN, generative cell nucleus, SN, sperm cell nuclei; CWA, cell wall autofluorescence. Scale bar = 10 μm.
-

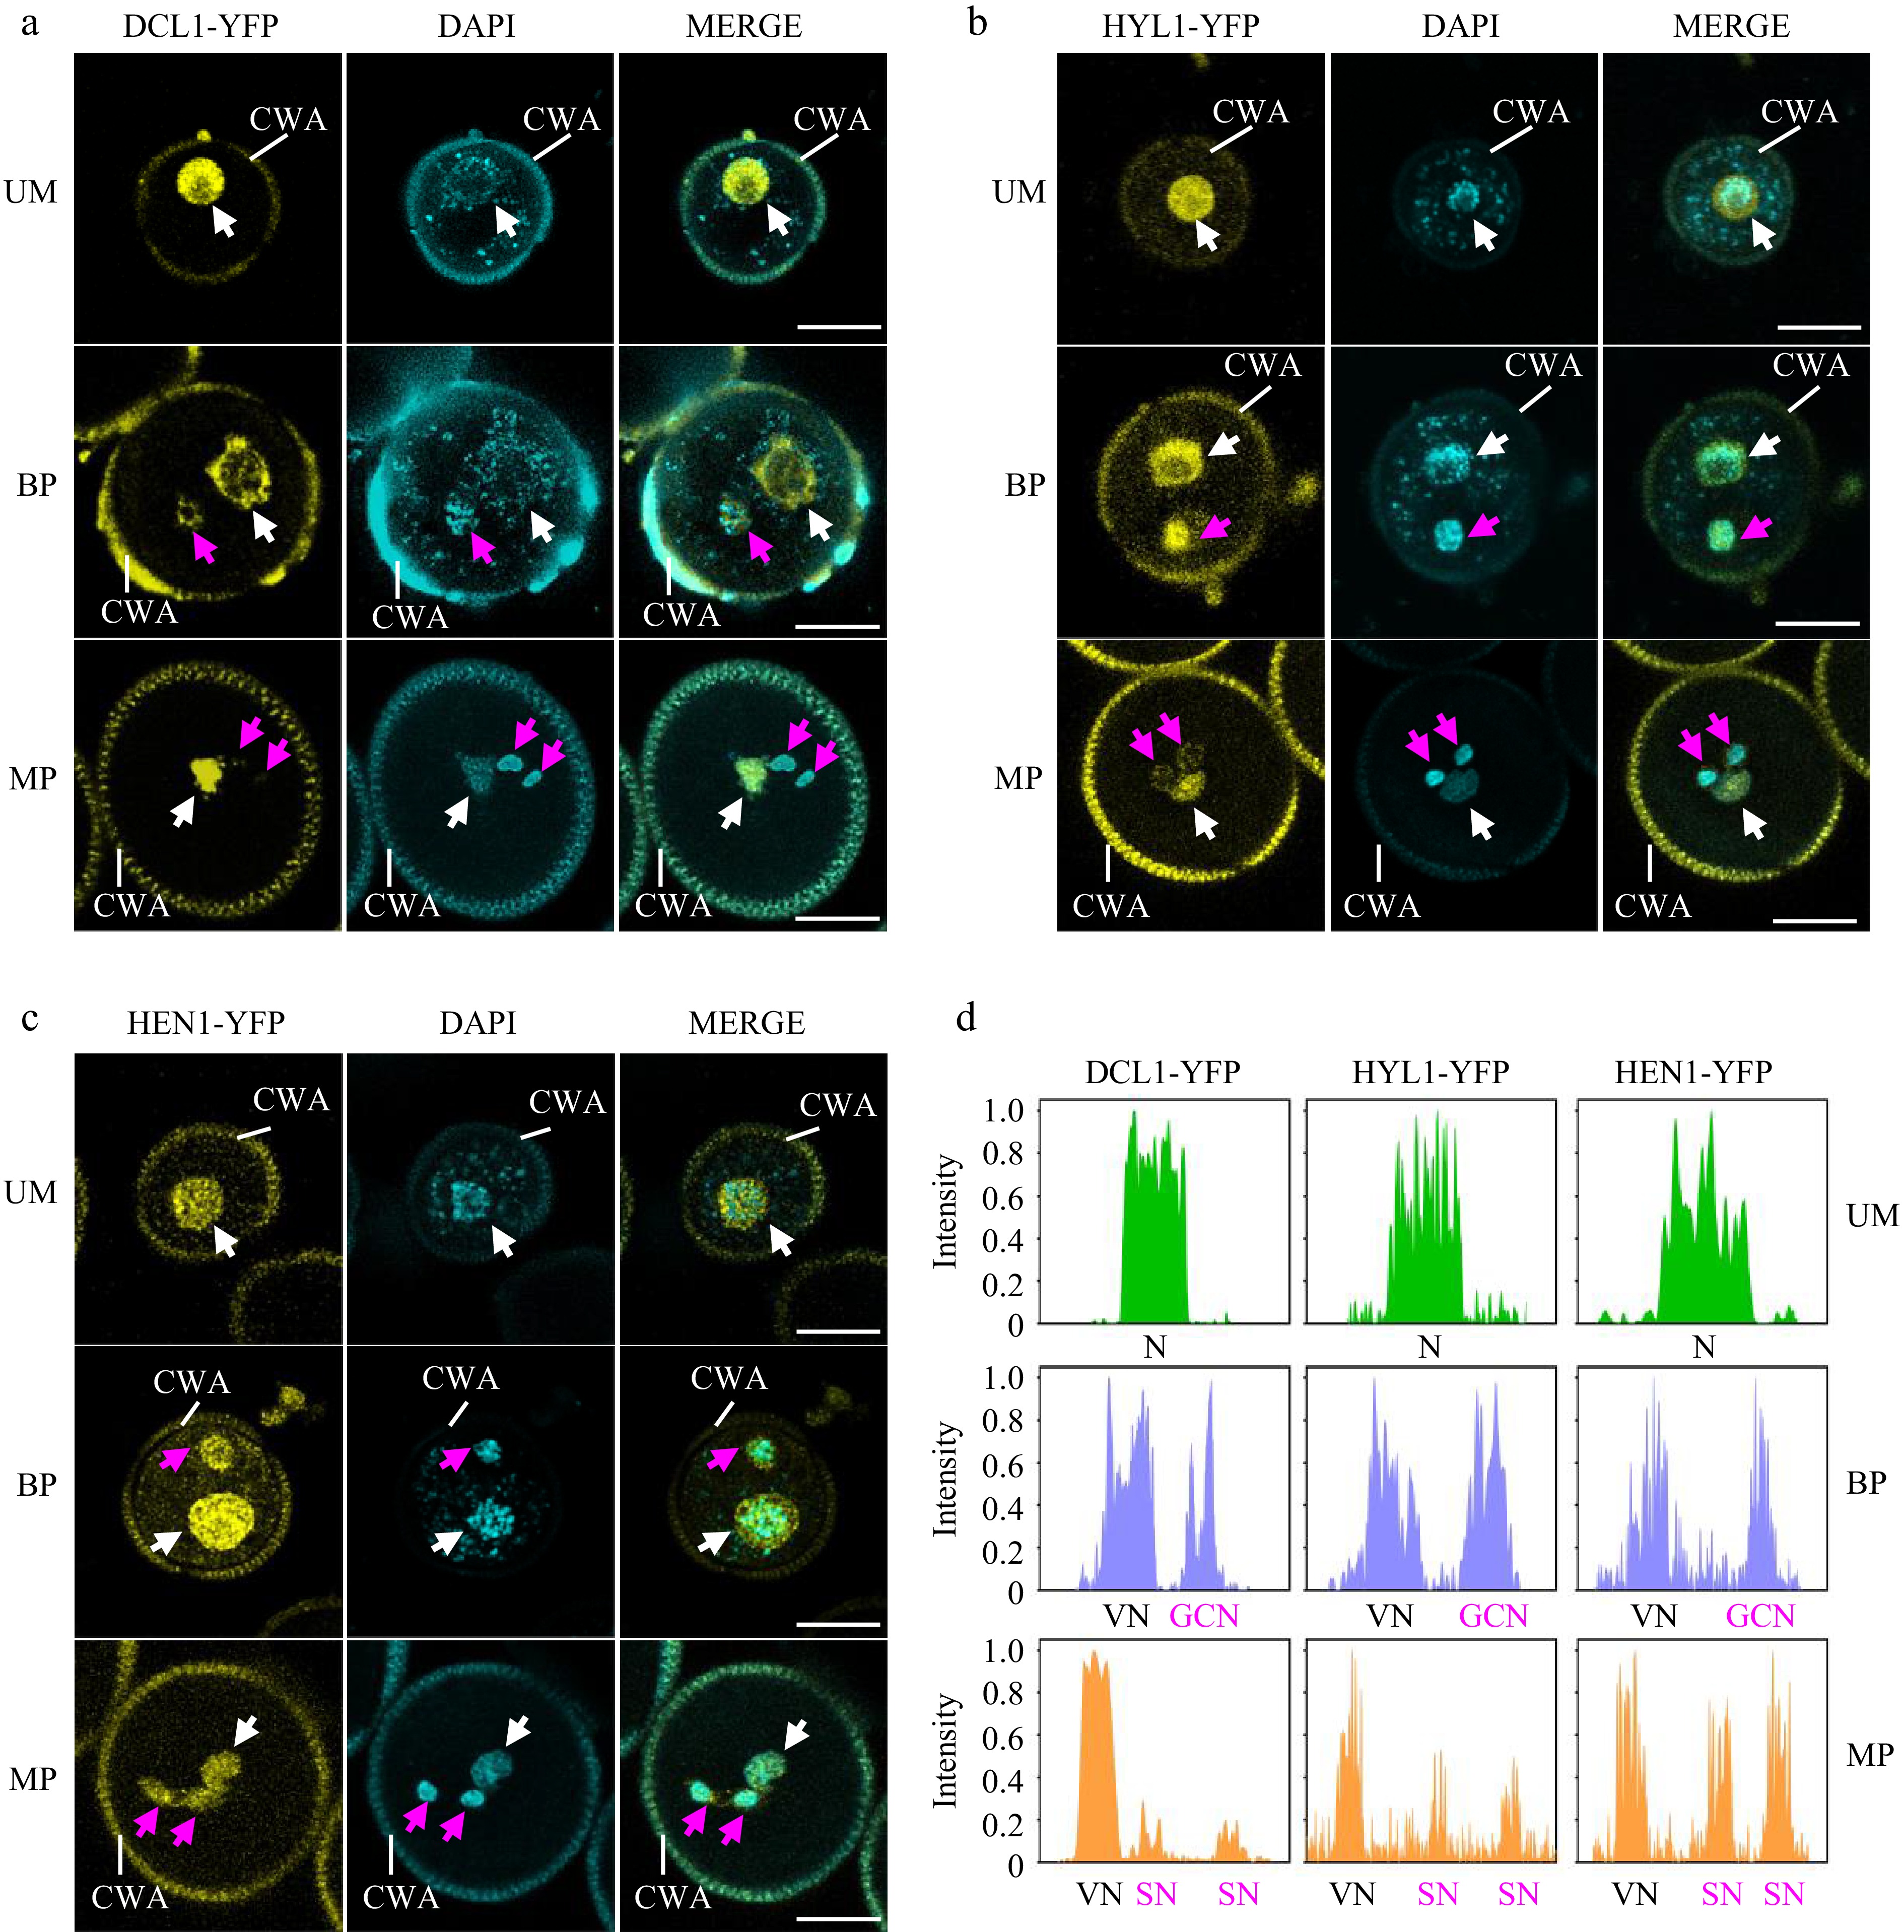
Figure 3.
Spatiotemporal patterns of miRNA biogenesis factors during pollen development. (a)−(c) The localization of (a) DCL1-YFP, (b) HYL1-YFP, and (c) HEN1-YFP was observed during pollen development by confocal microscopy. Representative pollen grains show YFP fluorescence (right, yellow) and DAPI fluorescence (right, cyan) at unicellular microspore (UM), bicellular pollen (BP), and mature pollen (MP) stages. White arrowhead indicates N or VN; magenta arrowhead indicates GCN or SN. VN, vegetative nucleus; GCN, generative cell nucleus, SN, sperm cell nuclei; CWA, cell wall autofluorescence. Scale bar = 10 μm. (d) Relative intensity curve of YFP signal in (a) DCL1-YFP, (b) HYL1-YFP, and (c) HEN1-YFP.
-

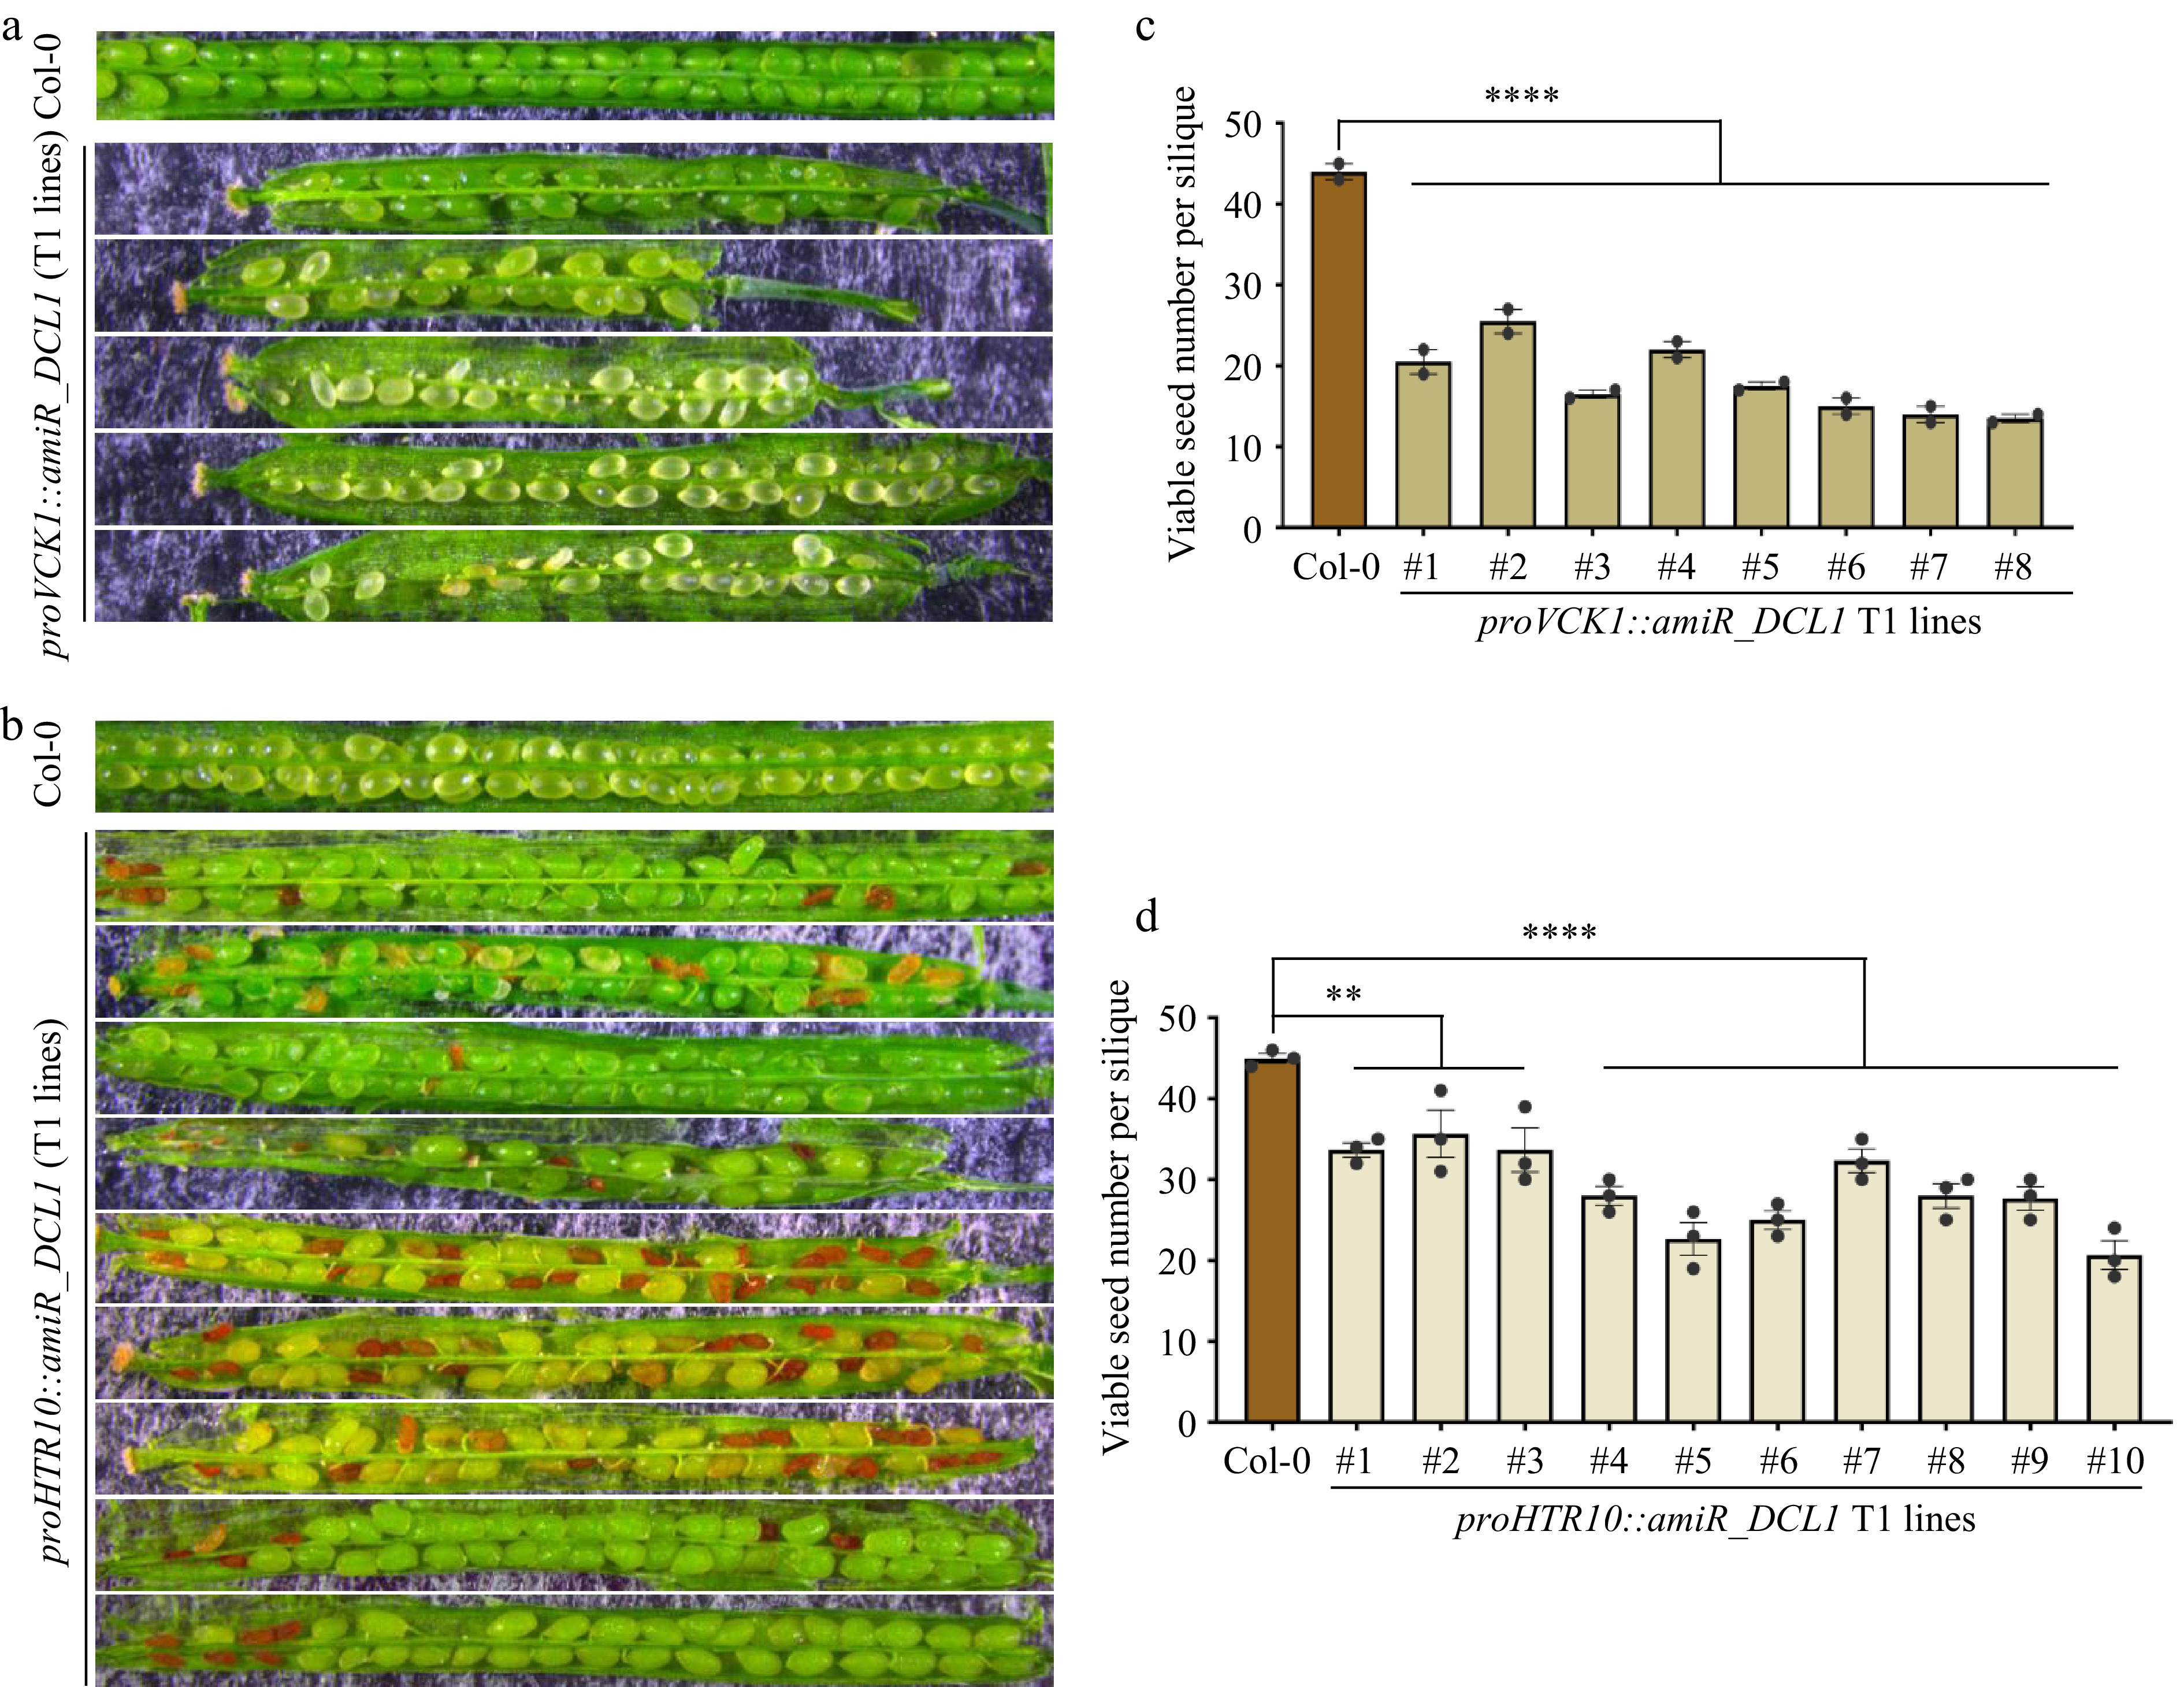
Figure 4.
Both VC and GC/SC-knockdown of DCL1 caused compromised but distinctive defects in seed development. (a) Seed development defects of proVCK1::amiR_DCL1 transgenic T1 lines, representative siliques are shown. (b) Seed development defects of proHTR10::amiR_DCL1 transgenic T1 lines, representative siliques are shown. (c), (d) Statistical analyses of viable seed number per silique in (c) proVCK1::amiR_DCL1, and (d) proHTR10::amiR_DCL1 transgenic T1 lines. Each column indicates one individual T1 line. p-values were calculated by one-way ANOVA Dunnett’s multiple comparison, ** p < 0.01, **** p < 0.0001.
Figures
(4)
Tables
(0)