-
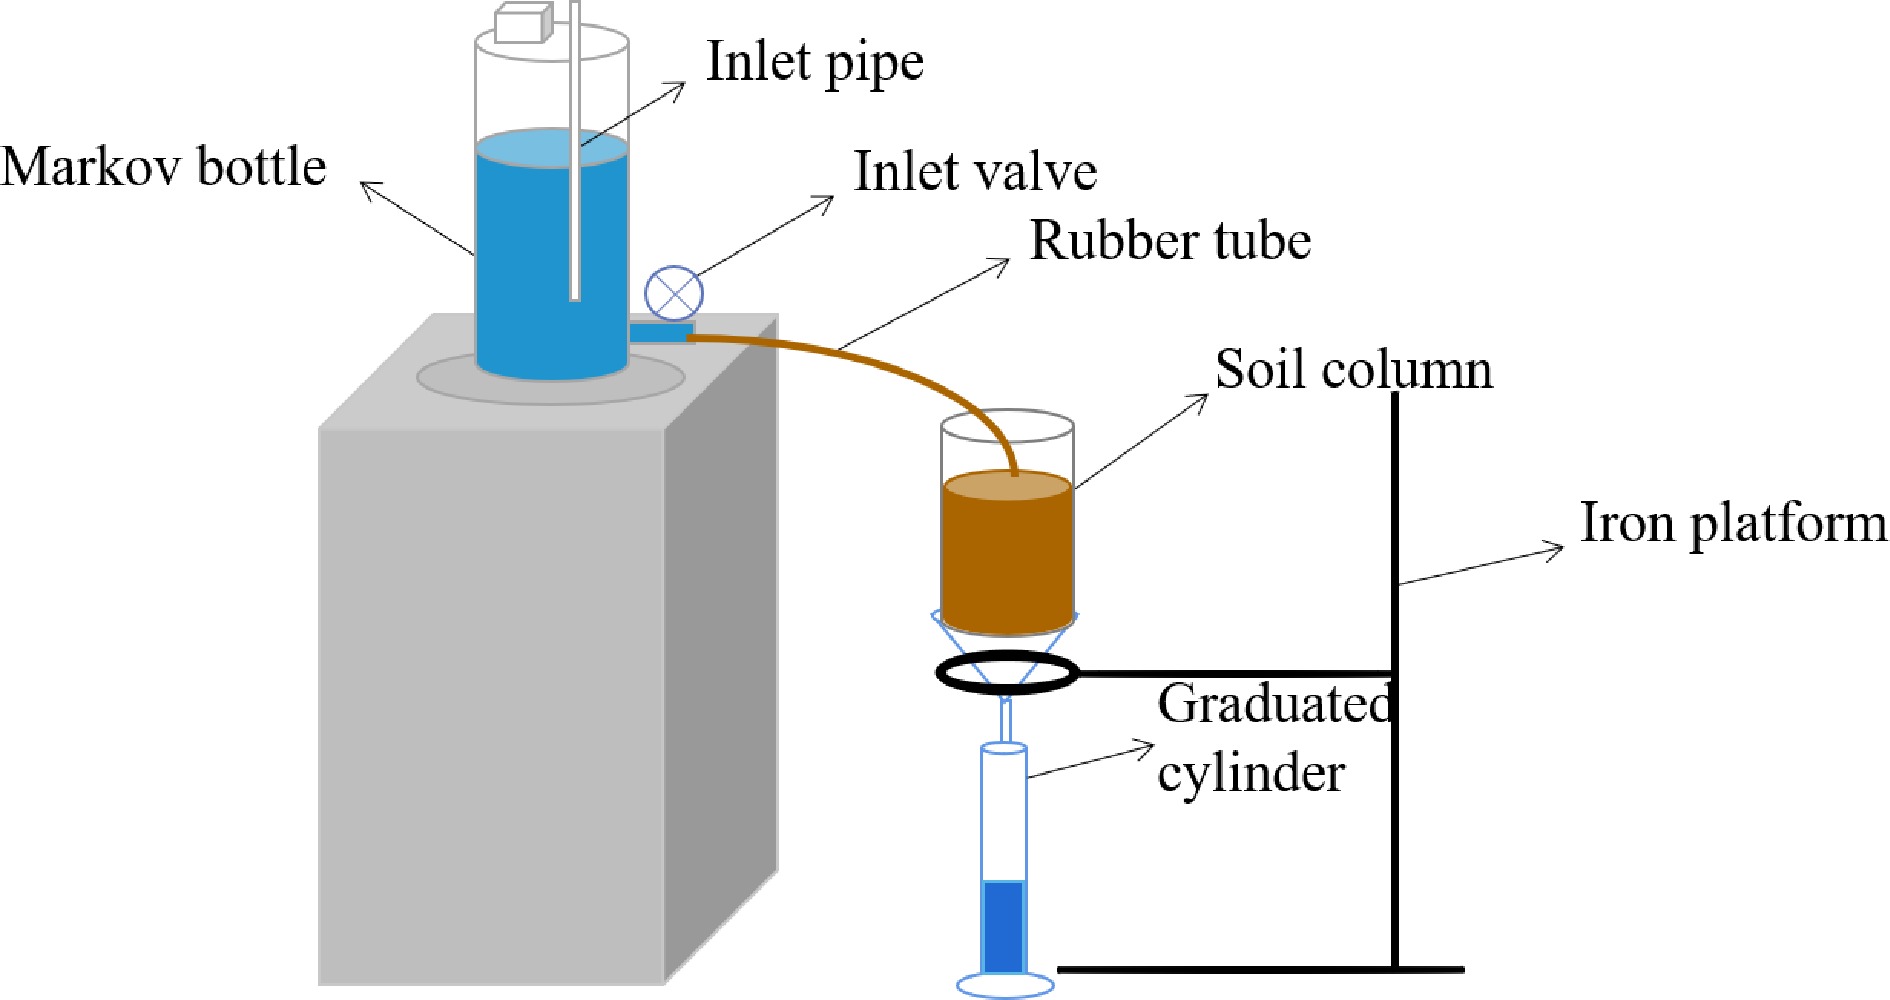
Figure 1.
Solute transport device.
-
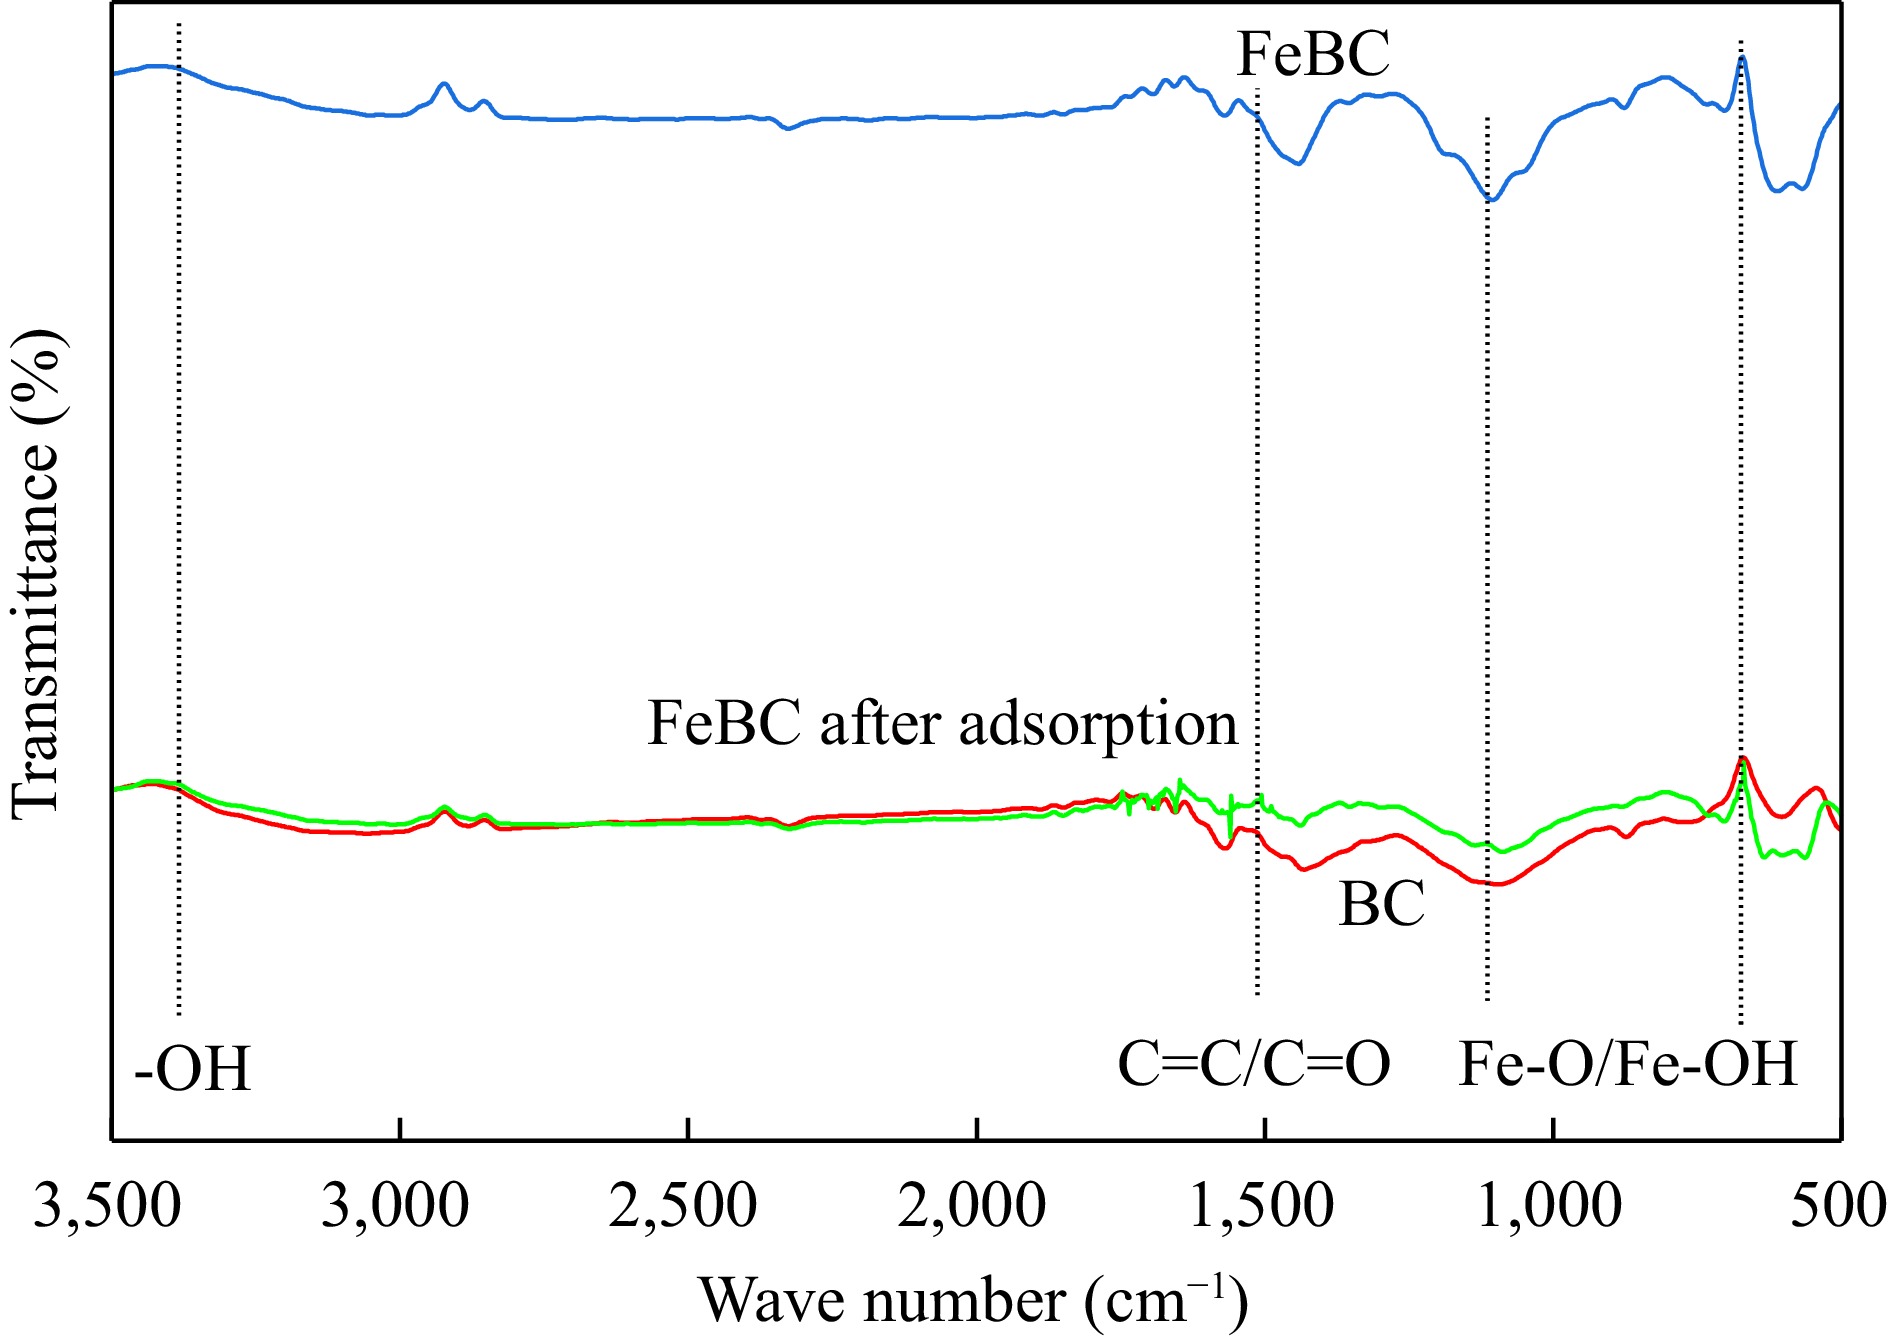
Figure 2.
FT-IR spectra of BC, FeBC, and FeBC after adsorption. BC represents biochar, FeBC represents iron-modified biochar without test, FeBC after adsorption represents iron-modified biochar adsorbed with heavy metals after test.
-
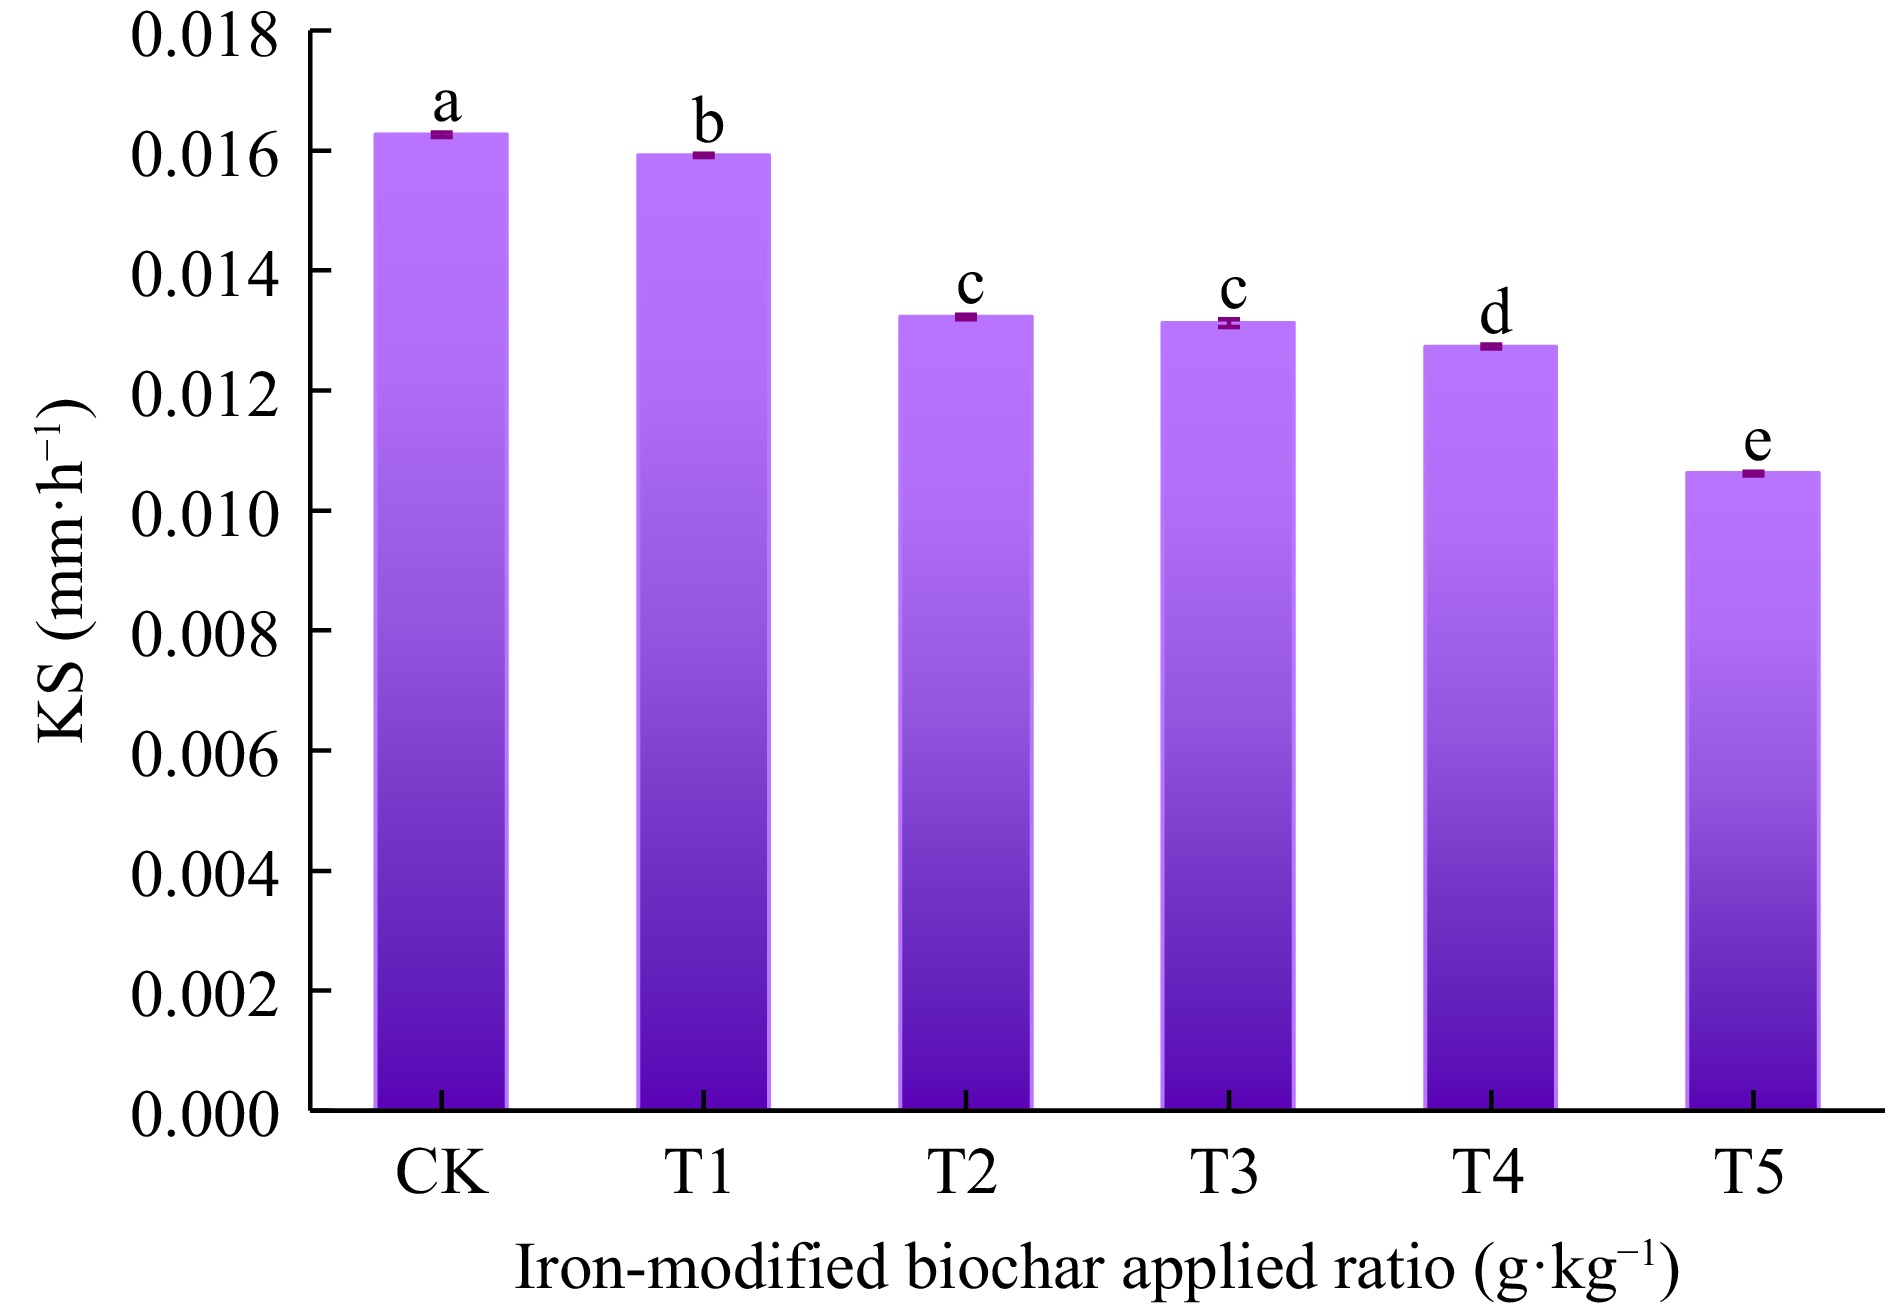
Figure 3.
The effect of iron-modified biochar on soil Ks. Different lowercase letters indicate significant difference between different treatments (p < 0.05).
-
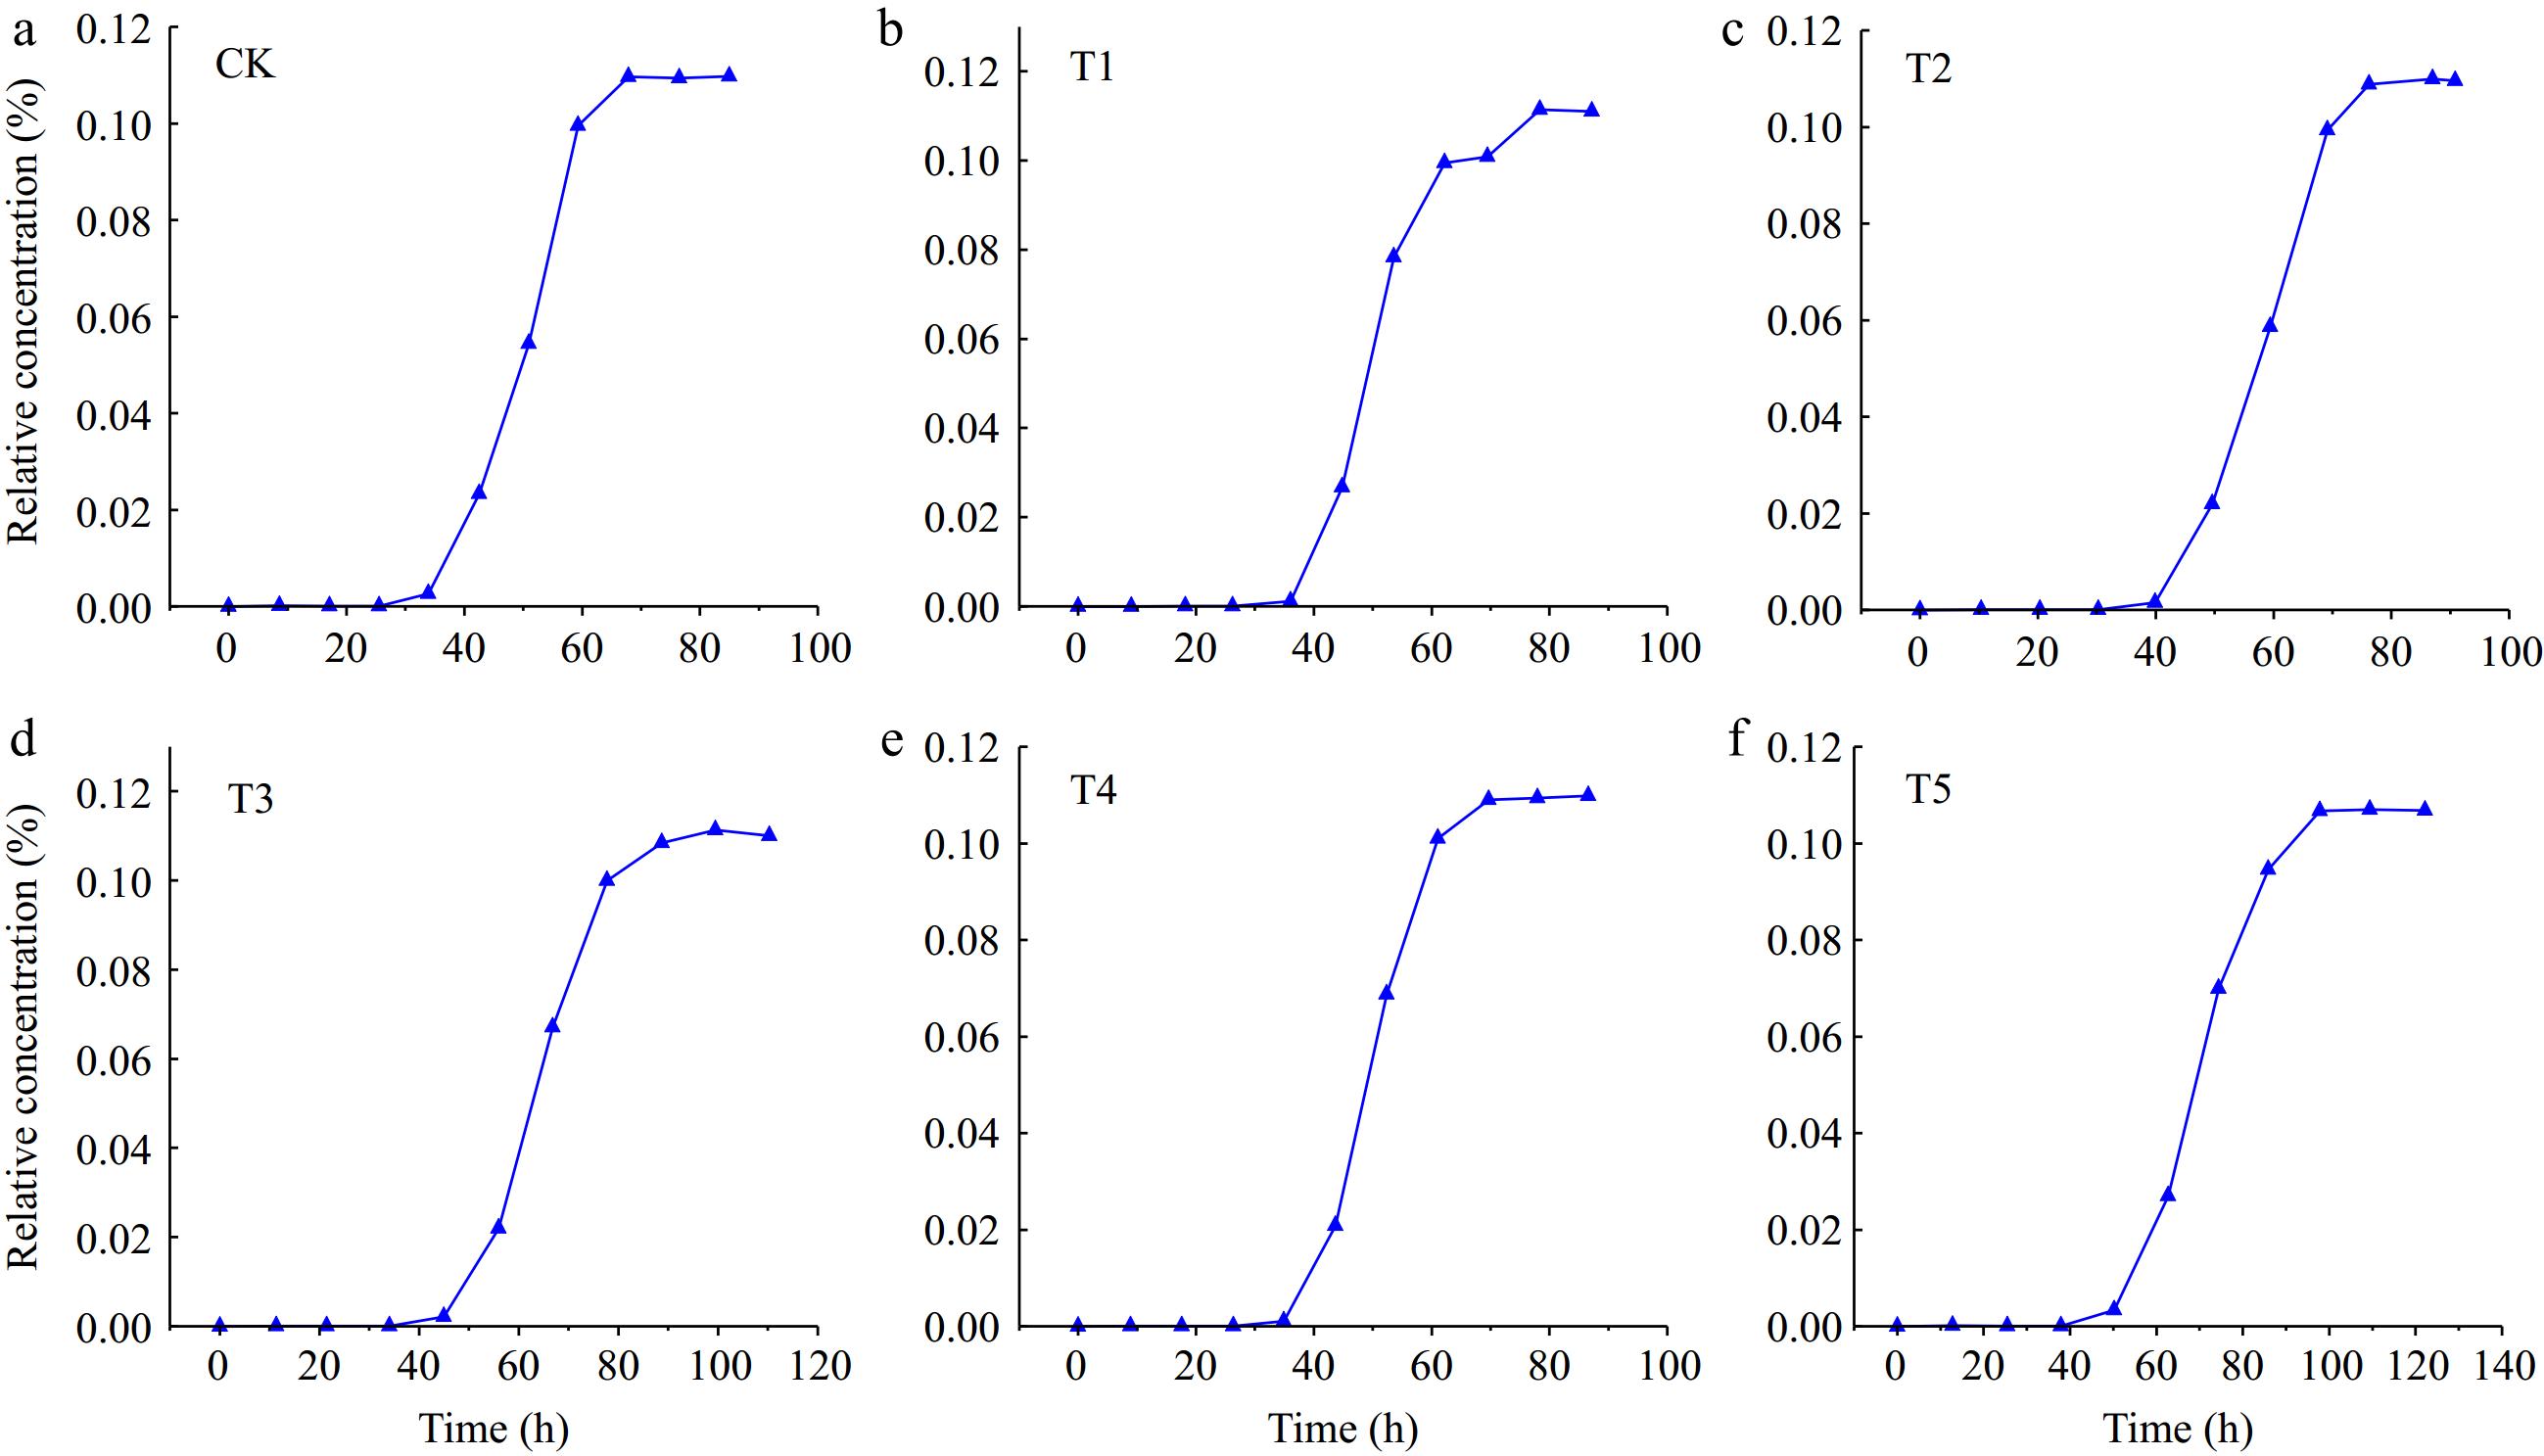
Figure 4.
The breakthrough curves of Cl− in loessal soil with different iron-modified biochar contents.
-
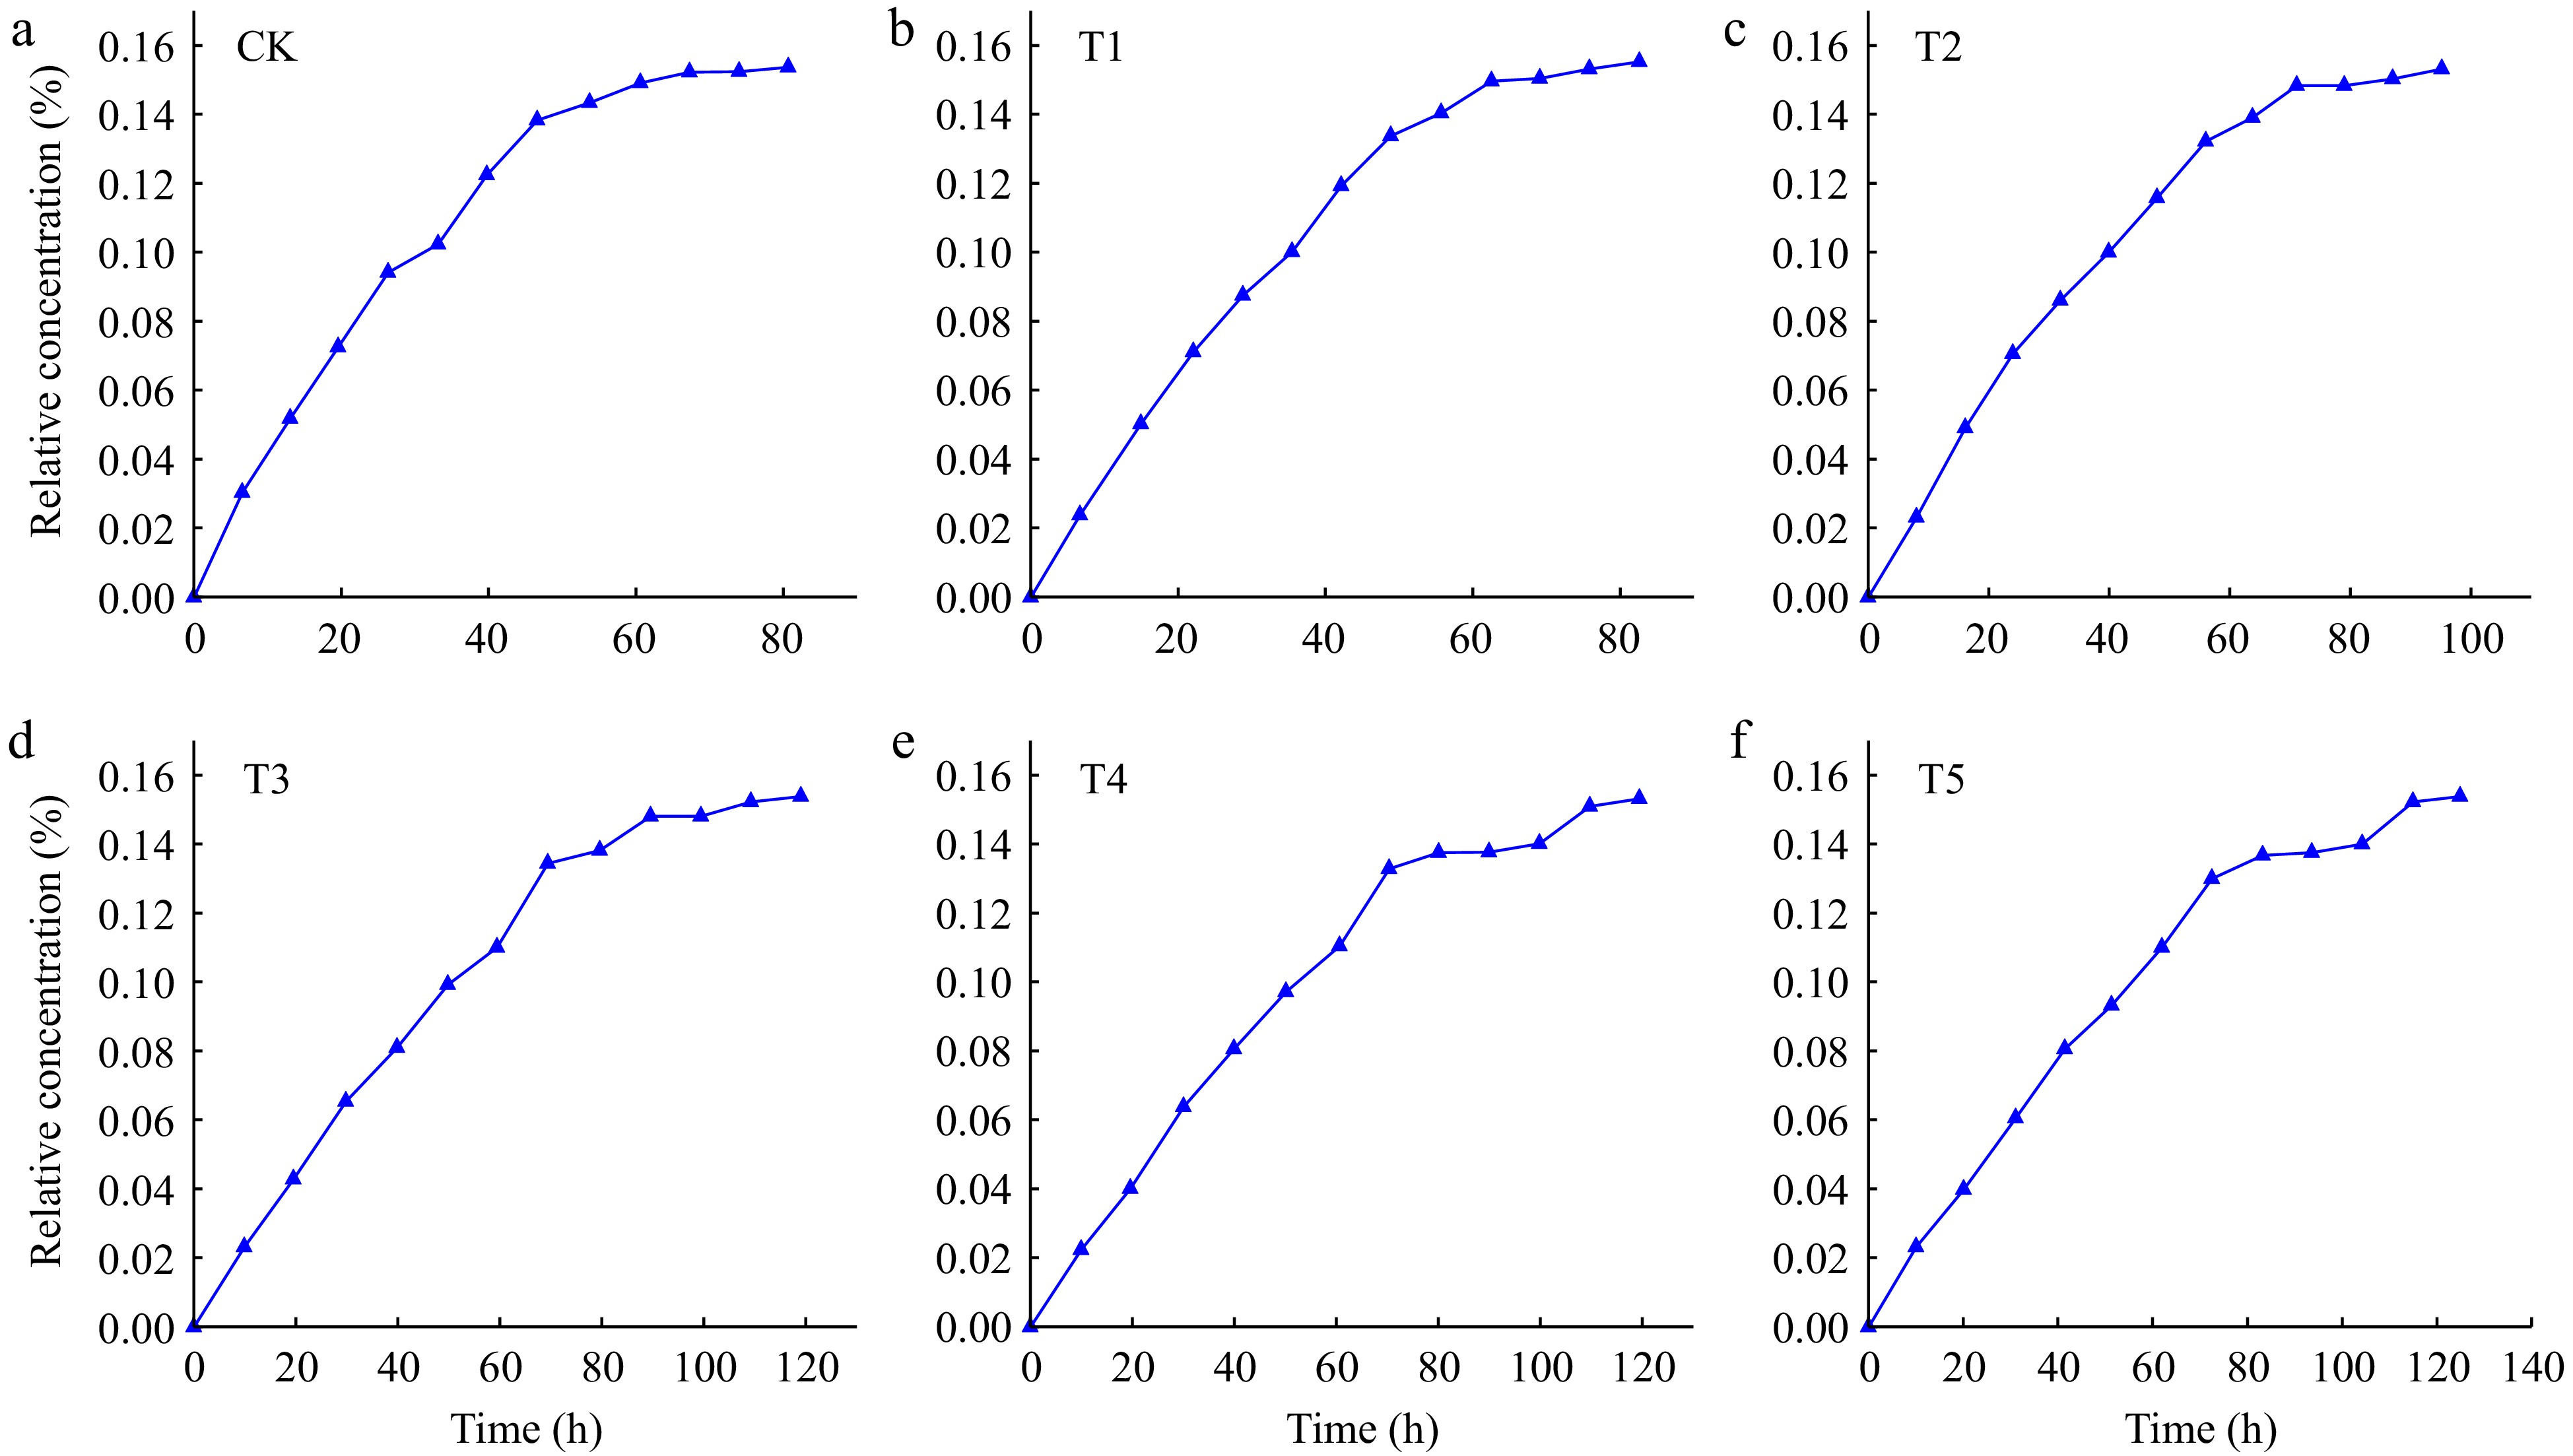
Figure 5.
Cd2+ breakthrough curves of iron-modified biochar in loessial soil.
-
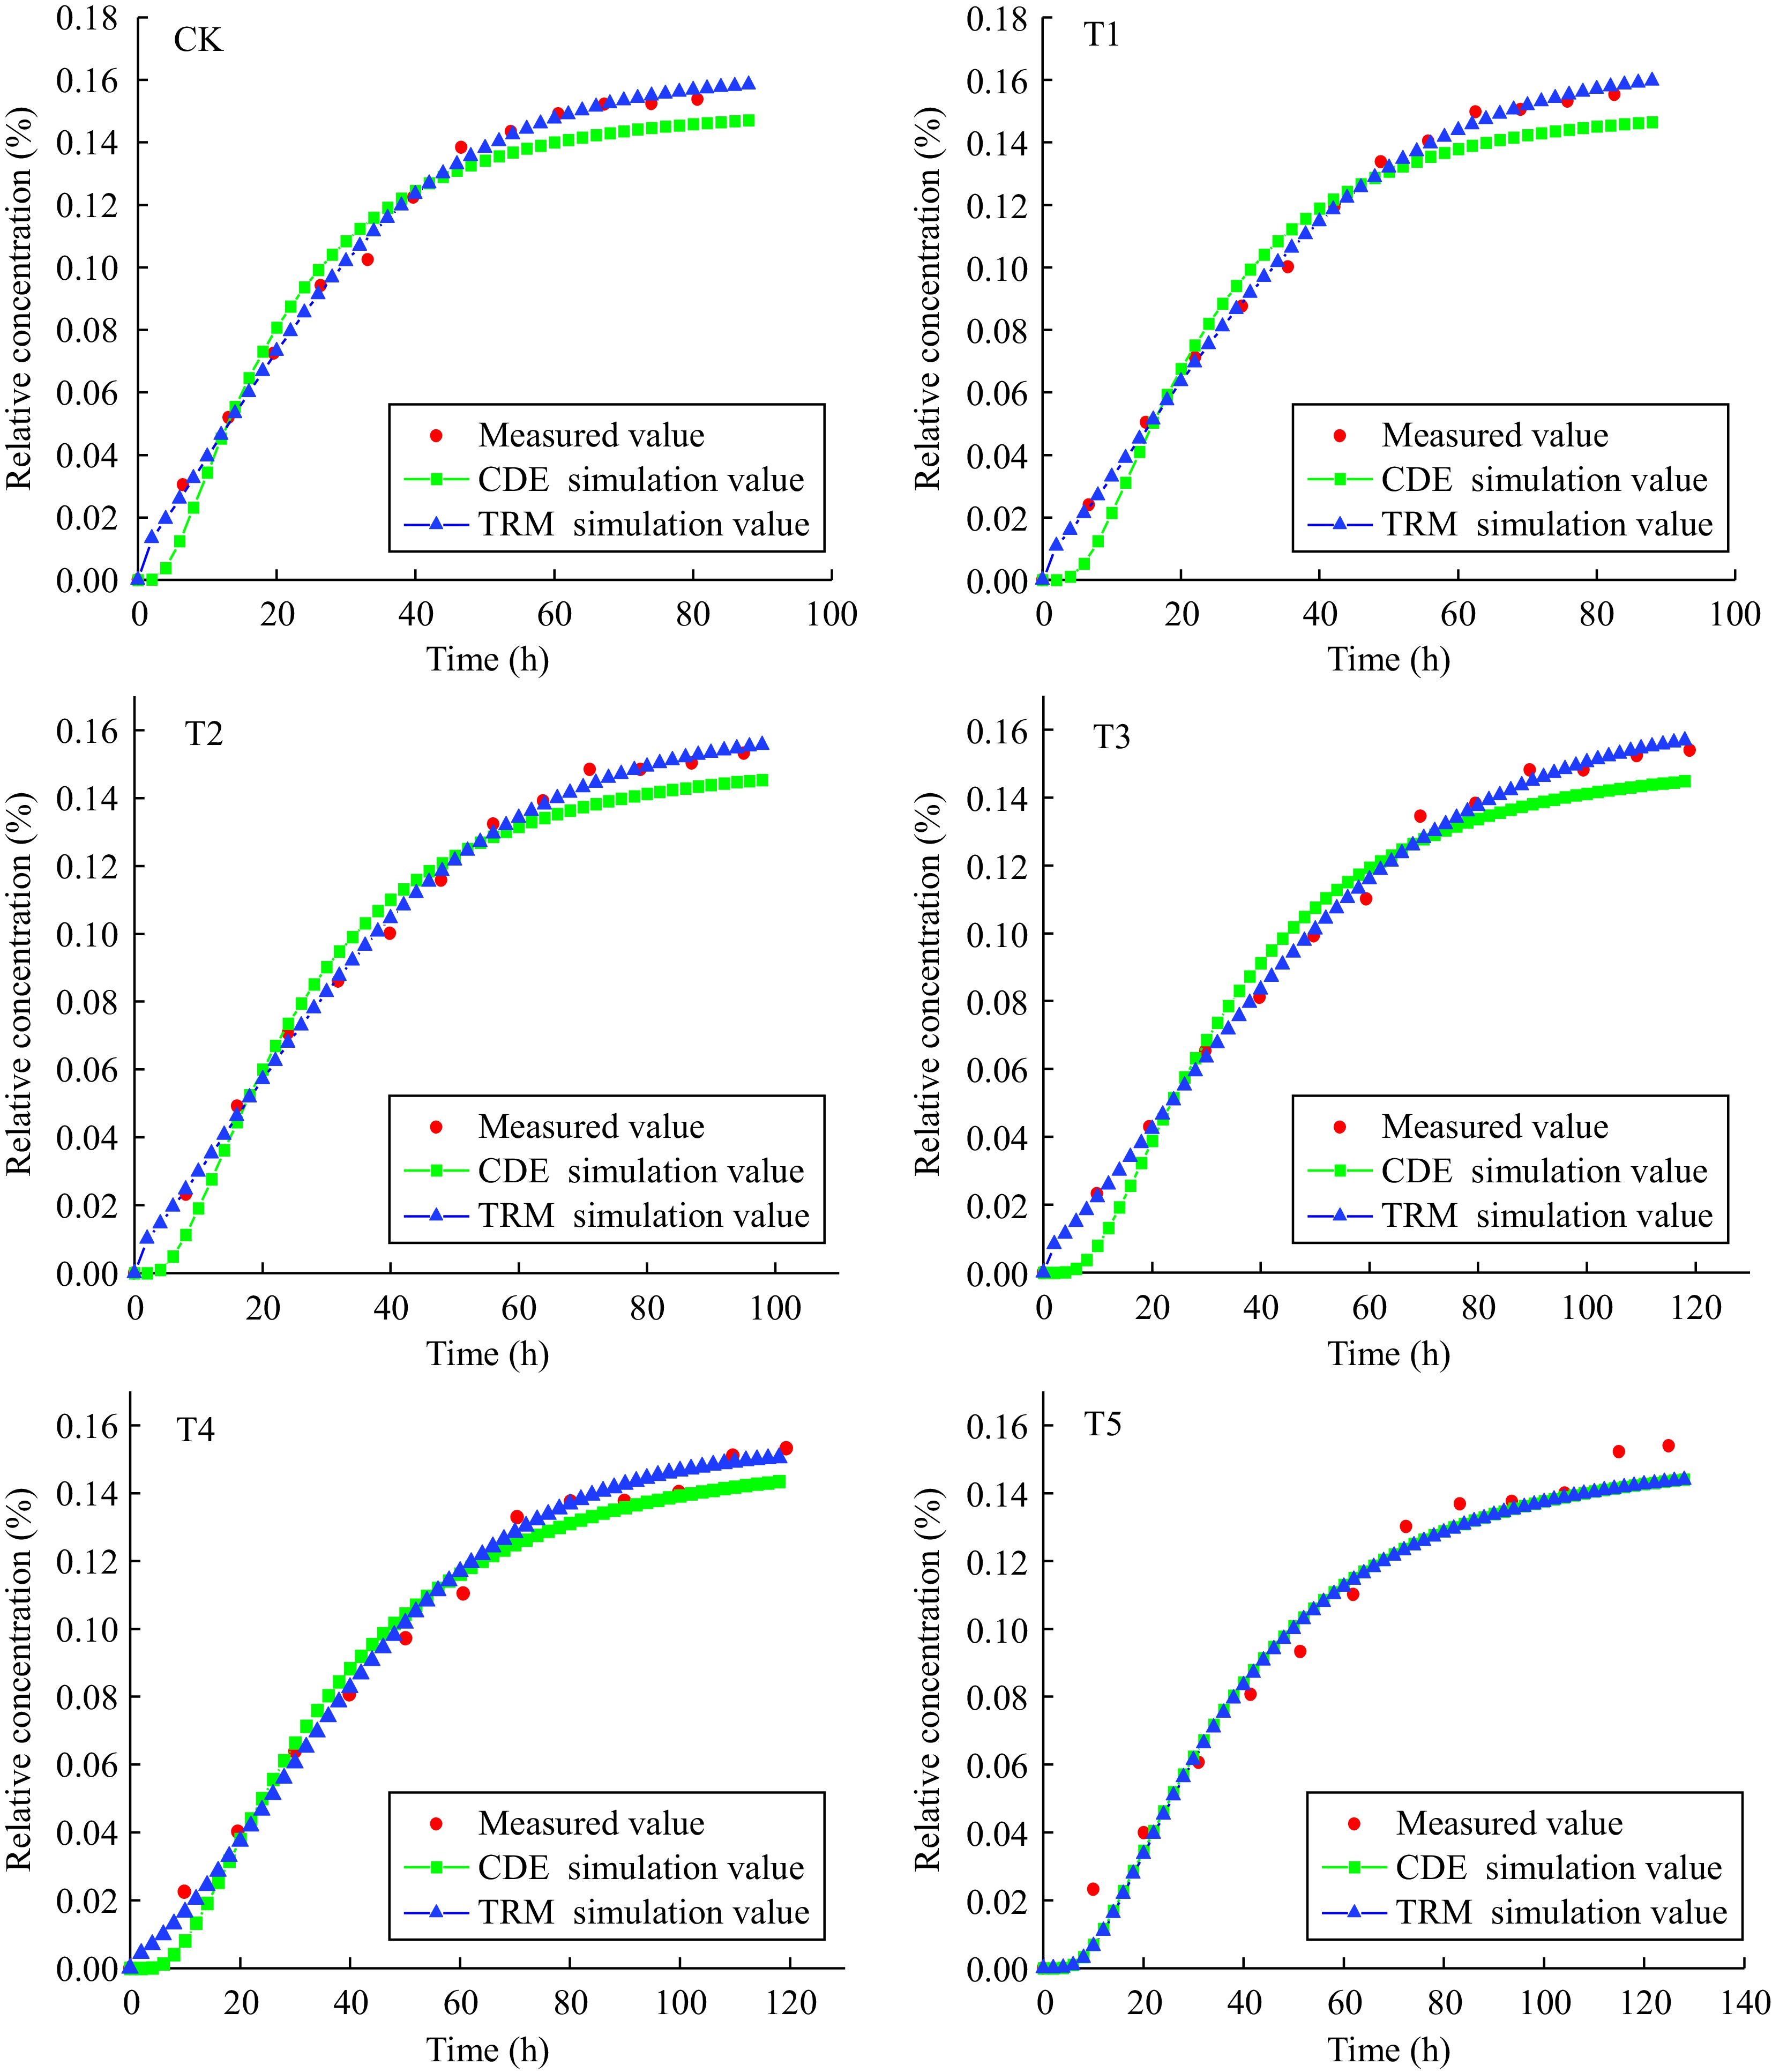
Figure 6.
Comparison of breakthrough curves of Cd2+ fitted by CDE and the TRM model.
-
Category Organic matter
(g·kg−1)Total nitrogen
(g·kg−1)pH Electrical conductivity
(uS·cm−1)Total potassium
(g·kg−1)Total phosphorus
(g·kg−1)Bulk density
(g·cm−3)Loessial soil 11.11 1.02 8.33 112.36 7.51 0.04 1.43 Table 1.
The physical and chemical properties of loessial soil.
-
Category Total carbon (%) Carbonization time (h) Carbonization temperature (°C) pH Ash content Pore size (> 2 mm) Fe Iron-modified biochar 55.63 1 600 7 22.86% 98.55% 23.02% Table 2.
The physical and chemical properties of iron-modified biochar.
-
Treatment Te (h) Ts (h) Tt (h) CK 8.57 84.95 76.38 T1 8.99 87.20 78.21 T2 10.35 98.82 88.47 T3 11.38 110.25 98.87 T4 12.16 115.59 77.75 T5 12.76 122.20 109.44 Te represents initial penetration time, Ts represents complete penetration time and Tt represents total penetration time. Table 3.
The transport time of Cl− under different iron-modified biochar addition amounts.
-
Parameters Model name CK T1 T2 T3 T4 T5 v (cm·h−1) CDE 0.376 0.329 0.264 0.227 0.201 0.135 TRM 0.308 0.307 0.266 0.241 0.217 0.203 D (cm2·h−1) CDE 0.100 0.100 0.100 0.100 0.100 0.224 TRM 0.575 0.100 0.100 0.100 0.100 0.174 λ CDE 0.266 0.304 0.379 0.441 0.498 0.741 TRM 0.286 0.326 0.375 0.415 0.406 0.857 β TRM 0.100 0.100 0.114 0.249 0.974 0.999 ω TRM 0.100 0.100 0.557 0.596 0.786 0.851 R2 CDE 0.887 0.944 0.906 0.929 0.938 0.927 TRM 0.980 0.990 0.985 0.994 0.994 0.999 RMSE CDE 0.326 0.364 0.272 0.249 0.235 0.201 TRM 0.306 0.287 0.241 0.230 0.222 0.134 v represents average pore water velocity, D represents hydrodynamic dispersion coefficient, λ represents the dispersion capacity of the solute in the pore medium, β represents the percentage of solute in the total soil concentration and in the mobile region under equilibrium conditions, ω represents parameter of the degree of solute exchange between movable and immovable regions, R2 represents coefficient of determination, RMSE represents the square root of the mean variance between the simulated value of the model and the measured value. Table 4.
The relevant model parameters obtained by Cl− transport curve fitting.
-
Treatment Te (h) Ts (h) Tt (h) CK 6.54 80.67 74.13 T1 6.70 82.62 75.92 T2 8.03 95.16 87.13 T3 9.86 118.97 109.11 T4 9.92 119.39 109.47 T5 10.00 124.94 114.94 Te represents initial penetration time, Ts represents complete penetration time, and Tt represents total penetration time. Table 5.
Transport time of Cd2+ under different iron-modified biochar amounts.
-
Parameters Model name CK T1 T2 T3 T4 T5 v (cm·h−1) CDE 0.882 0.723 0.659 0.489 0.478 0.452 TRM 0.557 0.476 0.433 0.384 0.354 0.307 D (cm2·h−1) CDE 0.602 0.212 0.409 0.264 0.281 0.265 TRM 0.140 0.120 0.108 0.118 0.274 0.220 λ CDE 0.293 0.540 0.586 0.588 0.621 0.683 TRM 0.251 0.252 0.249 0.307 0.717 0.774 β TRM 0.100 0.100 0.100 0.100 0.248 0.845 ω TRM 0.200 0.214 0.201 0.224 0.278 0.785 R2 CDE 0.997 0.972 0.979 0.973 0.979 0.976 TRM 0.997 0.998 0.998 0.996 0.993 0.976 RMSE CDE 0.770 0.835 0.619 0.828 0.602 0.691 TRM 0.114 0.781 0.580 0.134 0.246 0.350 v represents average pore water velocity, D represents hydrodynamic dispersion coefficient, λ represents the dispersion capacity of the solute in the pore medium, β represents the percentage of solute in the total soil concentration and in the mobile region under equilibrium conditions, ω represents parameter of the degree of solute exchange between movable and immovable regions, R2 represents coefficient of determination, RMSE represents the square root of the mean variance between the simulated value of the model and the measured value. Table 6.
The relevant model parameters obtained by Cd2+ transport curve fitting.
Figures
(6)
Tables
(6)