-

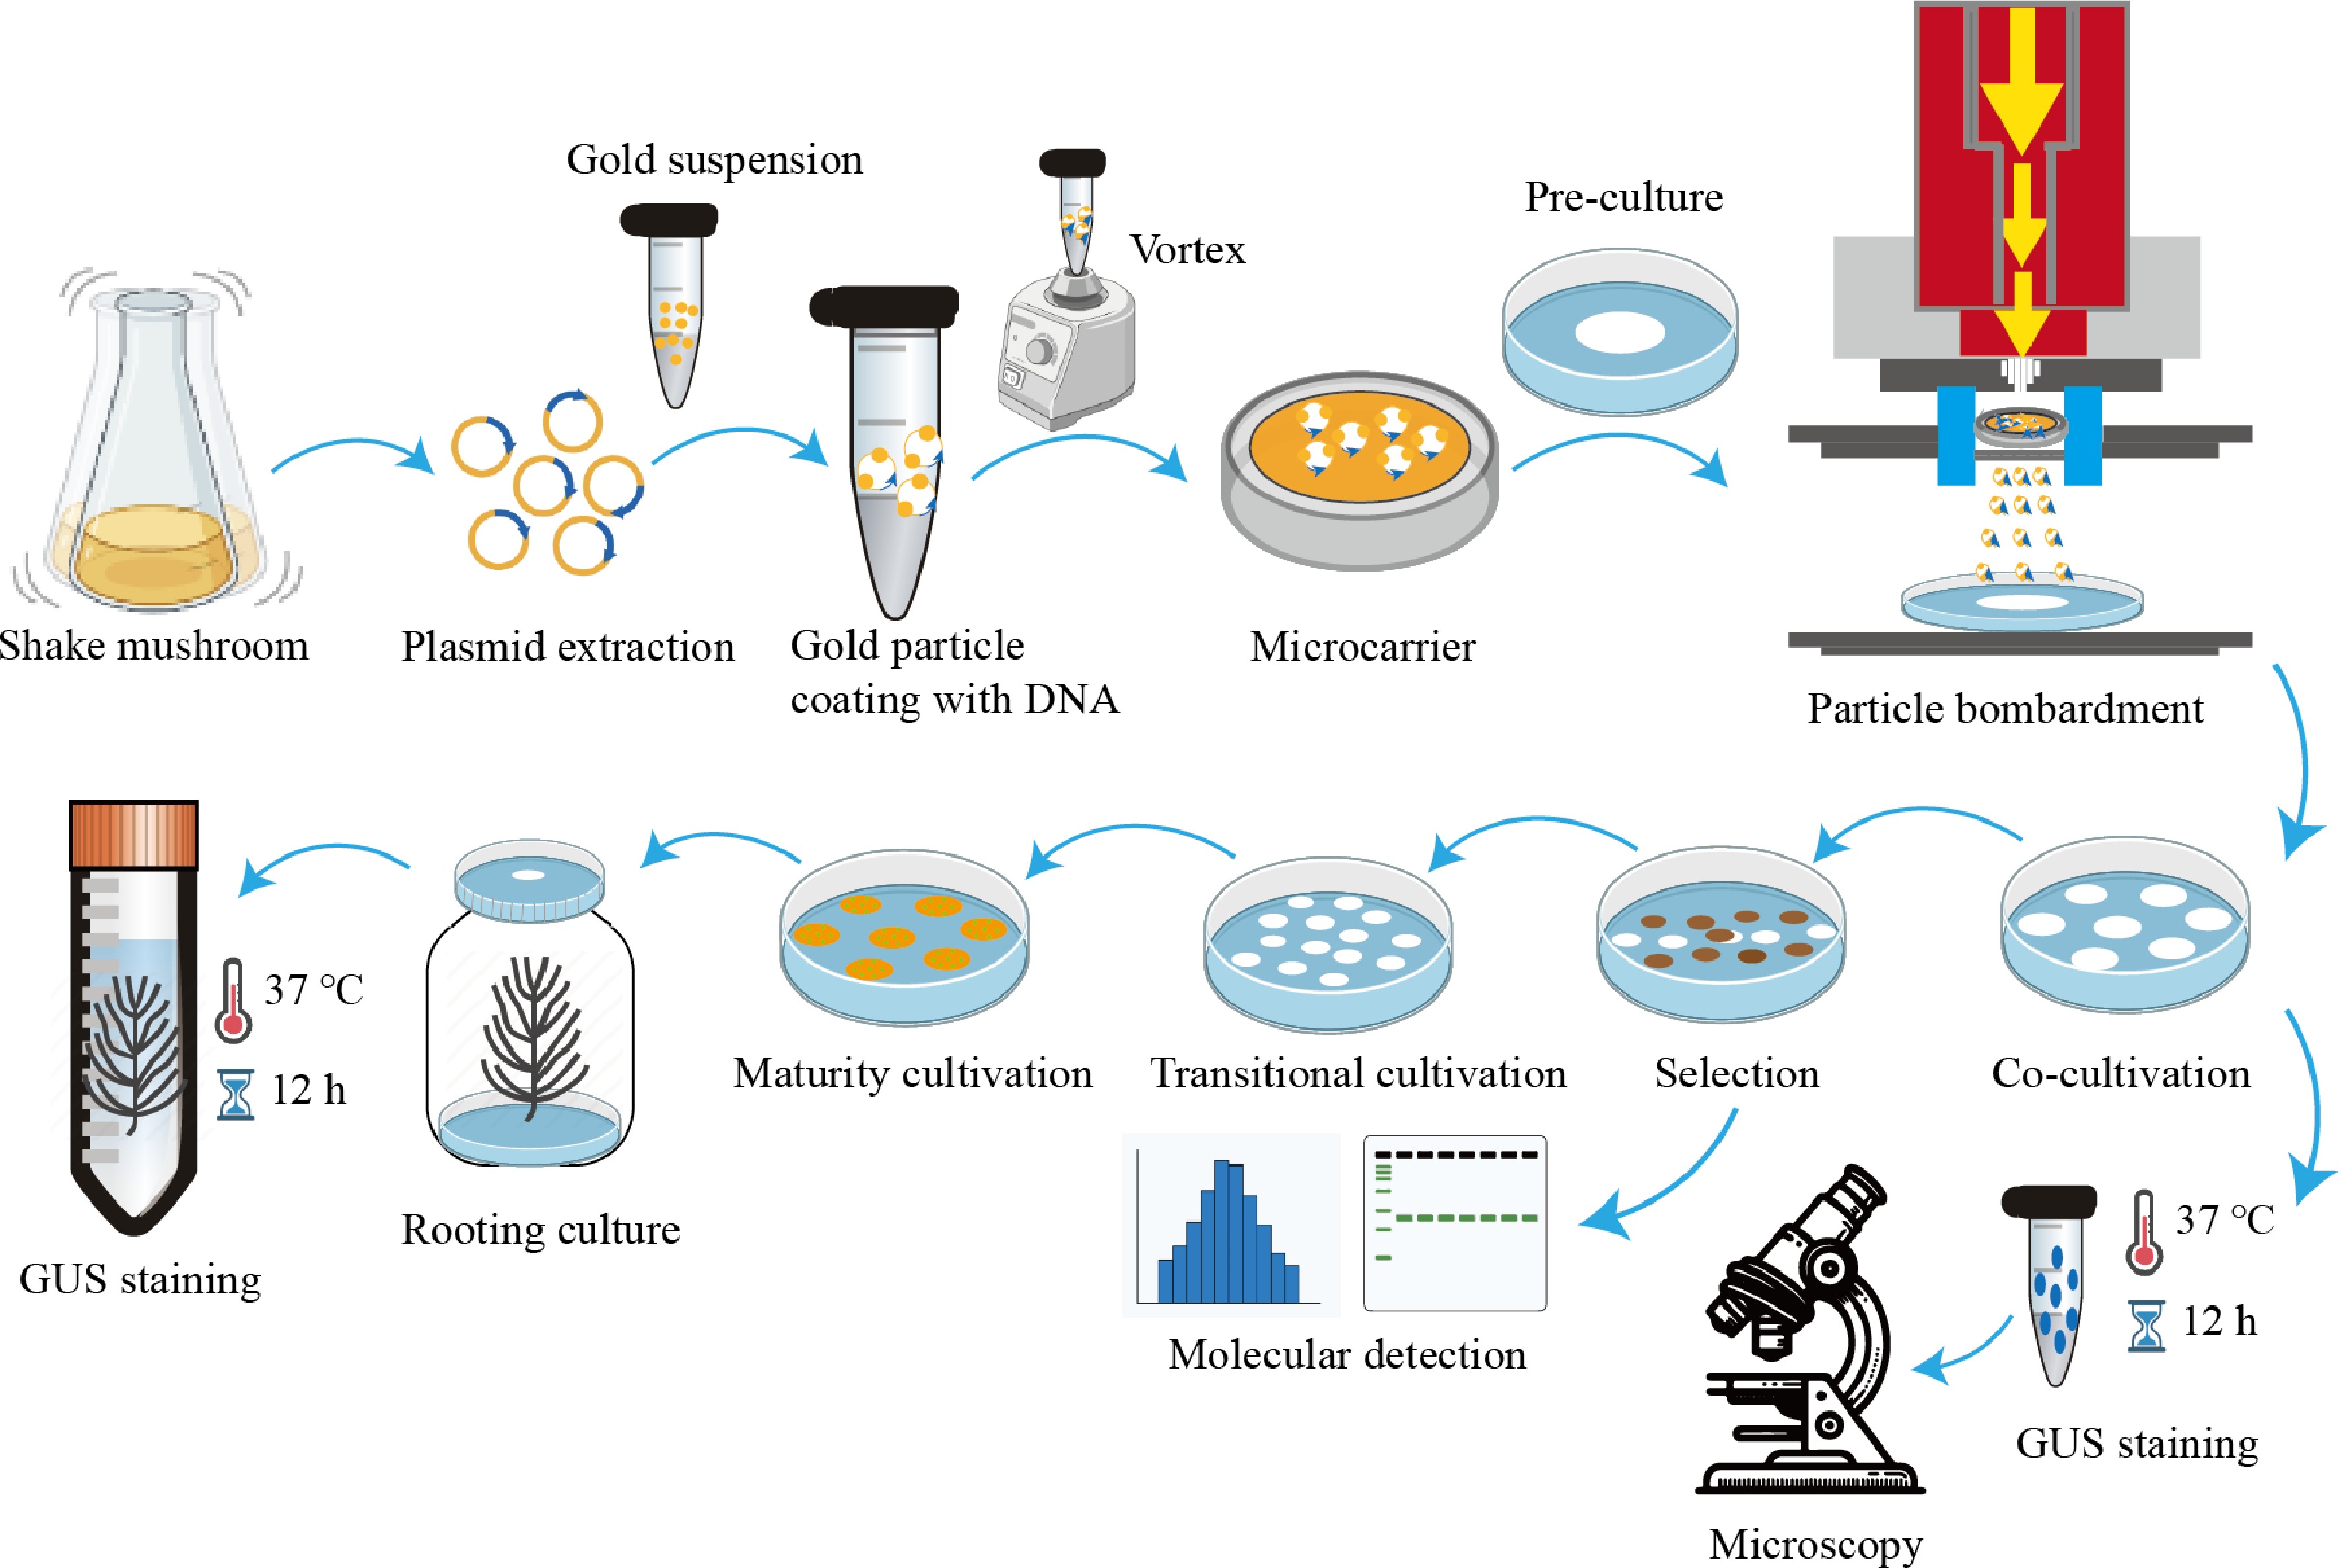
Figure 1.
The flowchart for determining optimal particle bombardment parameters.
-

Figure 2.
Transformation experiment results via particle bombardment. (a) Pre-culture before particle bombardment; (b) Subculture after particle bombardment; (c) Hygromycin-resistant embryogenic callus shown visually; (d) Induction of somatic embryos, (a)−(d) bar =1.5 cm. (e) Histochemical staining for GUS expression after particle bombardment under various parameters in embryogenic callus, bar = 50 μm; (f) The statistical analysis of GUS blue spot numbers under various particle bombardment parameters. Mean ± standard deviation, n = 3 (ANOVA; p ≤ 0.05); (g) The number of hygromycin-resistant callus under different parameters (The total sum of all hygromycin-resistant callus tissues in six replicates under each parameter. P1: 900 psi and 9 cm, P2: 900 psi and 12 cm, P3: 900 psi and 15 cm, P4: 1100 psi and 9 cm, P5: 1,100 psi and 12 cm, P6: 1,100 psi and 15 cm, P7: 1,350 psi and 9 cm, P8: 1,350 psi and 12 cm, P9: 1,350 psi and 15 cm). (h) Polymerase chain reaction (PCR) analysis of the ß-glucuronidase (GUS) gene (700 bp) at DNA levels in transgenic lines subjected to the parameters 1,100 psi and 9 cm; (i) Quantitative real-time (qRT)-PCR quantification of GUS gene expression levels under the parameters 1,100 psi and 9 cm, with wild-type (WT) as the negative control. Lines 1−13 denote transgenic lines of embryogenic callus. Data are represented as the mean from a minimum of three replicates. Different letters (a−g) above the column chart indicate statistically significant differences determined by an ANOVA test. Mean ± SD, n = 3. (ANOVA test; p ≤ 0.05).
-

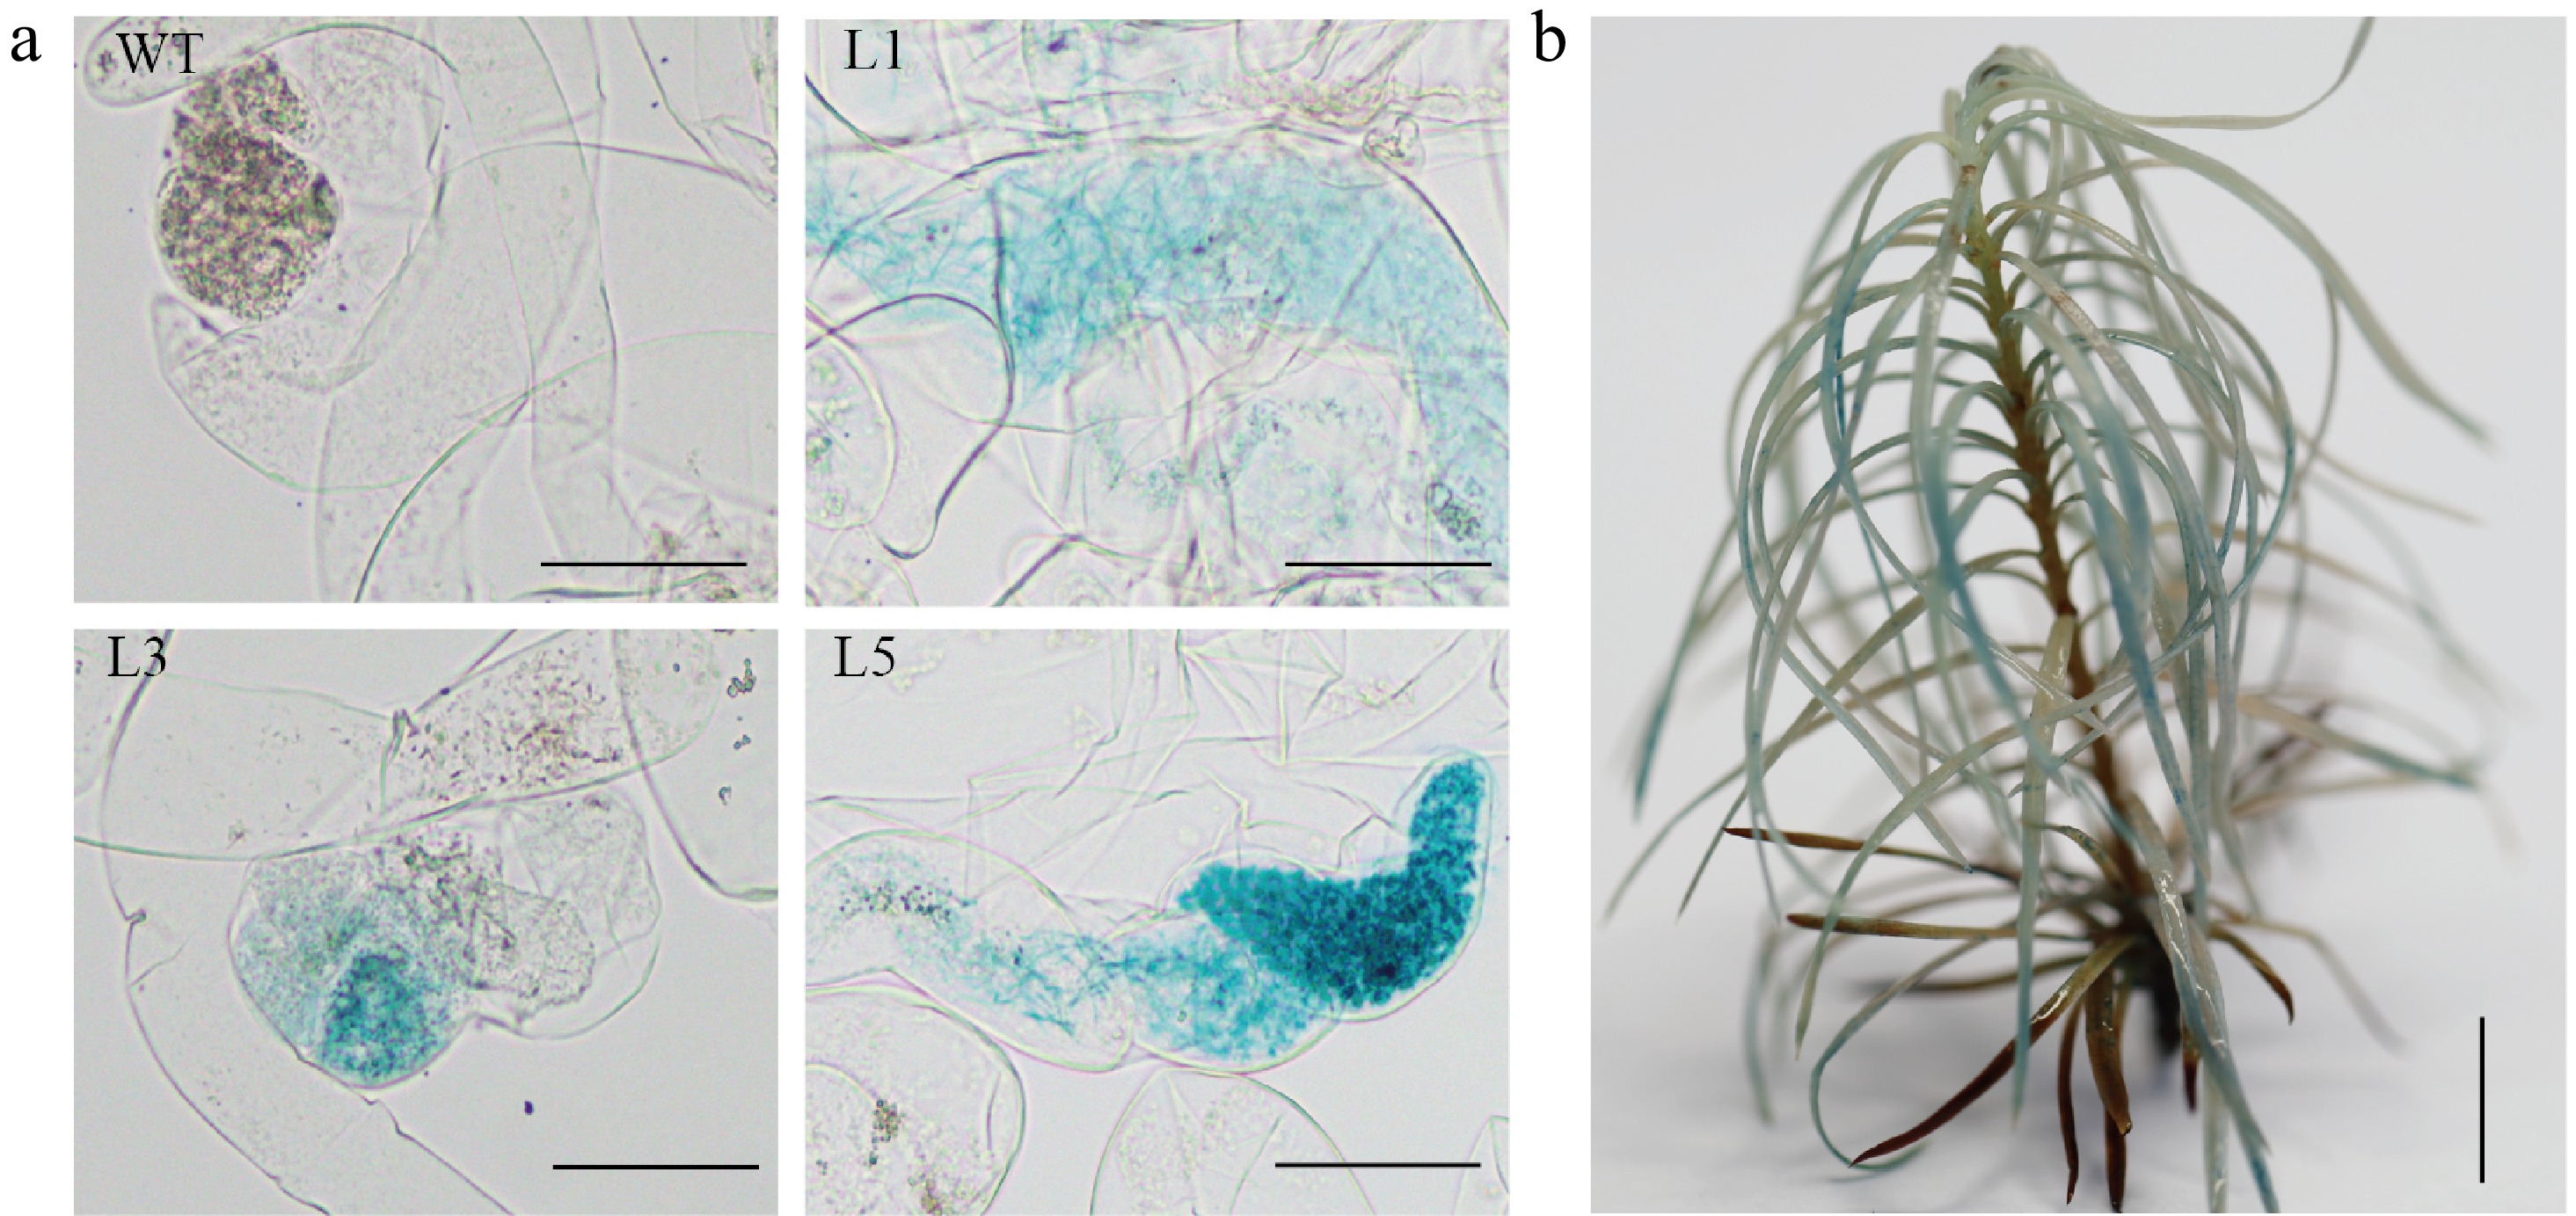
Figure 3.
Histochemical staining for ß-glucuronidase (GUS) activity in the transgenic embryogenic callus and the transgenic plant. (a) Histochemical staining for GUS activity in WT and transgenic embryogenic callus (L1, L3 and L5 represent different lines), Scale bar = 100 μm; (b) Histochemical staining for GUS activity in regenerated plants, Scale bar = 2 cm.
-

Figure 4.
In vitro validation process for five target sites. (a) Cloning of the LkPDS gene. M, DL2000 marker; (b) Detection of the recombinant vector. M, DL2000 marker; (c) Linearized recombinant vector. M, DL15000 marker; (d) In vitro validation results. 1−5: represent five specific targets; Negative control: N1: gRNA(-), N2: Cas9(-); M, DL2000 marker.
-

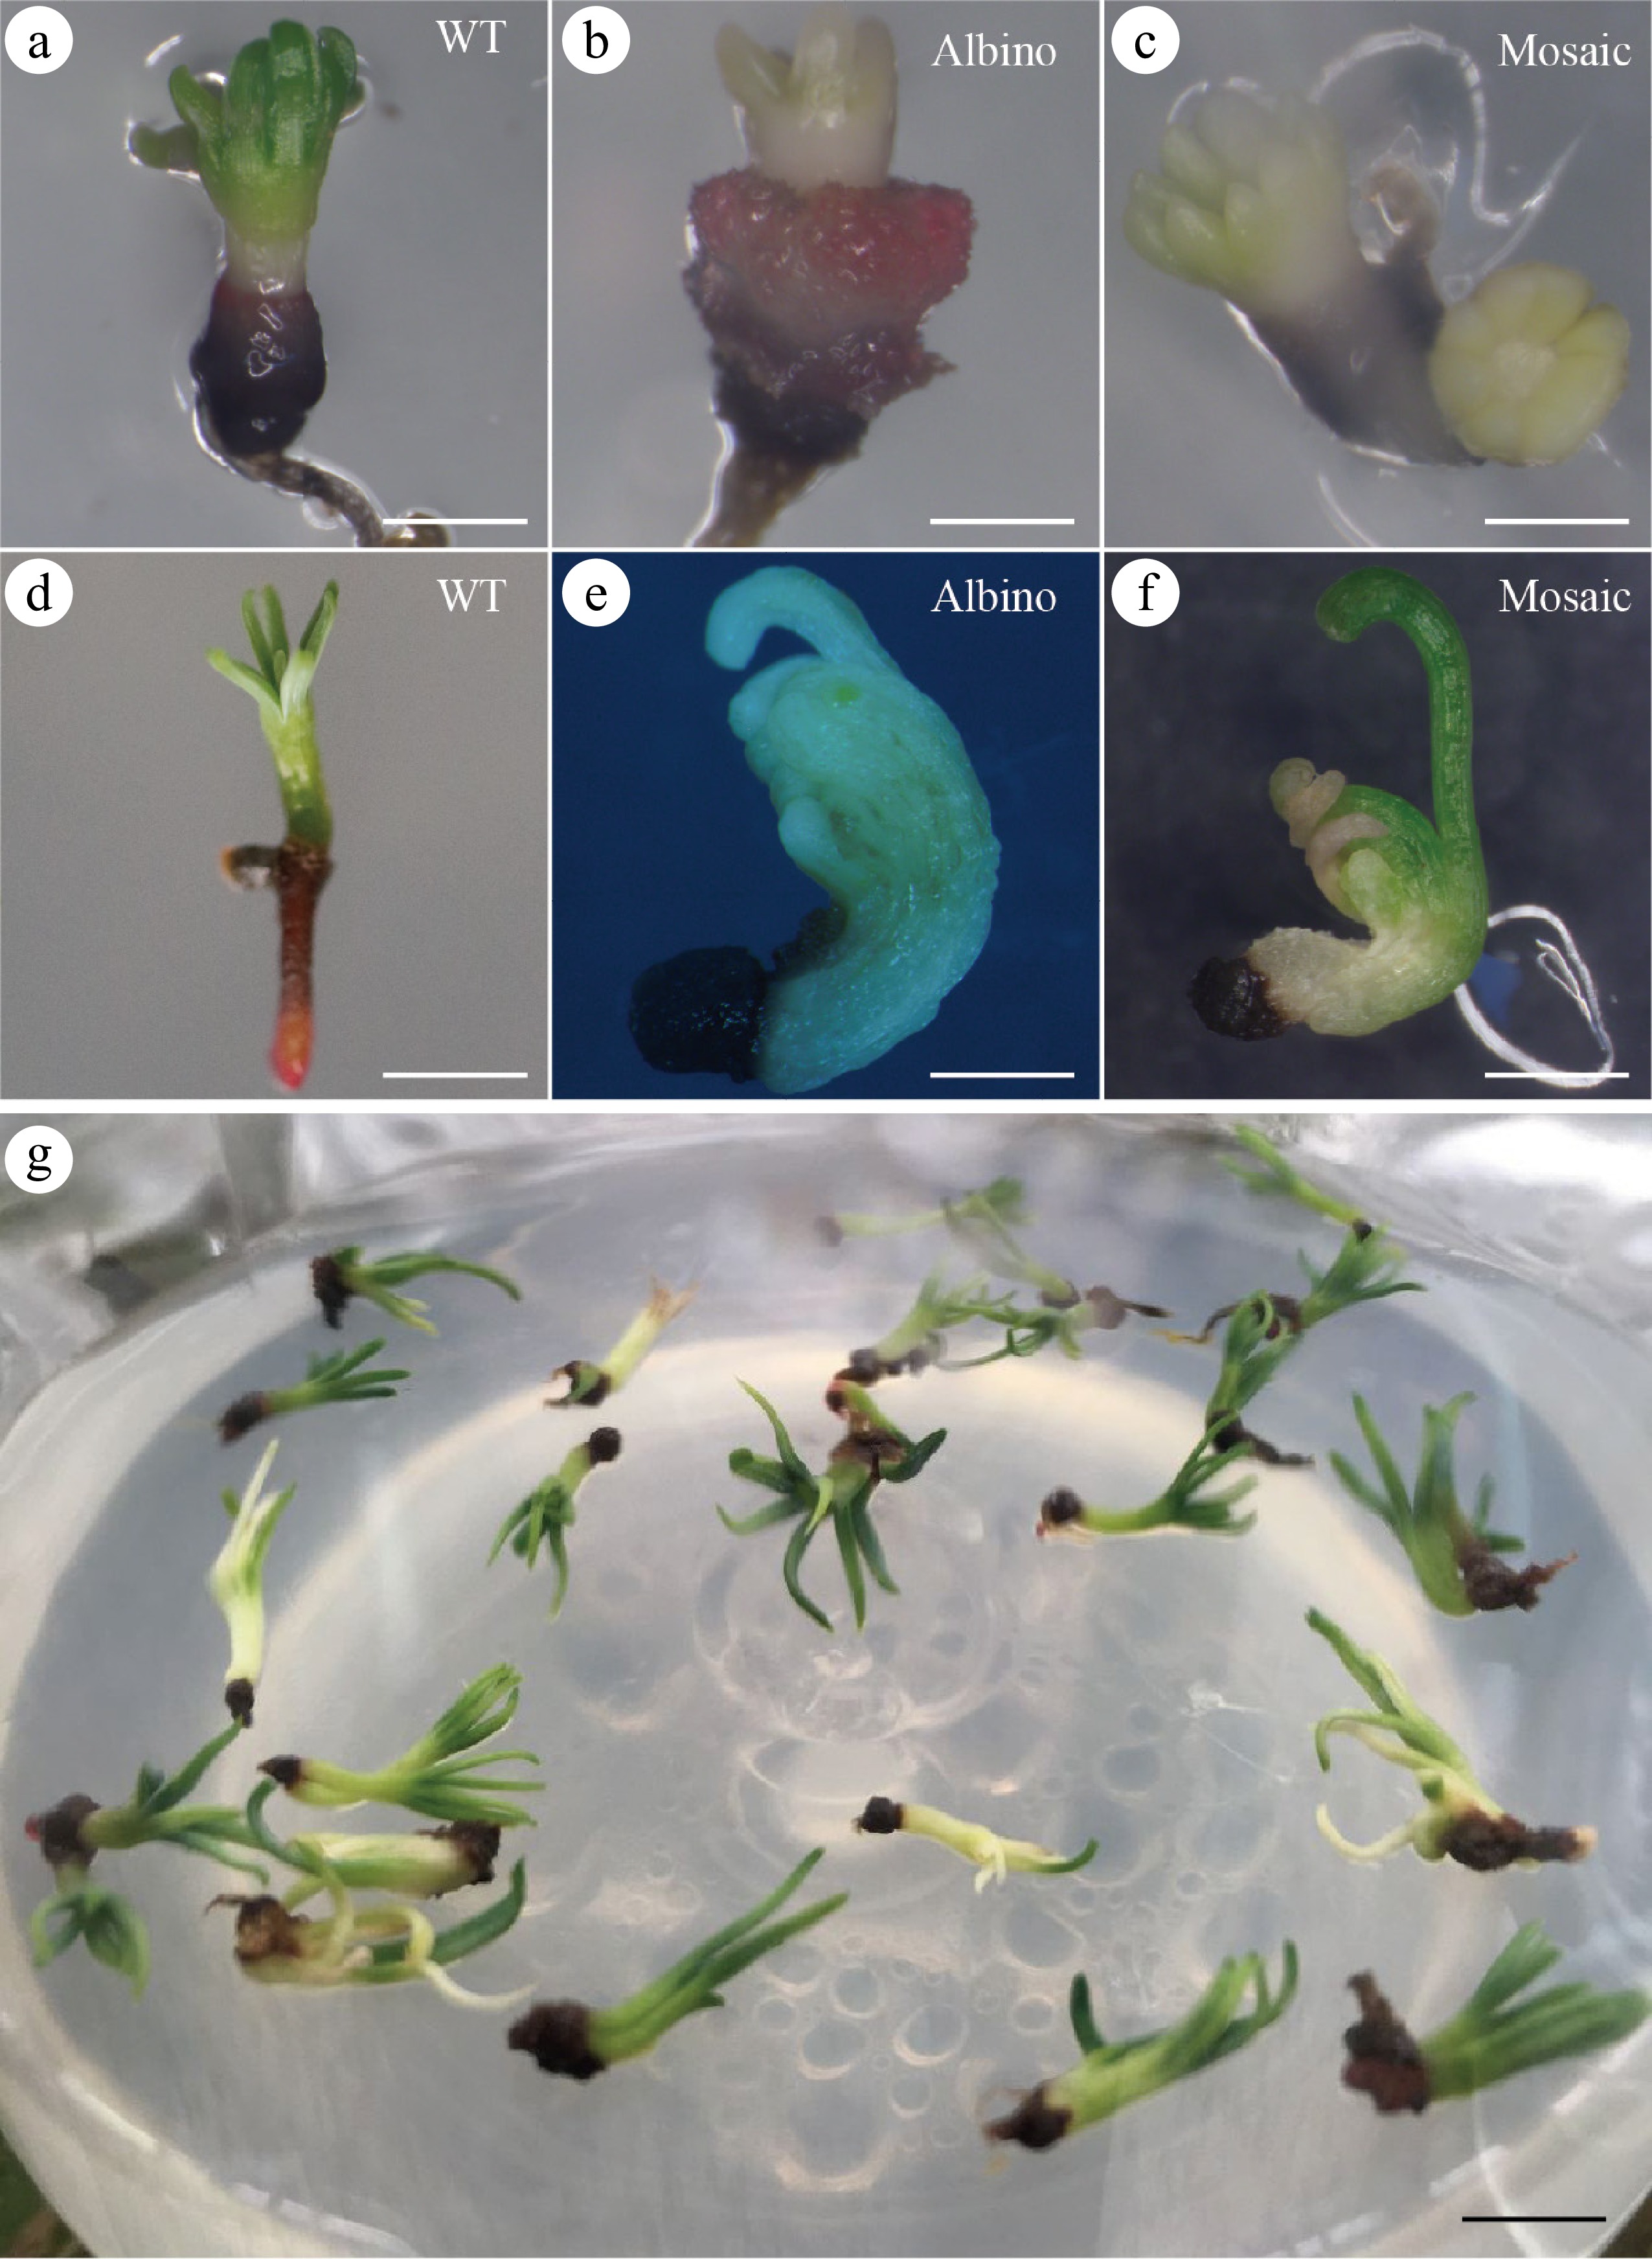
Figure 5.
Albino and mosaic mature somatic embryos developed from embryogenic callus bombarded with Cas9/gRNA particles. Mature somatic embryos exposed to light for 4 weeks; (a) WT, bar = 1.5 mm; (b) albino, bar = 1 mm; (c) mosaic, bar = 1 mm. Albino and mosaic mutant plants after particle bombardment; (d) Somatic embryo plant of WT, bar =1 cm; (e) Somatic embryo of albino, bar =2 mm; (f) Somatic embryo plant of mosaic, bar = 2 mm; (g) Depicts somatic embryo plants after 8 weeks of light exposure, bar = 1 cm.
-

Figure 6.
The editing results and data statistics of mutant plants. (a) Displays Sanger sequencing results at the target site in mutated somatic embryo plants. Blue indicates the target site and red denoting PAM sites. Nucleotide insertion, deletion, and substitution are marked as 'i', 'd', and 's', respectively. (b) Sequences at target site 1 in mutant somatic embryo plants. The black arrows indicate the mutation sites. PAM sites are highlighted in red spaces. (c) The results 1-1, 1-2 and 1-3 are single base mutations at the black arrows sites. The sequencing chromatograms of 1-2 and 1-3 are characterized by significantly double peaks. The result 1-4 is a single base insertion at the black arrow site. (d) The result 2-1 is single base mutations at the black arrows sites. The sequencing chromatograms of the 2-2 to 2-5 were characterized the deletion of bases at the black line. The result 2-5 is also showed single base mutations at the black arrows sites.
-
Name Sequence (5'-3') GC (%)
predictedsgRNA
efficiencyTarget 1 GCAGCAGTCTGTCATCTGCG 60 4.7625 Target 2 TGCGCTCTGTGAAAAAGAAA 40 5.03752 Target 3 AAAGGGATCGAAACGCGACG 55 4.72023 Target 4 AGGTTTGGCTGGCTTGTCAA 50 6.36878 Target 5 GAGGCAAGAGATGTTCTTGG 50 7.32143 Table 1.
Sequences of the five target sites, GC content and their corresponding predicted sgRNA efficiency.
-
Target site number Total number
of somatic
embryosNumber of albino somatic embryo plants Number of mosaic somatic embryo plants Target site 1 281 1 3 Target site 2 234 4 1 Target site 3 316 0 0 Target site 4 162 0 0 Target site 5 244 0 0 Table 2.
The number of albino and mosaic transgenic somatic embryo plants among the five targets.
Figures
(6)
Tables
(2)