-
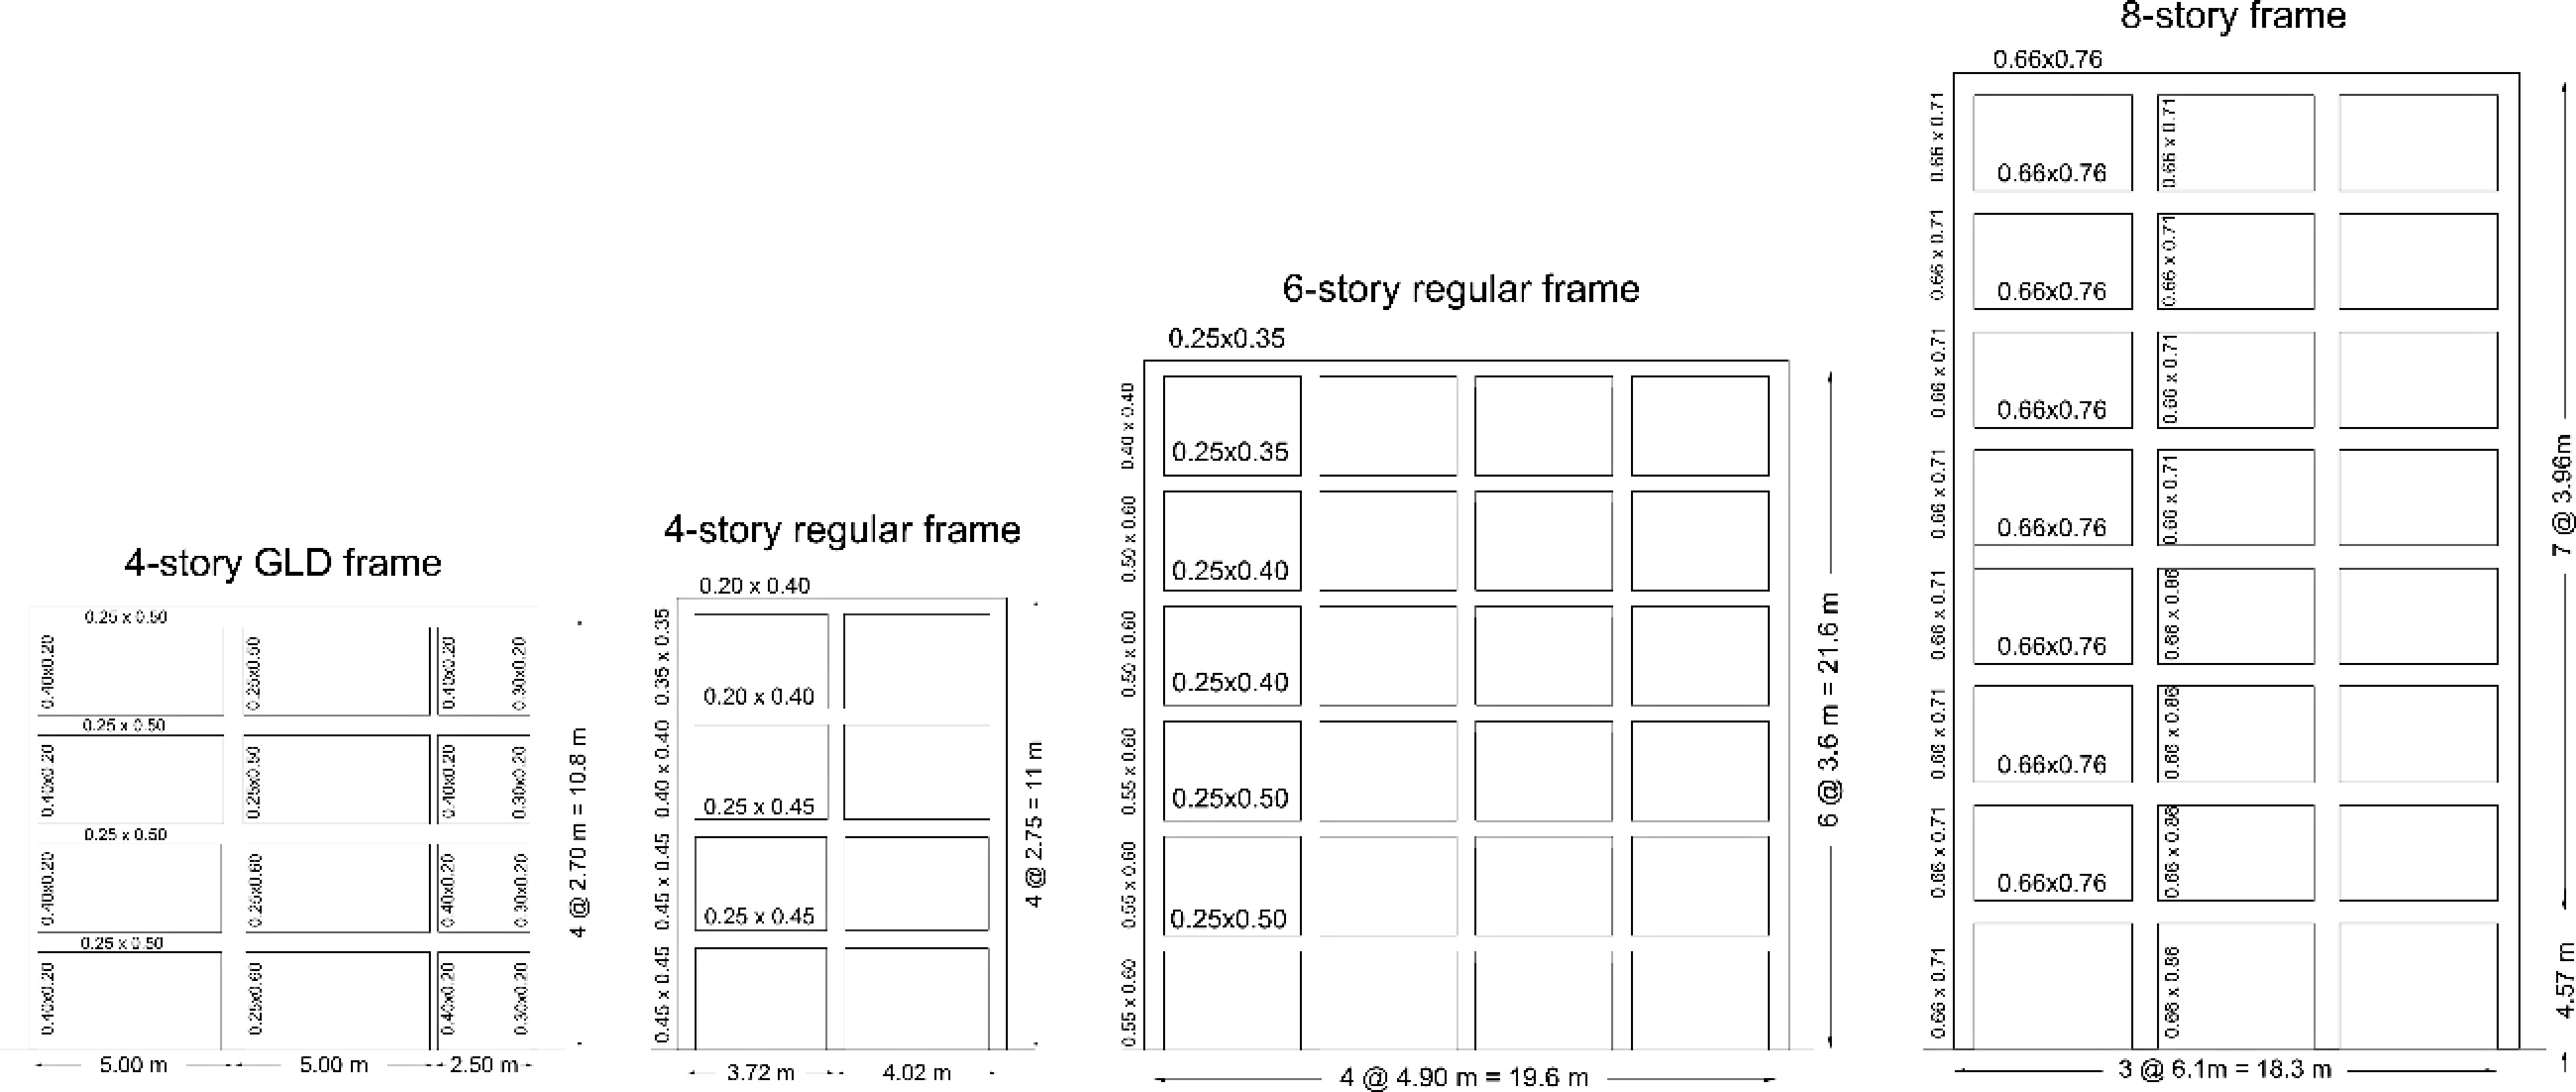
Figure 1.
Elevation view and cross section dimensions of the four frames under study.
-

Figure 2.
Overview of the damage distribution: study of β factor influence.
-

Figure 3.
Calculated and estimated global damage: (a) 4-story; (b) 6-story; (c) 8-story frames.
-

Figure 4.
Classification of ΔDGLOBAL according to the damage category: (a) 4-story; (b) 6-story; (c) 8-story frames.
-
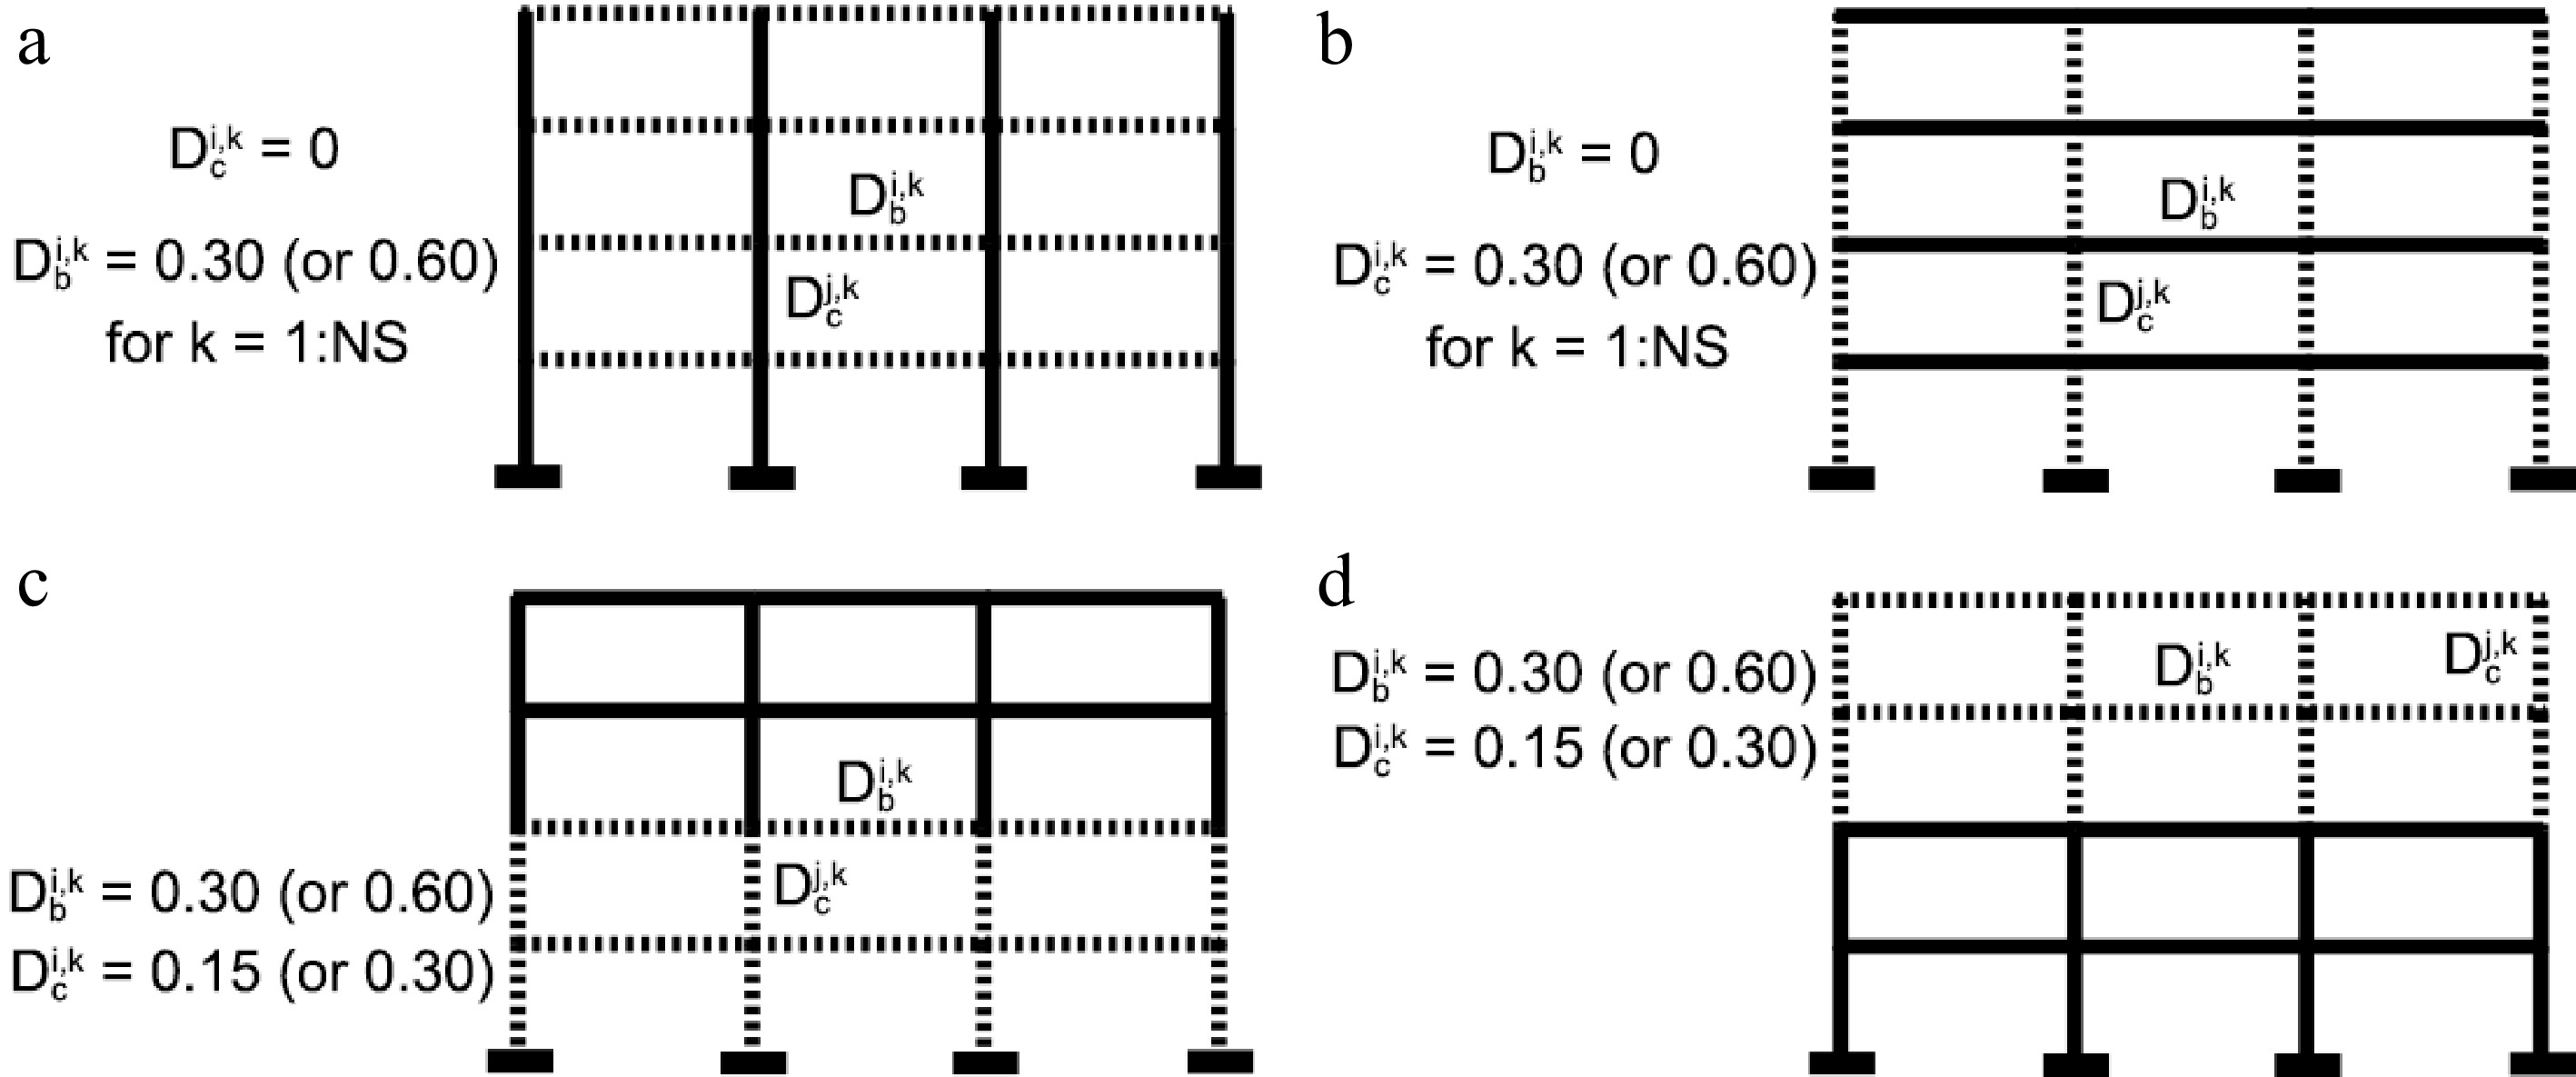
Figure 5.
Component damage: (a) Beams; (b) columns; (c) lower stories; (d) upper stories.
-

Figure 6.
(DCALC) vs (DEST) global damage: (a) 4-story; (b) 6-story; (c) 8-story frames.
-
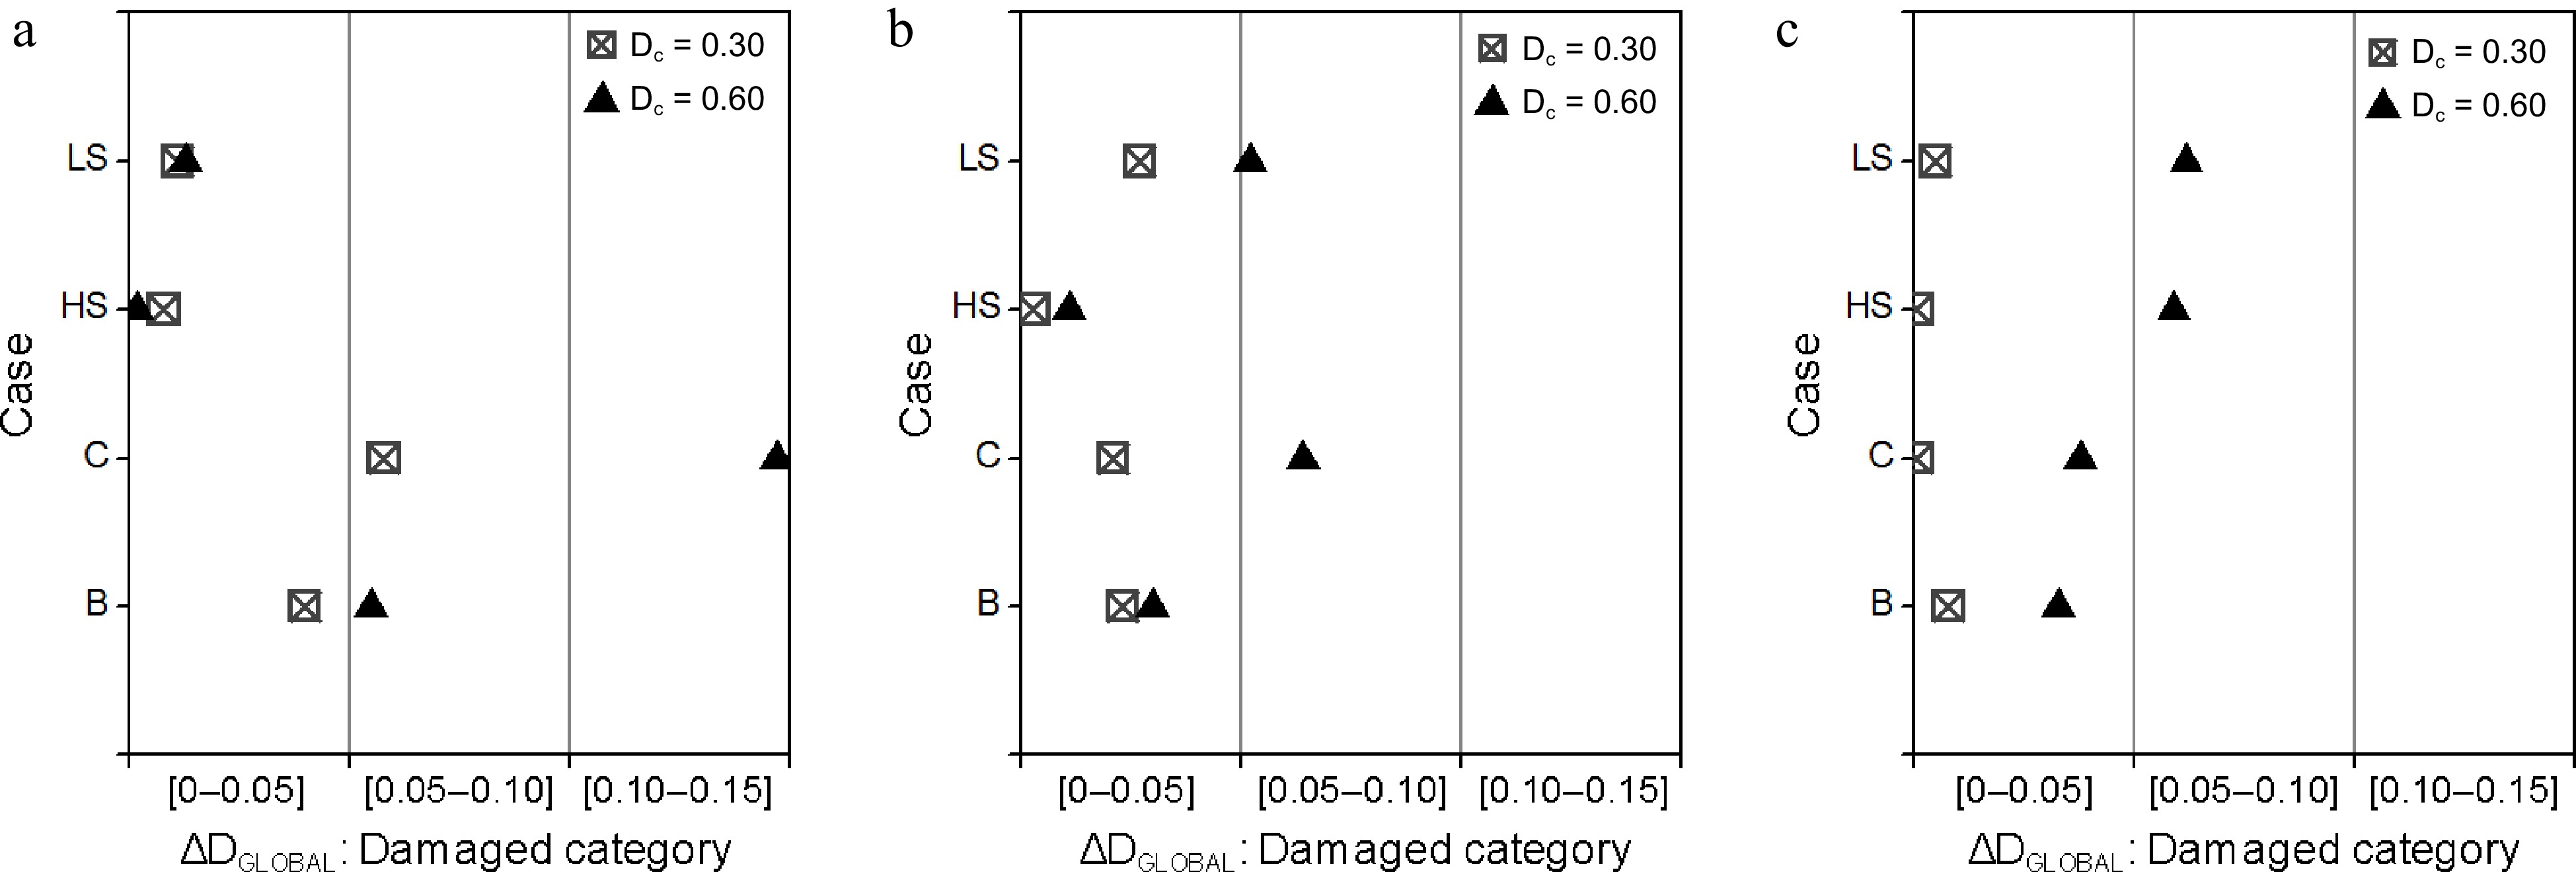
Figure 7.
Difference between DCALC and DEST according to the damage category: (a) 4-story; (b) 6-story; (c) 8-story frames.
-
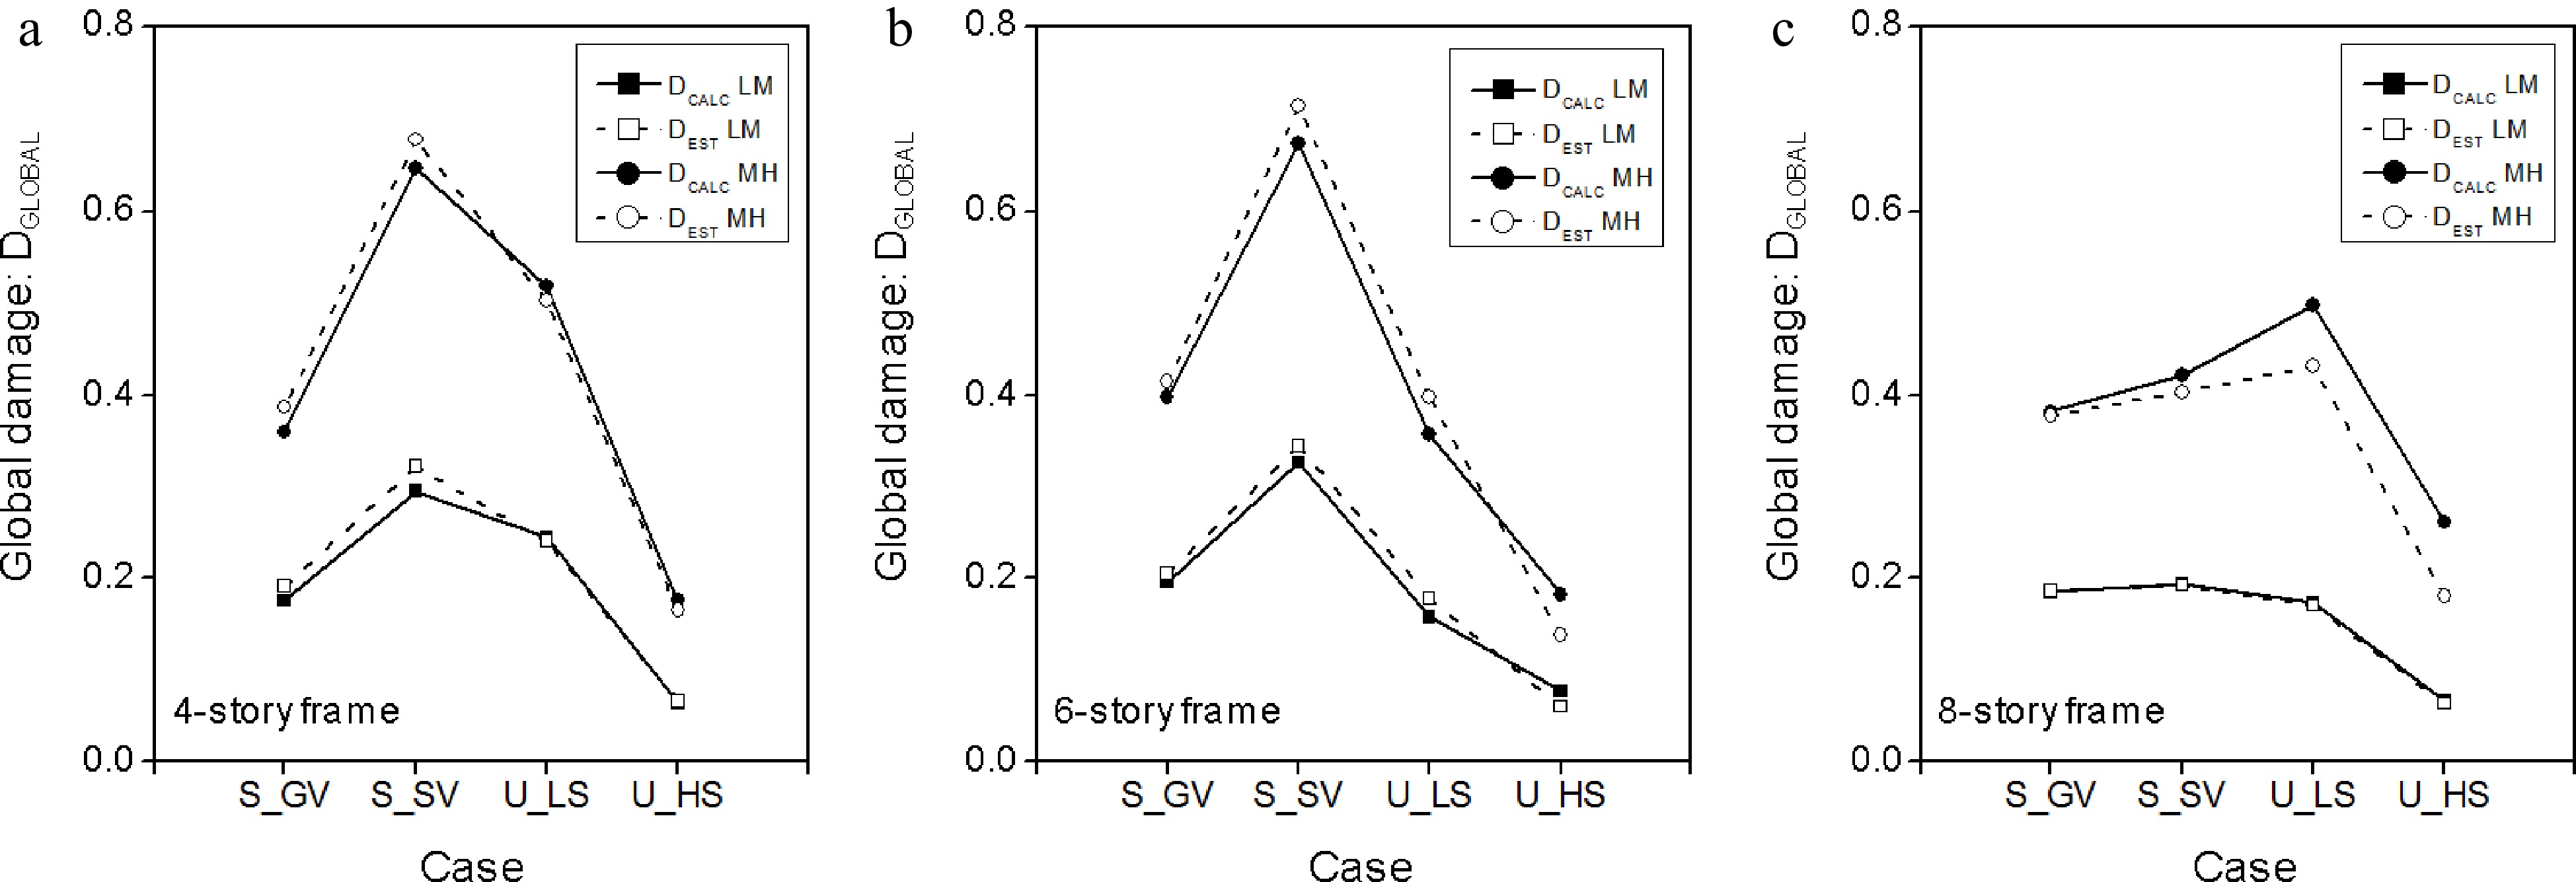
Figure 8.
Calculated vs estimated global damage: (a) 4-story; (b) 6-story; (c) 8-story frames.
-
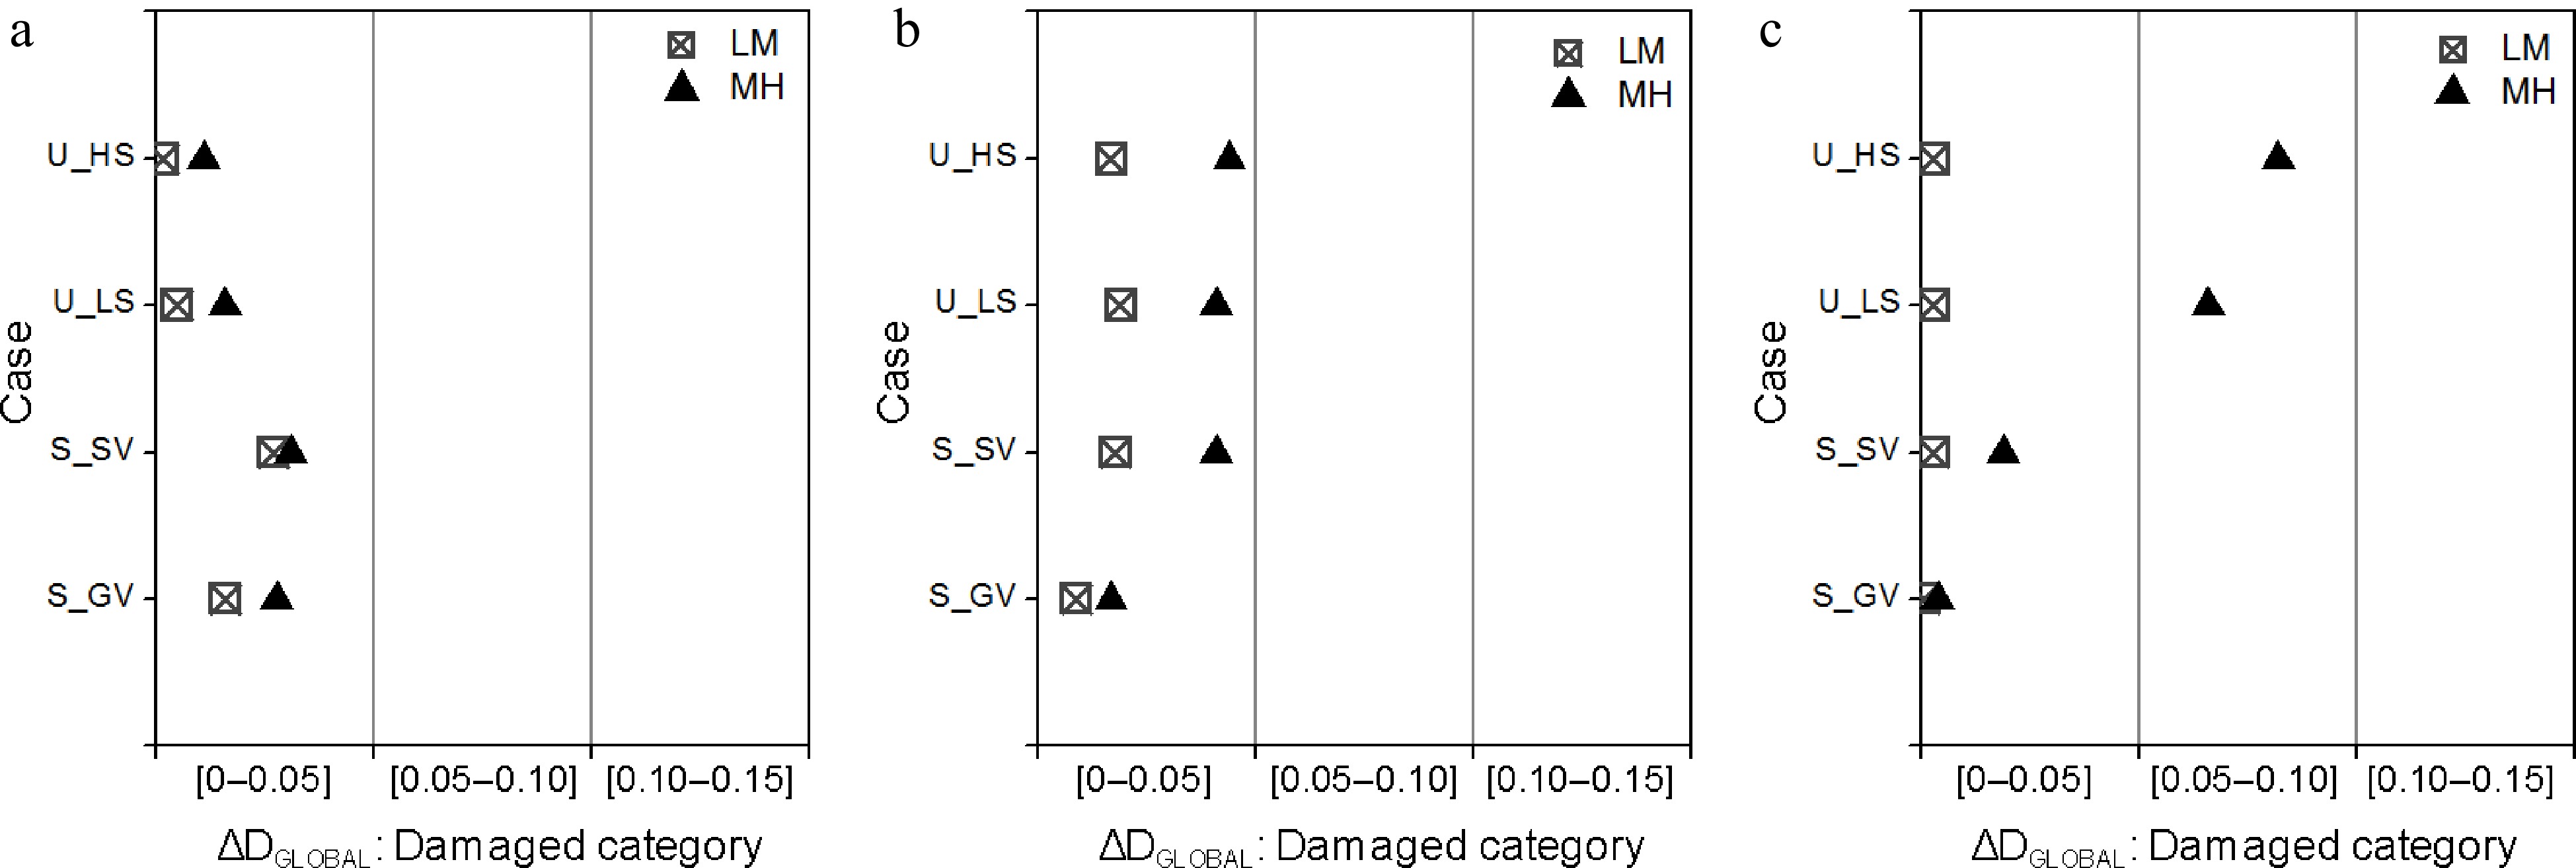
Figure 9.
Difference between DCALC and DEST according to the damage category: (a) 4-story; (b) 6-story; (c) 8-story frames.
-

Figure 10.
Calculated vs estimated global damage: (a) 4-story; (b) 6-story; (c) 8-story frames.
-
Event Damage Story Beam Columns 1 2 3 4 1 2 3 4 5 S_GV 1 0.25 0.25 0.25 0.25 0.15 0.15 0.2 0.15 0.15 2 0.25 0.25 0.25 0.25 0.15 0.15 0.2 0.15 0.15 3 0.2 0.2 0.2 0.2 0.15 0.15 0.2 0.15 0.15 4 0.2 0.2 0.2 0.2 0.1 0.1 0.15 0.1 0.1 5 0.1 0.1 0.1 0.1 0.1 0.1 0.15 0.1 0.1 6 0.1 0.1 0.1 0.1 0.1 0.1 0.15 0.1 0.1 S_SV 1 0.4 0.4 0.4 0.4 0.2 0.2 0.2 0.2 0.2 2 0.4 0.4 0.4 0.4 0.2 0.2 0.2 0.2 0.2 3 0.4 0.4 0.4 0.4 0.2 0.2 0.2 0.2 0.2 4 0.3 0.3 0.3 0.3 0.1 0.1 0.1 0.1 0.1 5 0.3 0.3 0.3 0.3 0.1 0.1 0.1 0.1 0.1 6 0.3 0.3 0.3 0.3 0.1 0.1 0.1 0.1 0.1 U_LS 1 0.4 0.2 0.15 0.35 0.3 0.35 0.25 0.2 0.3 2 0.35 0.25 0.15 0.3 0.25 0.25 0.2 0.1 0.25 3 0.15 0.1 0.2 0.2 0.15 4 0.1 0.1 5 6 U_HS 1 2 3 0.1 4 0.2 0.1 0.2 0.25 0.2 0.25 0.25 5 0.35 0.2 0.3 0.2 0.3 0.3 0.3 0.2 0.1 6 0.15 0.15 0.2 0.15 0.15 0.25 0.2 0.15 Table 1.
Damage pattern of the 6-story frame, for low-medium (LW) levels of damage.
-
N Earthquake Year Station (component) Mw PGA (g) 1 Imperial Valley 1940 El Centro (180) 7.0 0.31 2 Loma Prieta 1989 Corralitos (000) 6.9 0.64 3 San Fernando 1971 Castaic (021) 6.6 0.32 4 Kobe 1995 Takaratzuka (000) 6.9 0.69 5 Erzincan 1992 Erzincan (NS) 6.9 0.52 6 Northridge 1994 Canyon country (270) 6.7 0.48 Table 2.
Ground motion events selected for the validation analysis.
-
GM Damage Story Beam Colunm 1 2 1 2 3 Erzincan 1 0.68 0.51 0 0.32 0 2 0.59 0.18 0 0.48 0 3 0 0 0 0.21 0 4 0 0 0 0 0 Loma Prieta 1 0.8 0.84 0.61 0.78 0.62 2 0.85 0.82 0 0.86 0 3 0.79 0.66 0.47 0.89 0.35 4 0 0 0 0 0 Table 3.
Examples of damage arrangements obtained for the 4-story frame.
-
GM Damage Story Beam Colunm 1 2 3 4 1 2 3 4 5 San Fernando 1 0 0 0 0 0 0 0 0 0 2 0 0 0 0 0 0 0 0 0 3 0 0 0 0 0 0 0 0 0 4 0 0 0 0 0 0 0 0 0 5 0.87 0.87 0.87 0.87 0 0 0 0 0 6 0.52 0.44 0.46 0.55 0 0 0 0 0 Northridge 1 0 0 0 0 0 0 0 0 0 2 0.45 0.41 0.4 0.48 0 0 0 0 0 3 0.5 0.51 0.51 0.52 0 0 0 0 0 4 0.58 0.54 0.54 0.58 0 0 0 0 0 5 0.91 0.91 0.91 0.91 0 0 0 0 0 6 0.78 0.76 0.76 0.78 0 0 0 0 0 Table 4.
Examples of damage arrangements obtained for the 6-story frame.
-
GM Damage Story Beam Column 1 2 3 1 2 3 4 Imperial Valley 1 0.78 0.78 0.77 0 0 0 0 2 0.72 0.73 0.7 0 0 0 0 3 0.62 0.67 0.6 0 0 0 0 4 0.74 0.75 0.7 0 0 0 0 5 0.83 0.81 0.8 0 0 0 0 6 0.85 0.84 0.82 0 0 0 0 7 0.8 0.8 0.76 0 0 0 0 8 0 0 0 0 0 0 0 Northridge 1 0 0 0 0 0 0 0 2 0 0 0 0 0 0 0 3 0 0 0 0 0 0 0 4 0 0.09 0 0 0 0 0 5 0 0.12 0.24 0 0 0 0 6 0.29 0.25 0.21 0 0 0 0 7 0.82 0.79 0.79 0 0 0 0 8 0.55 0.45 0.57 0 0.71 0.64 0 Table 5.
Examples of damage arrangements obtained for the 8-story frame.
Figures
(10)
Tables
(5)