-
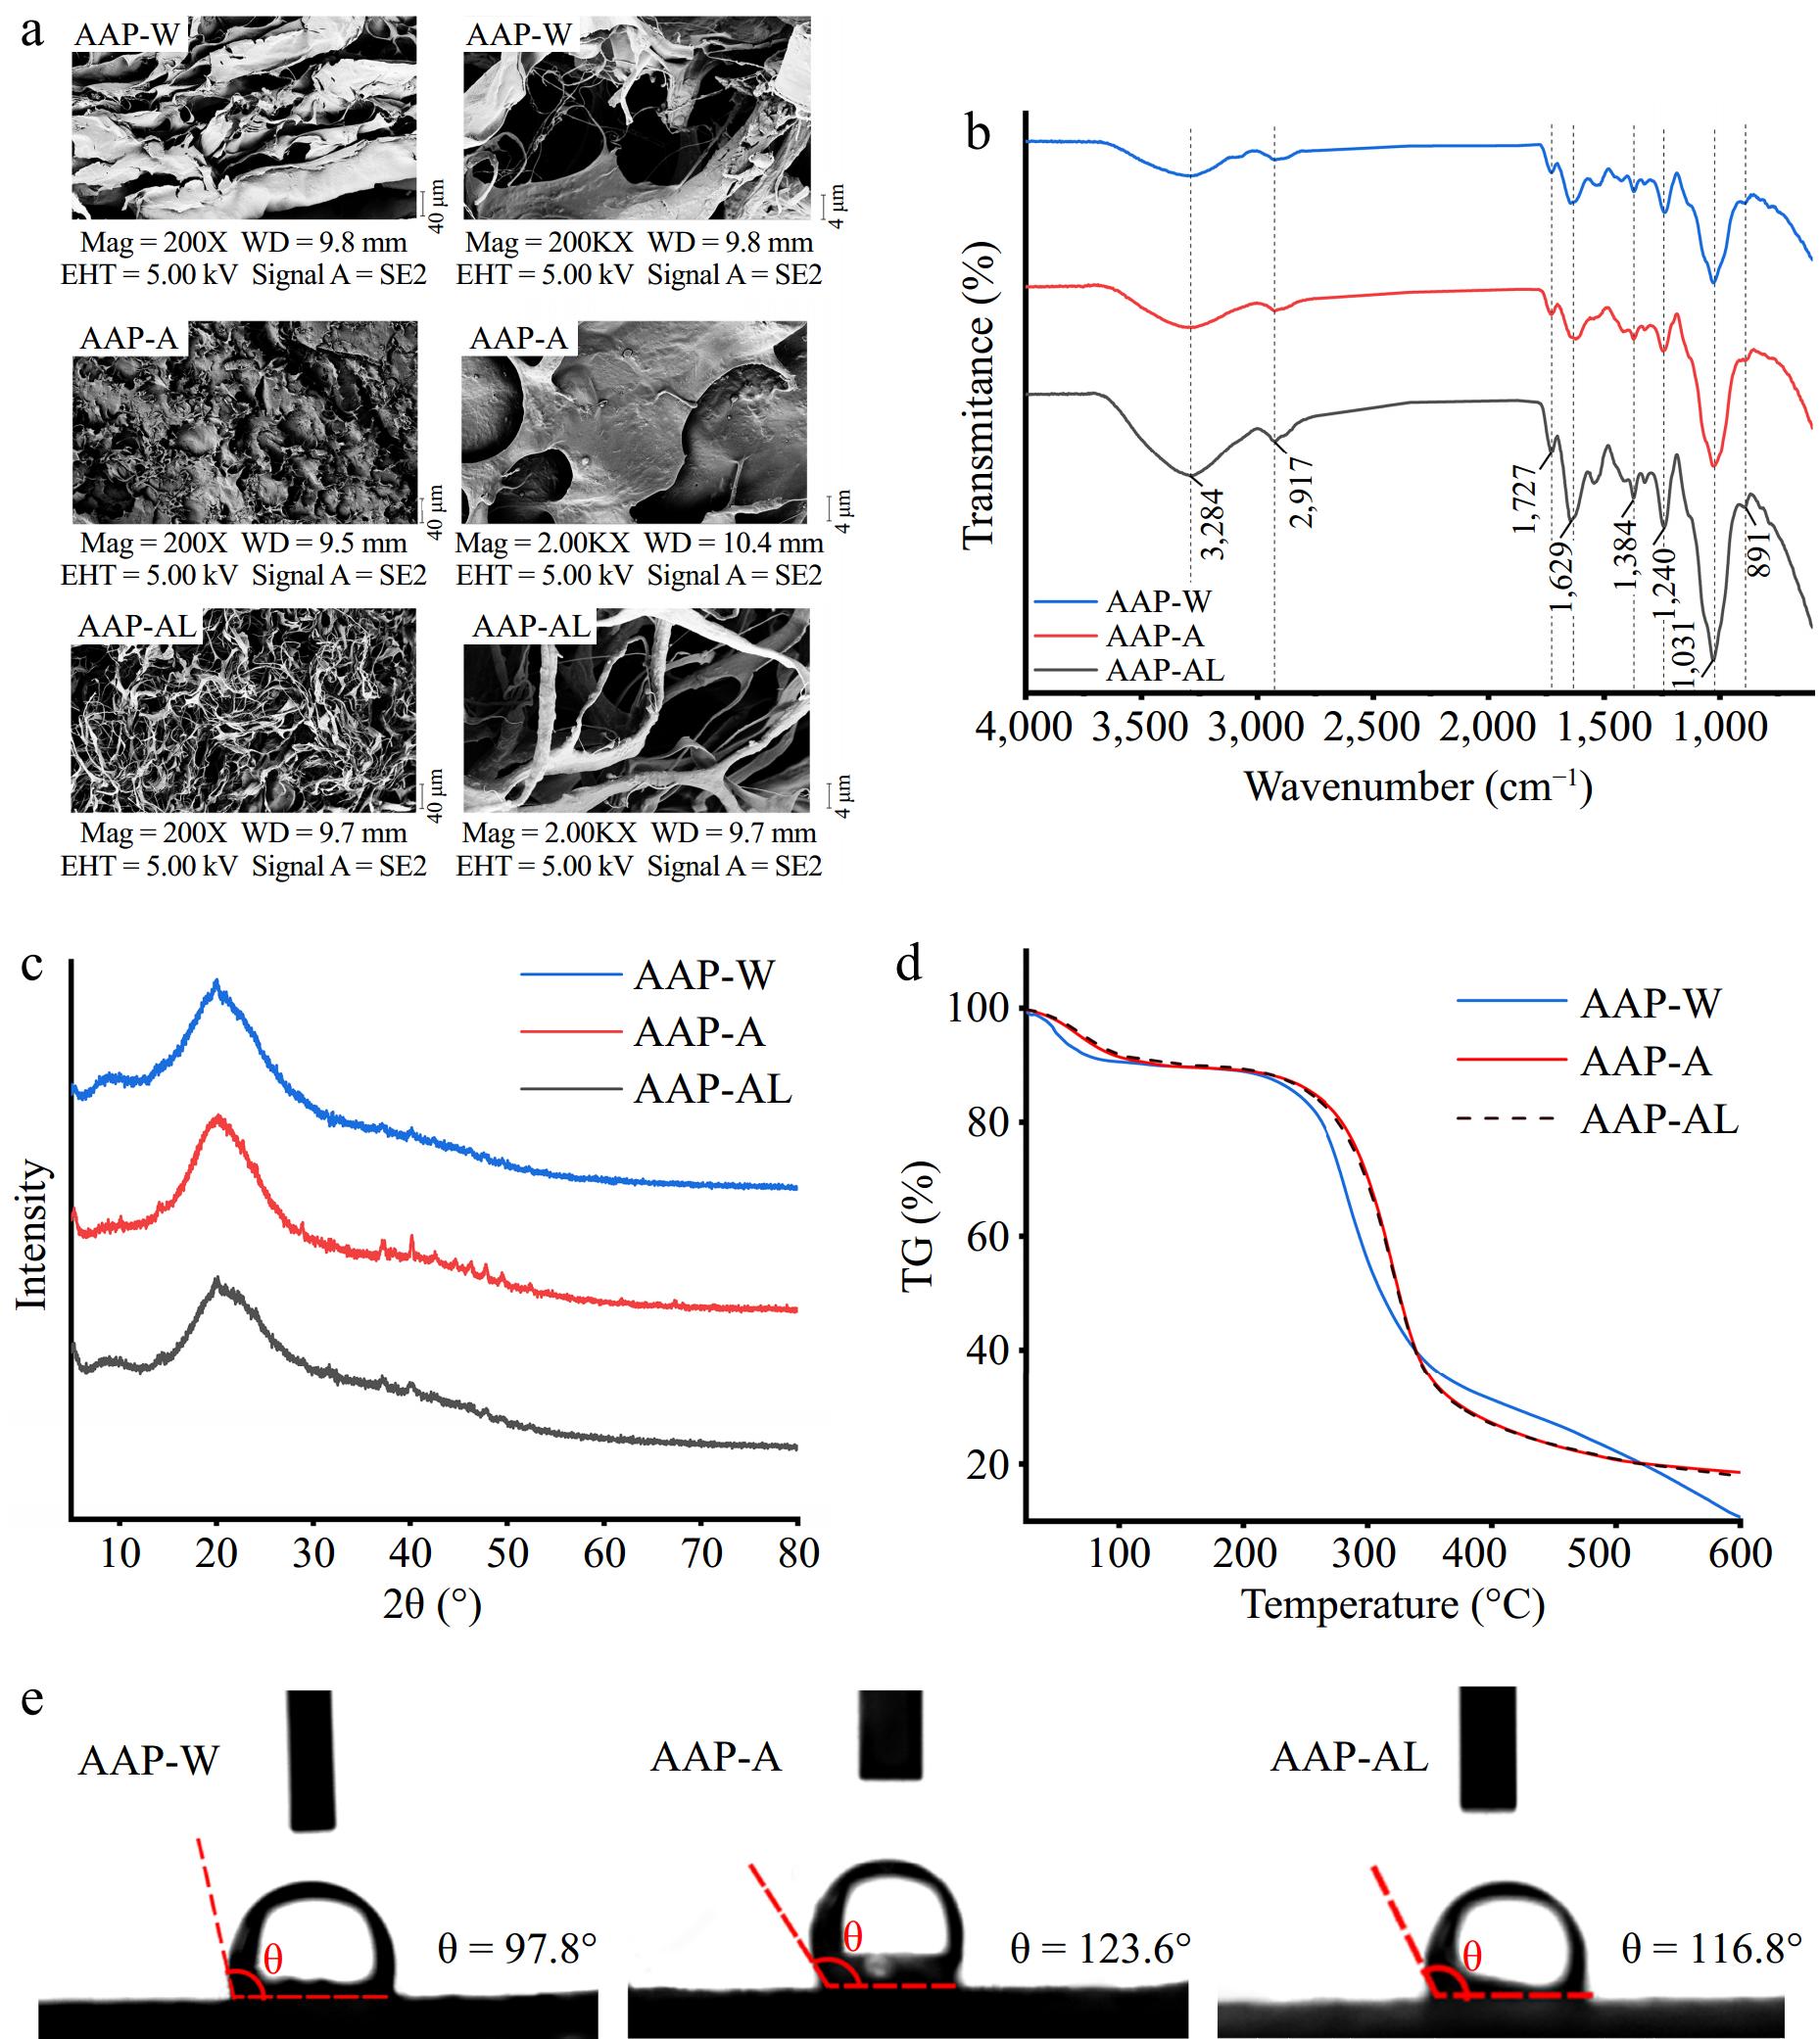
Figure 1.
Physicochemical properties and structural characterization of AAP. (a) SEM. (b) FI-IR. (c) TG. (d) XRD. (e) Three-phase contact angle.
-
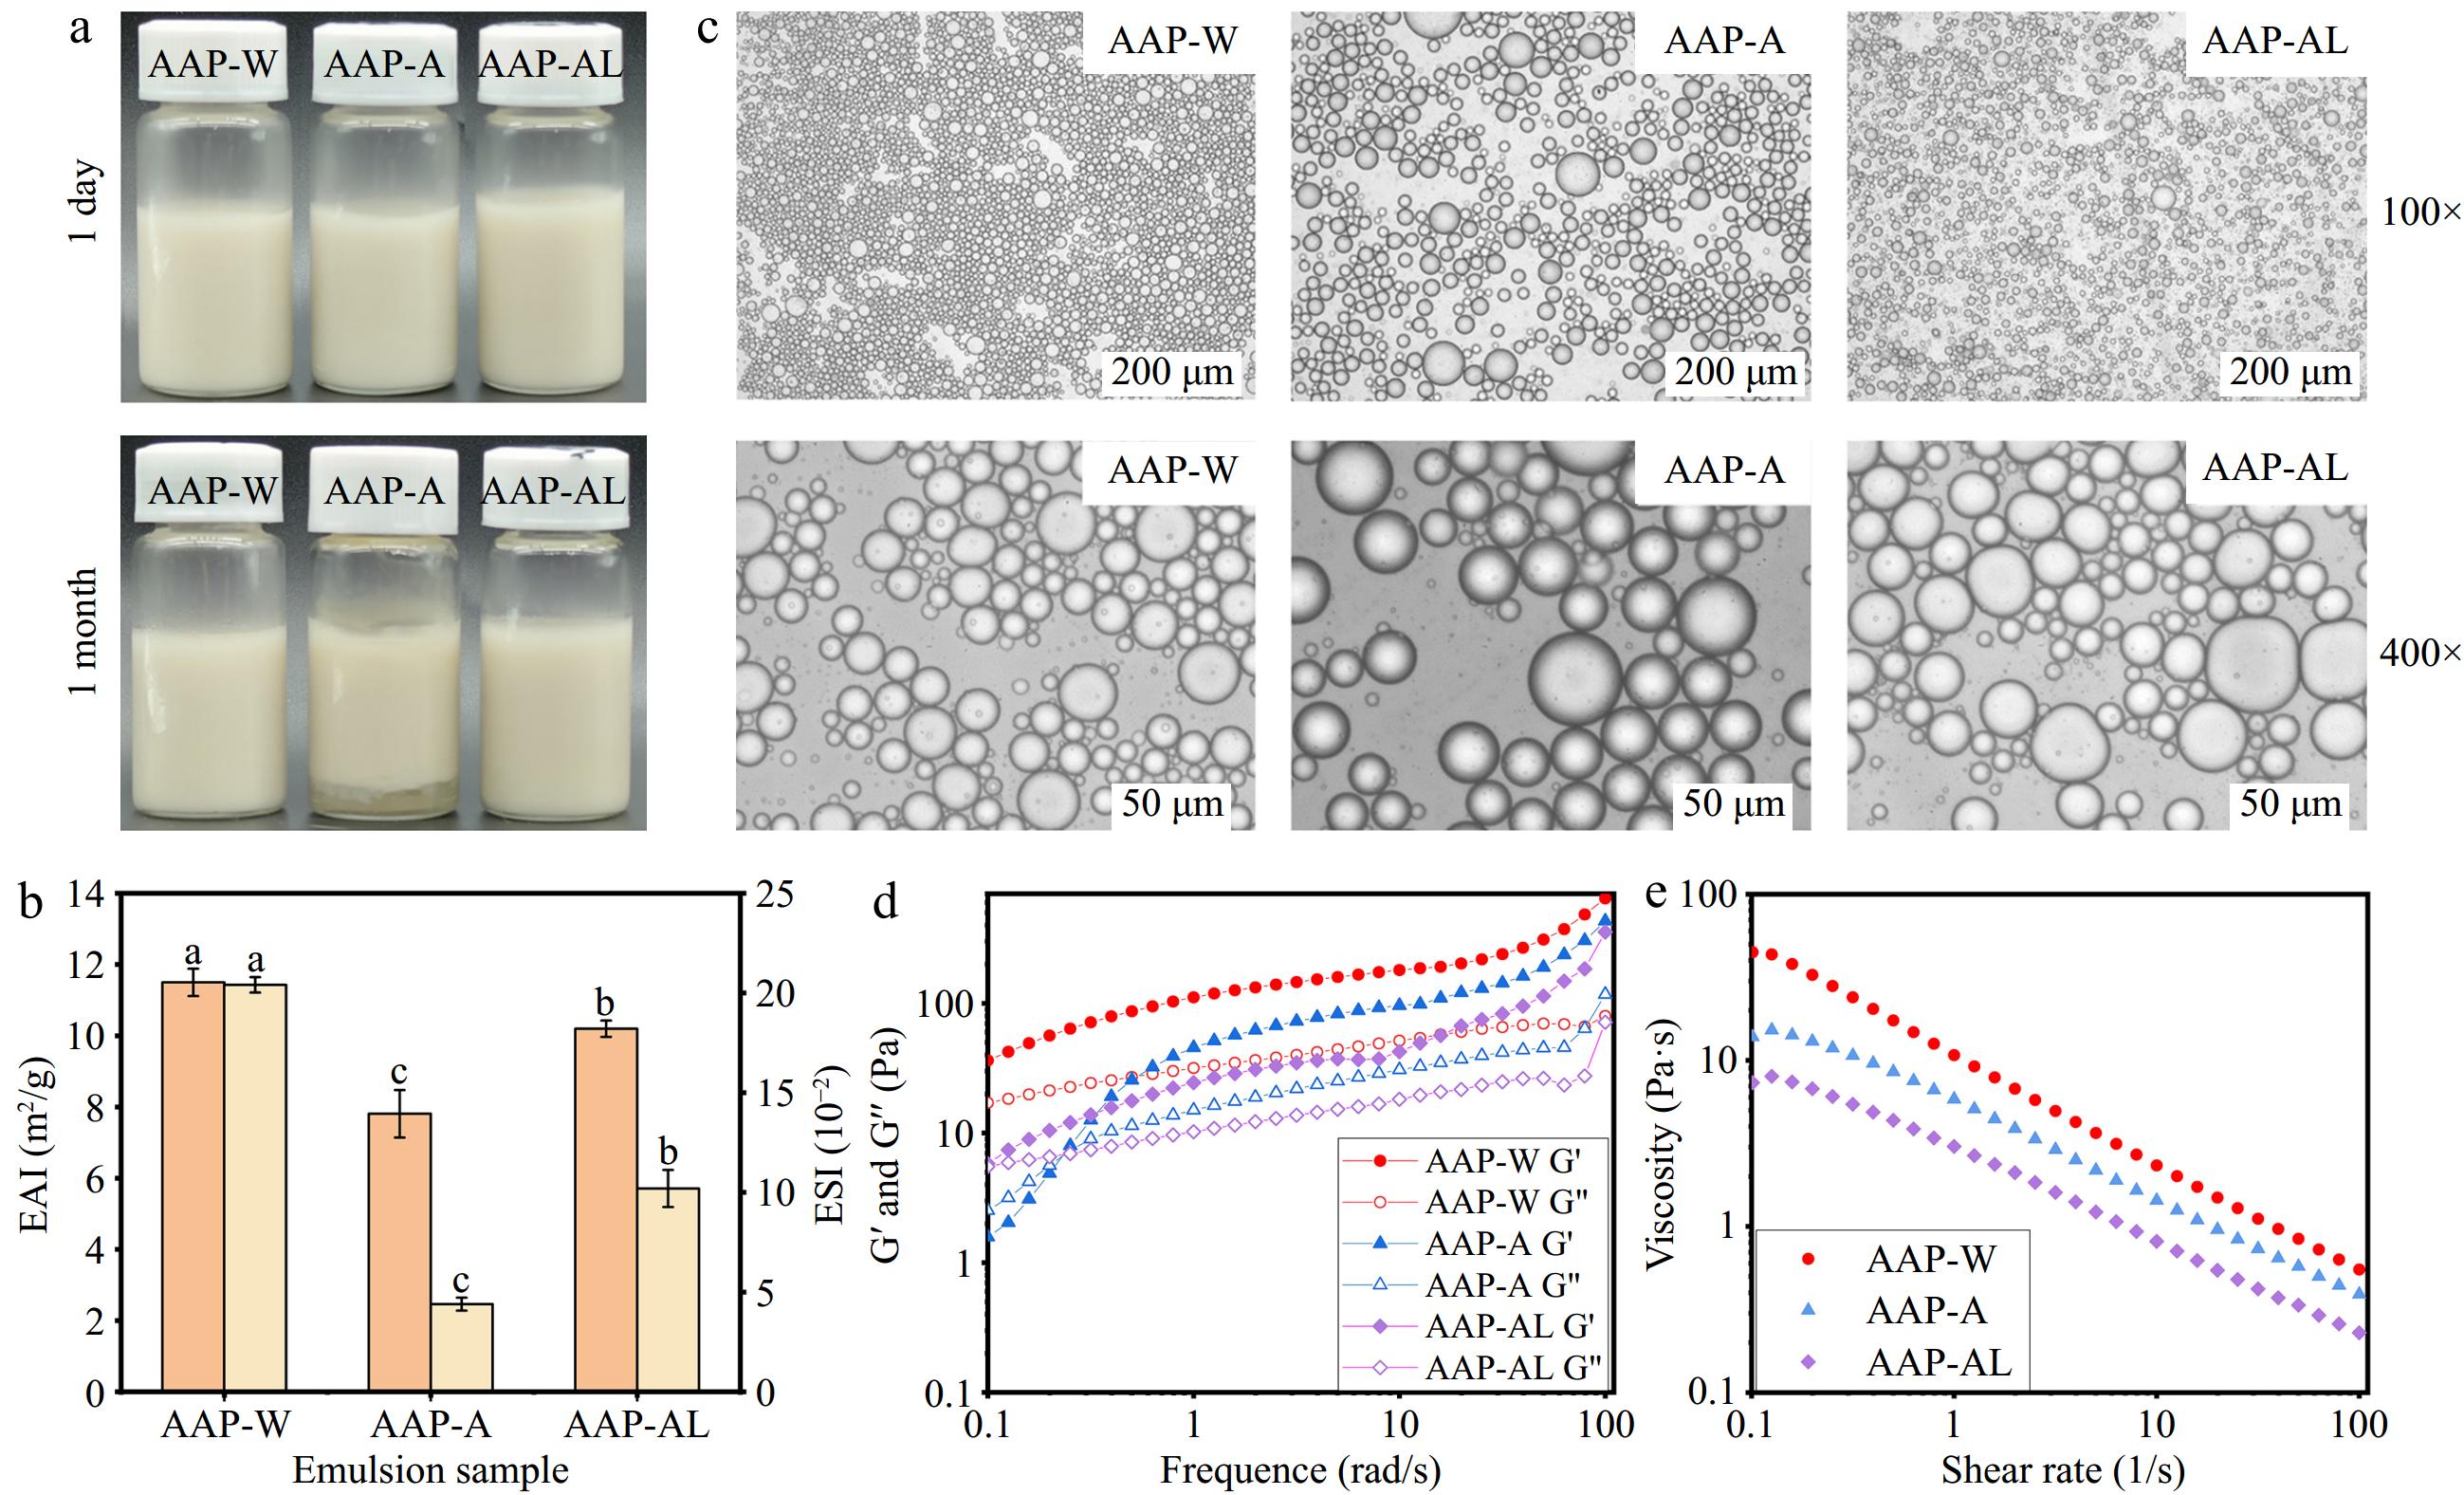
Figure 2.
Emulsification properties of AAP. (a) Emulsion prepared from AAP. (b) EAI and ESI. (c) Micromorphology of AAP emulsion. (d) Rheological dynamic analysis of AAP. (e) Rheological static results of AAP.
-
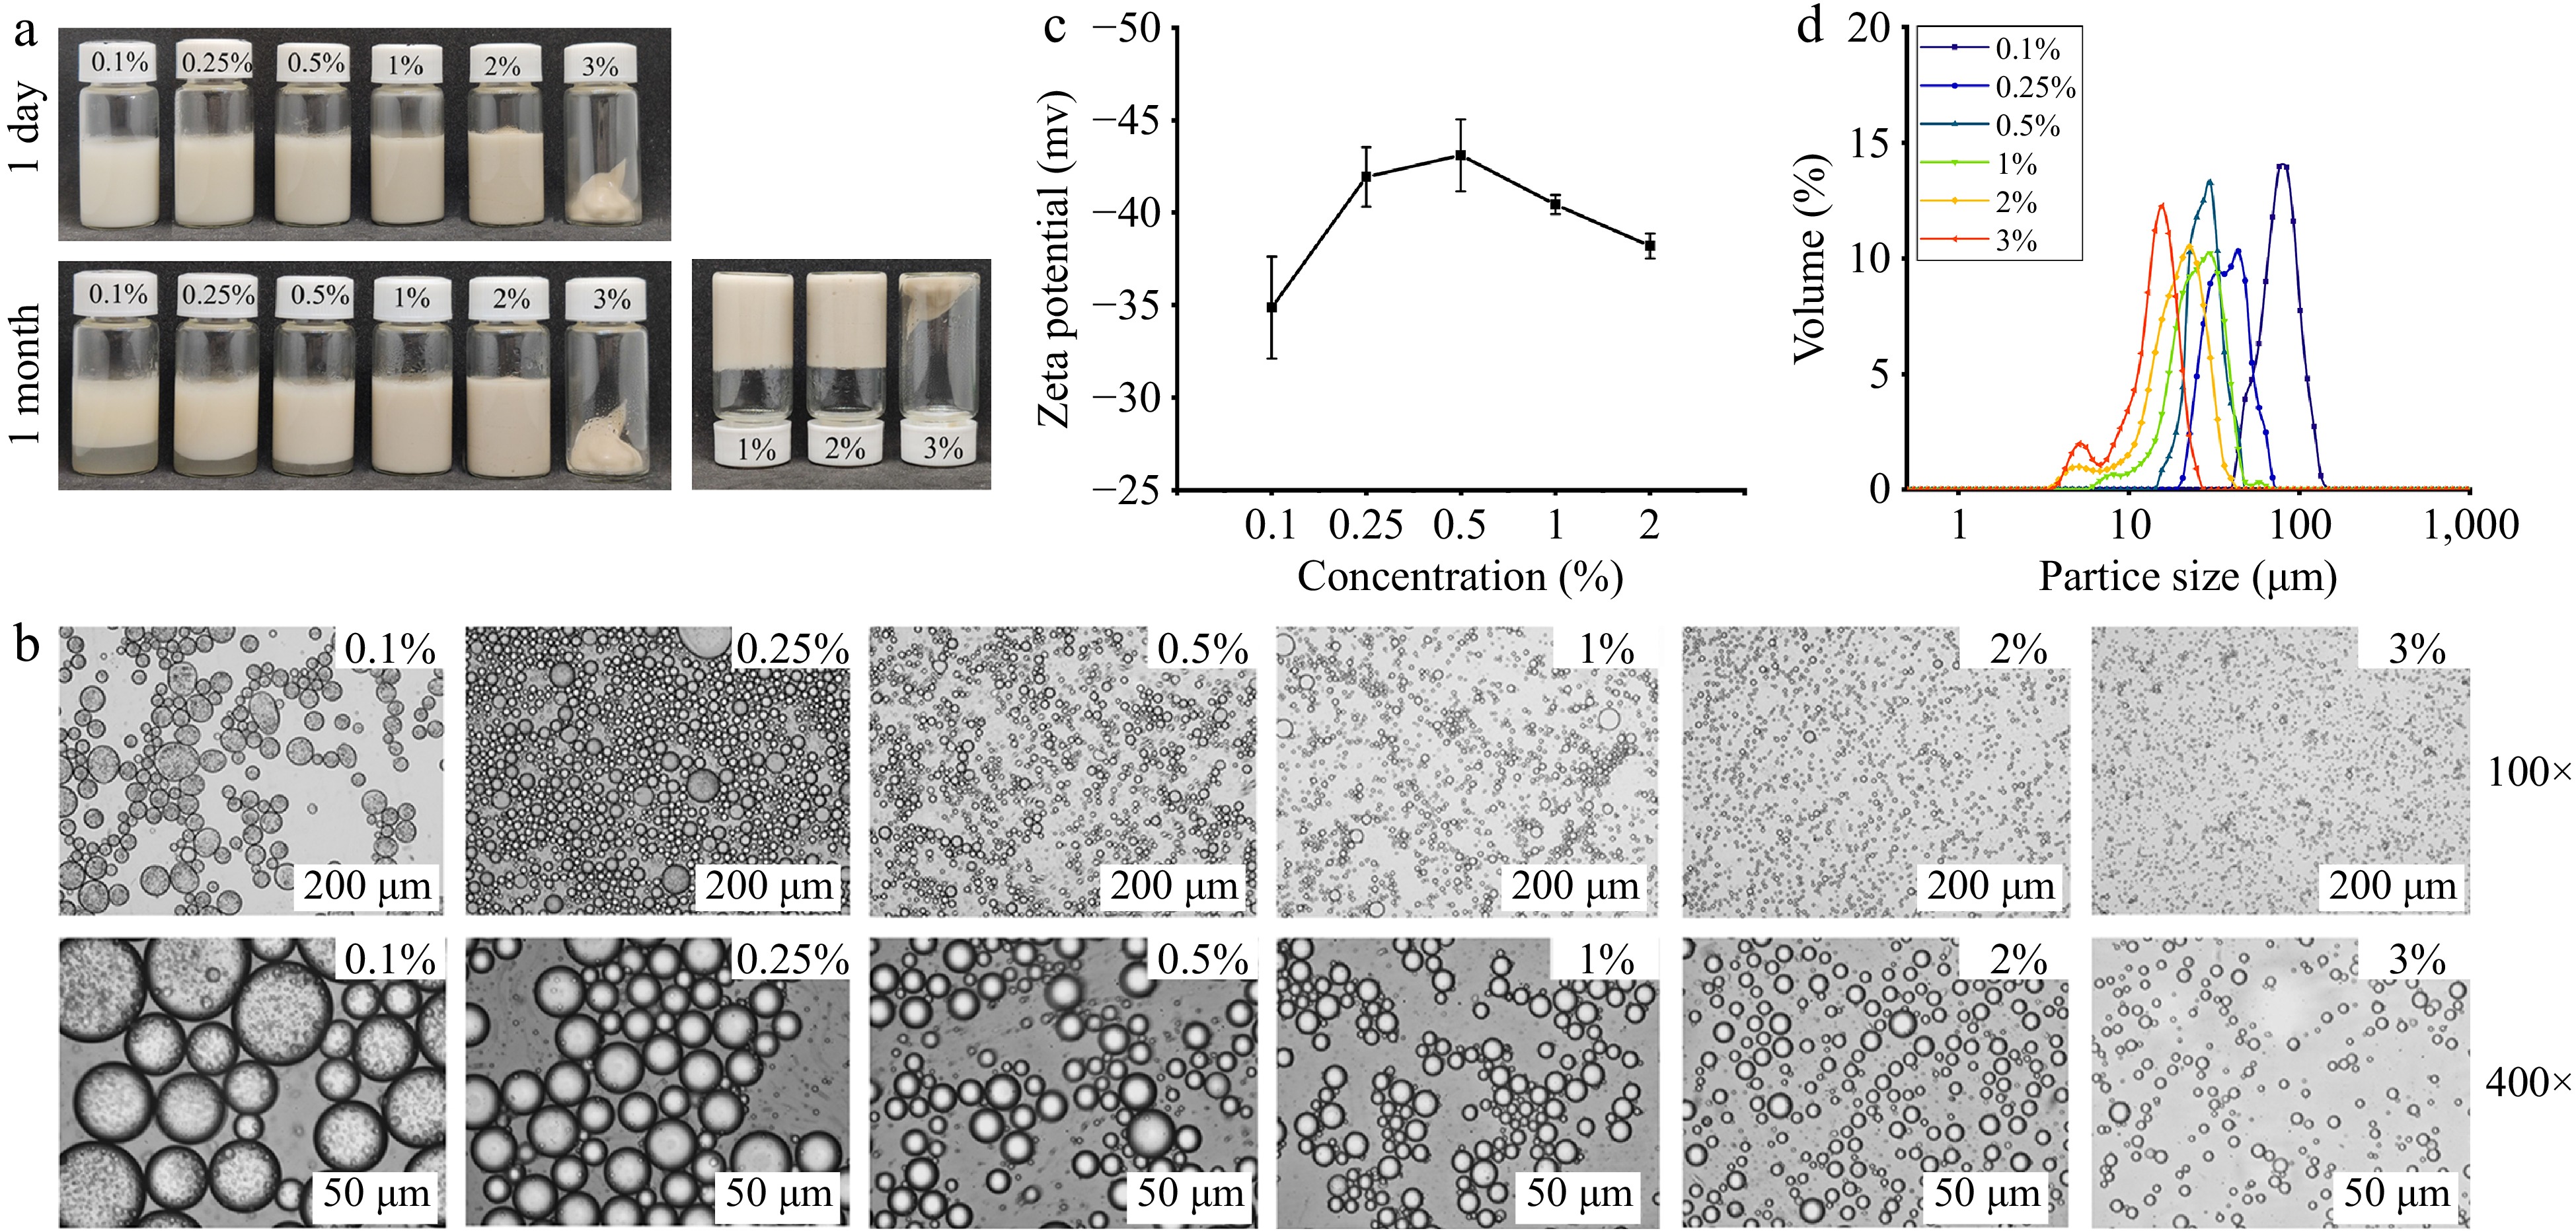
Figure 3.
Effect of AAP-W concentration on the stability of emulsions. (a) Static stability of emulsion. (b) Micromorphology of emulsion. (c) Zeta potential. (d) Particle size distribution of emulsion.
-
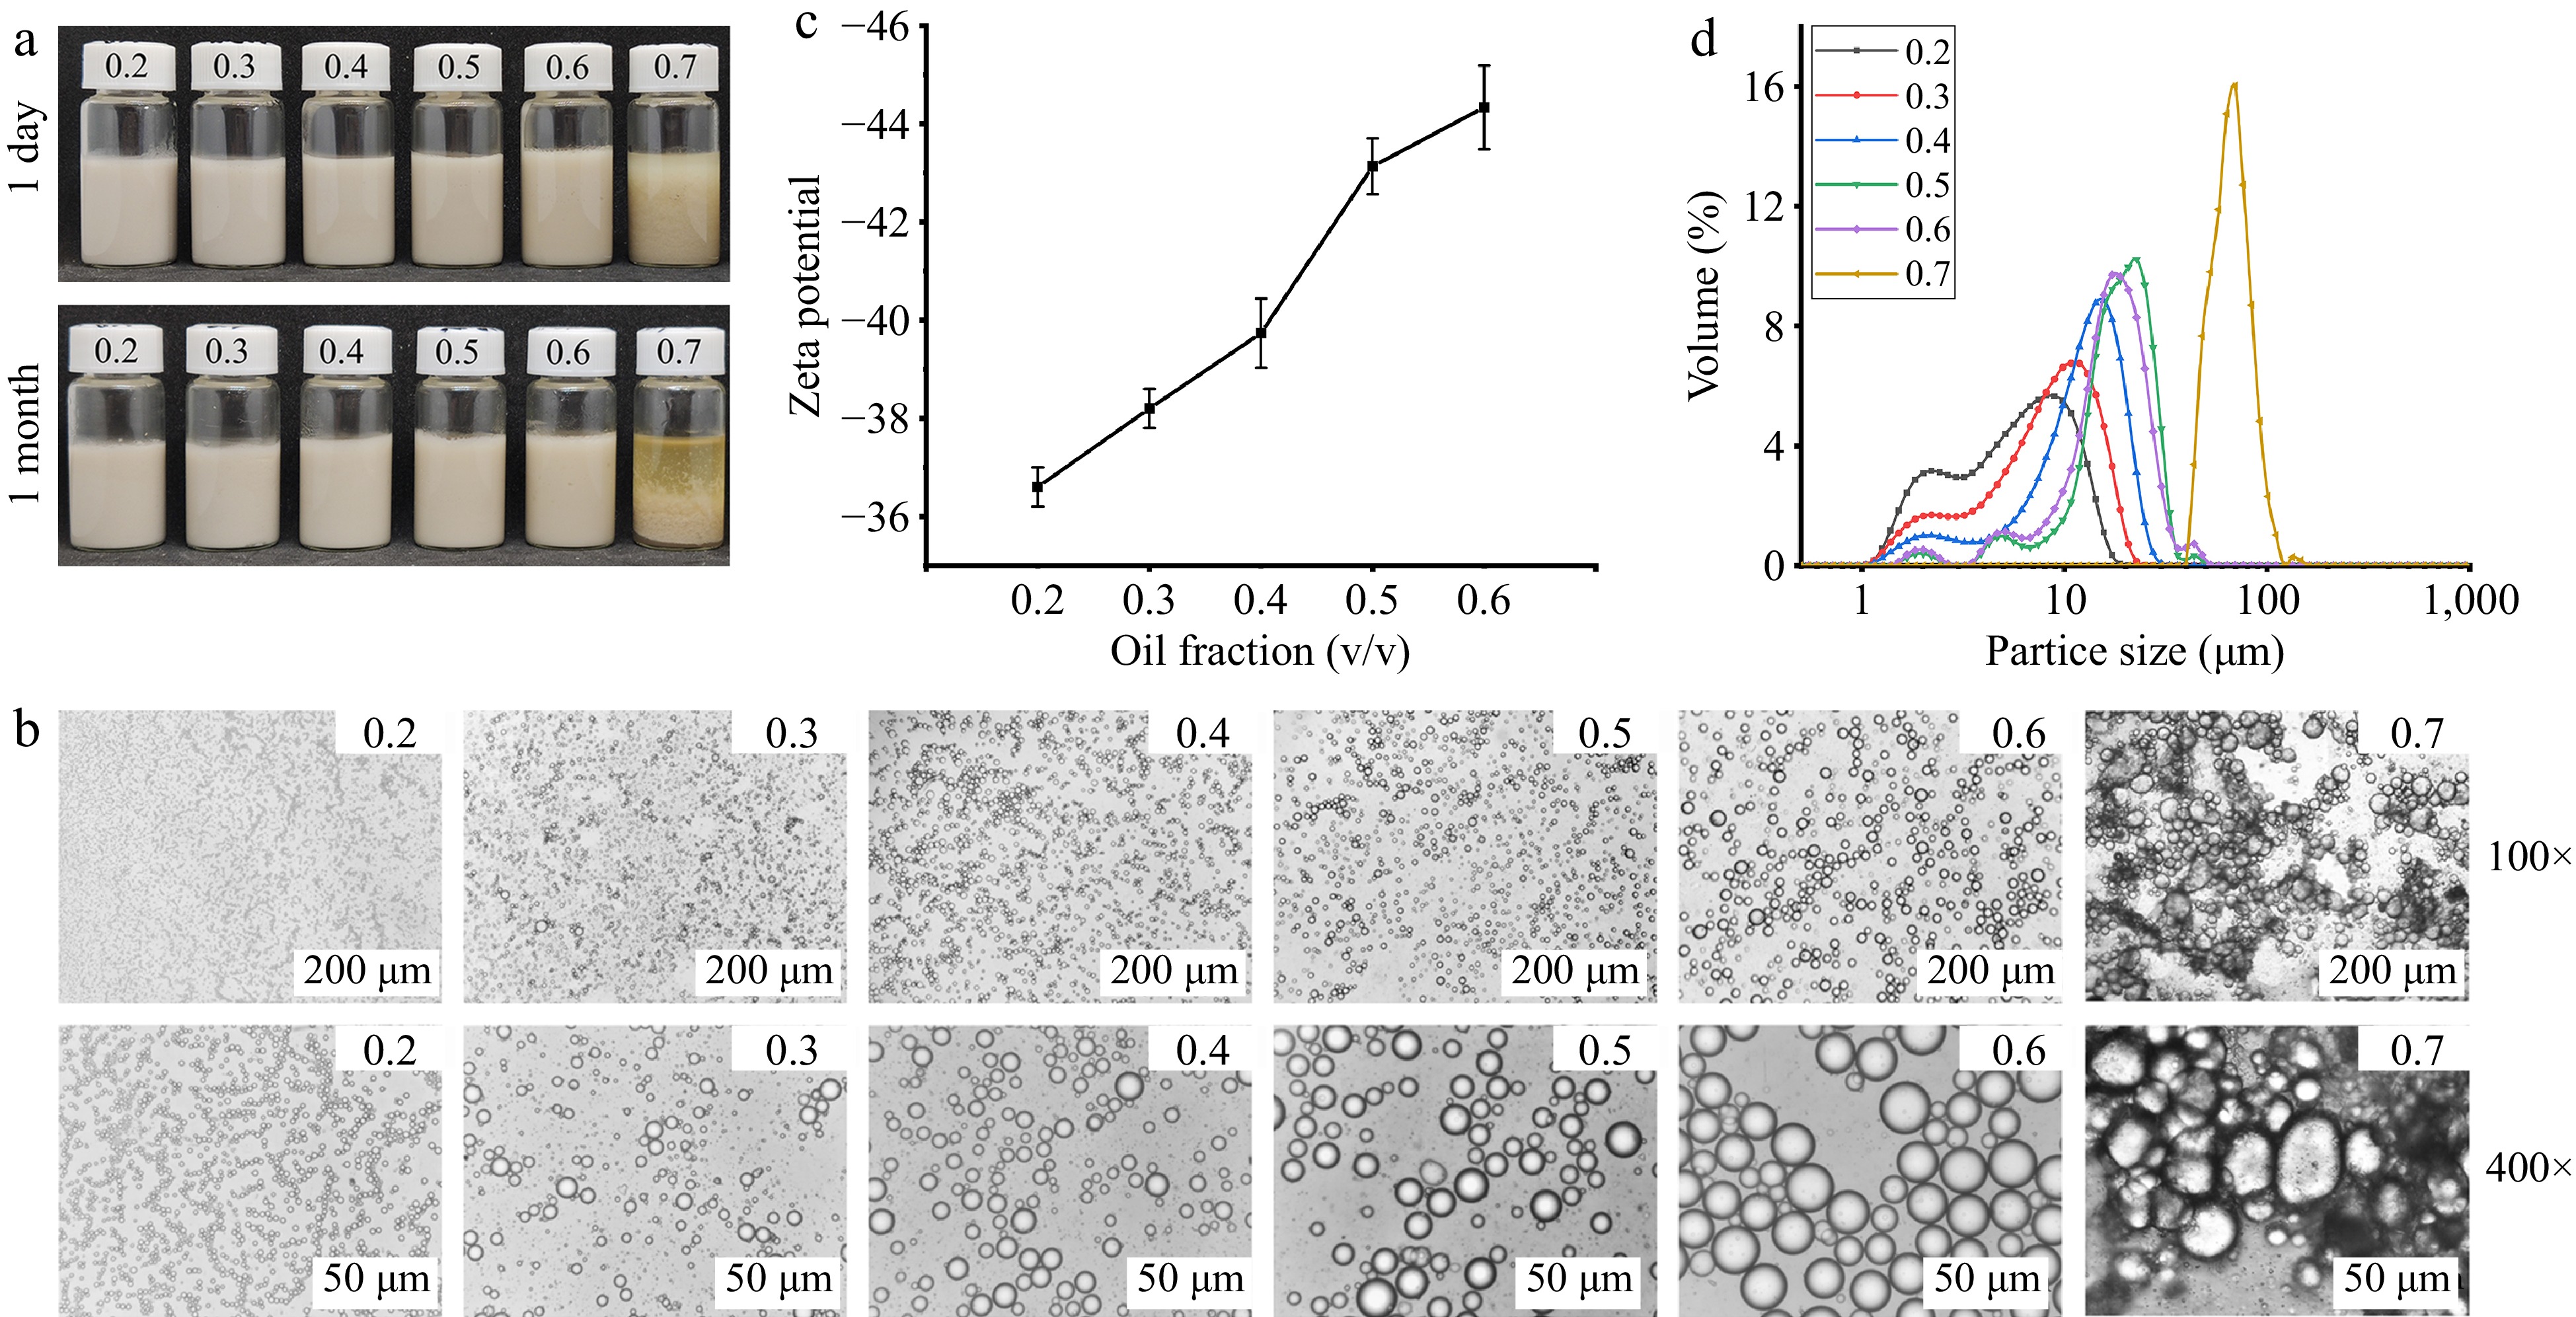
Figure 4.
Effect of oil phase volume fraction on the resting stability of emulsions. (a) Static stability of emulsion. (b) Micromorphology of emulsion. (c) Zeta potential. (d) Particle size distribution of emulsion.
-
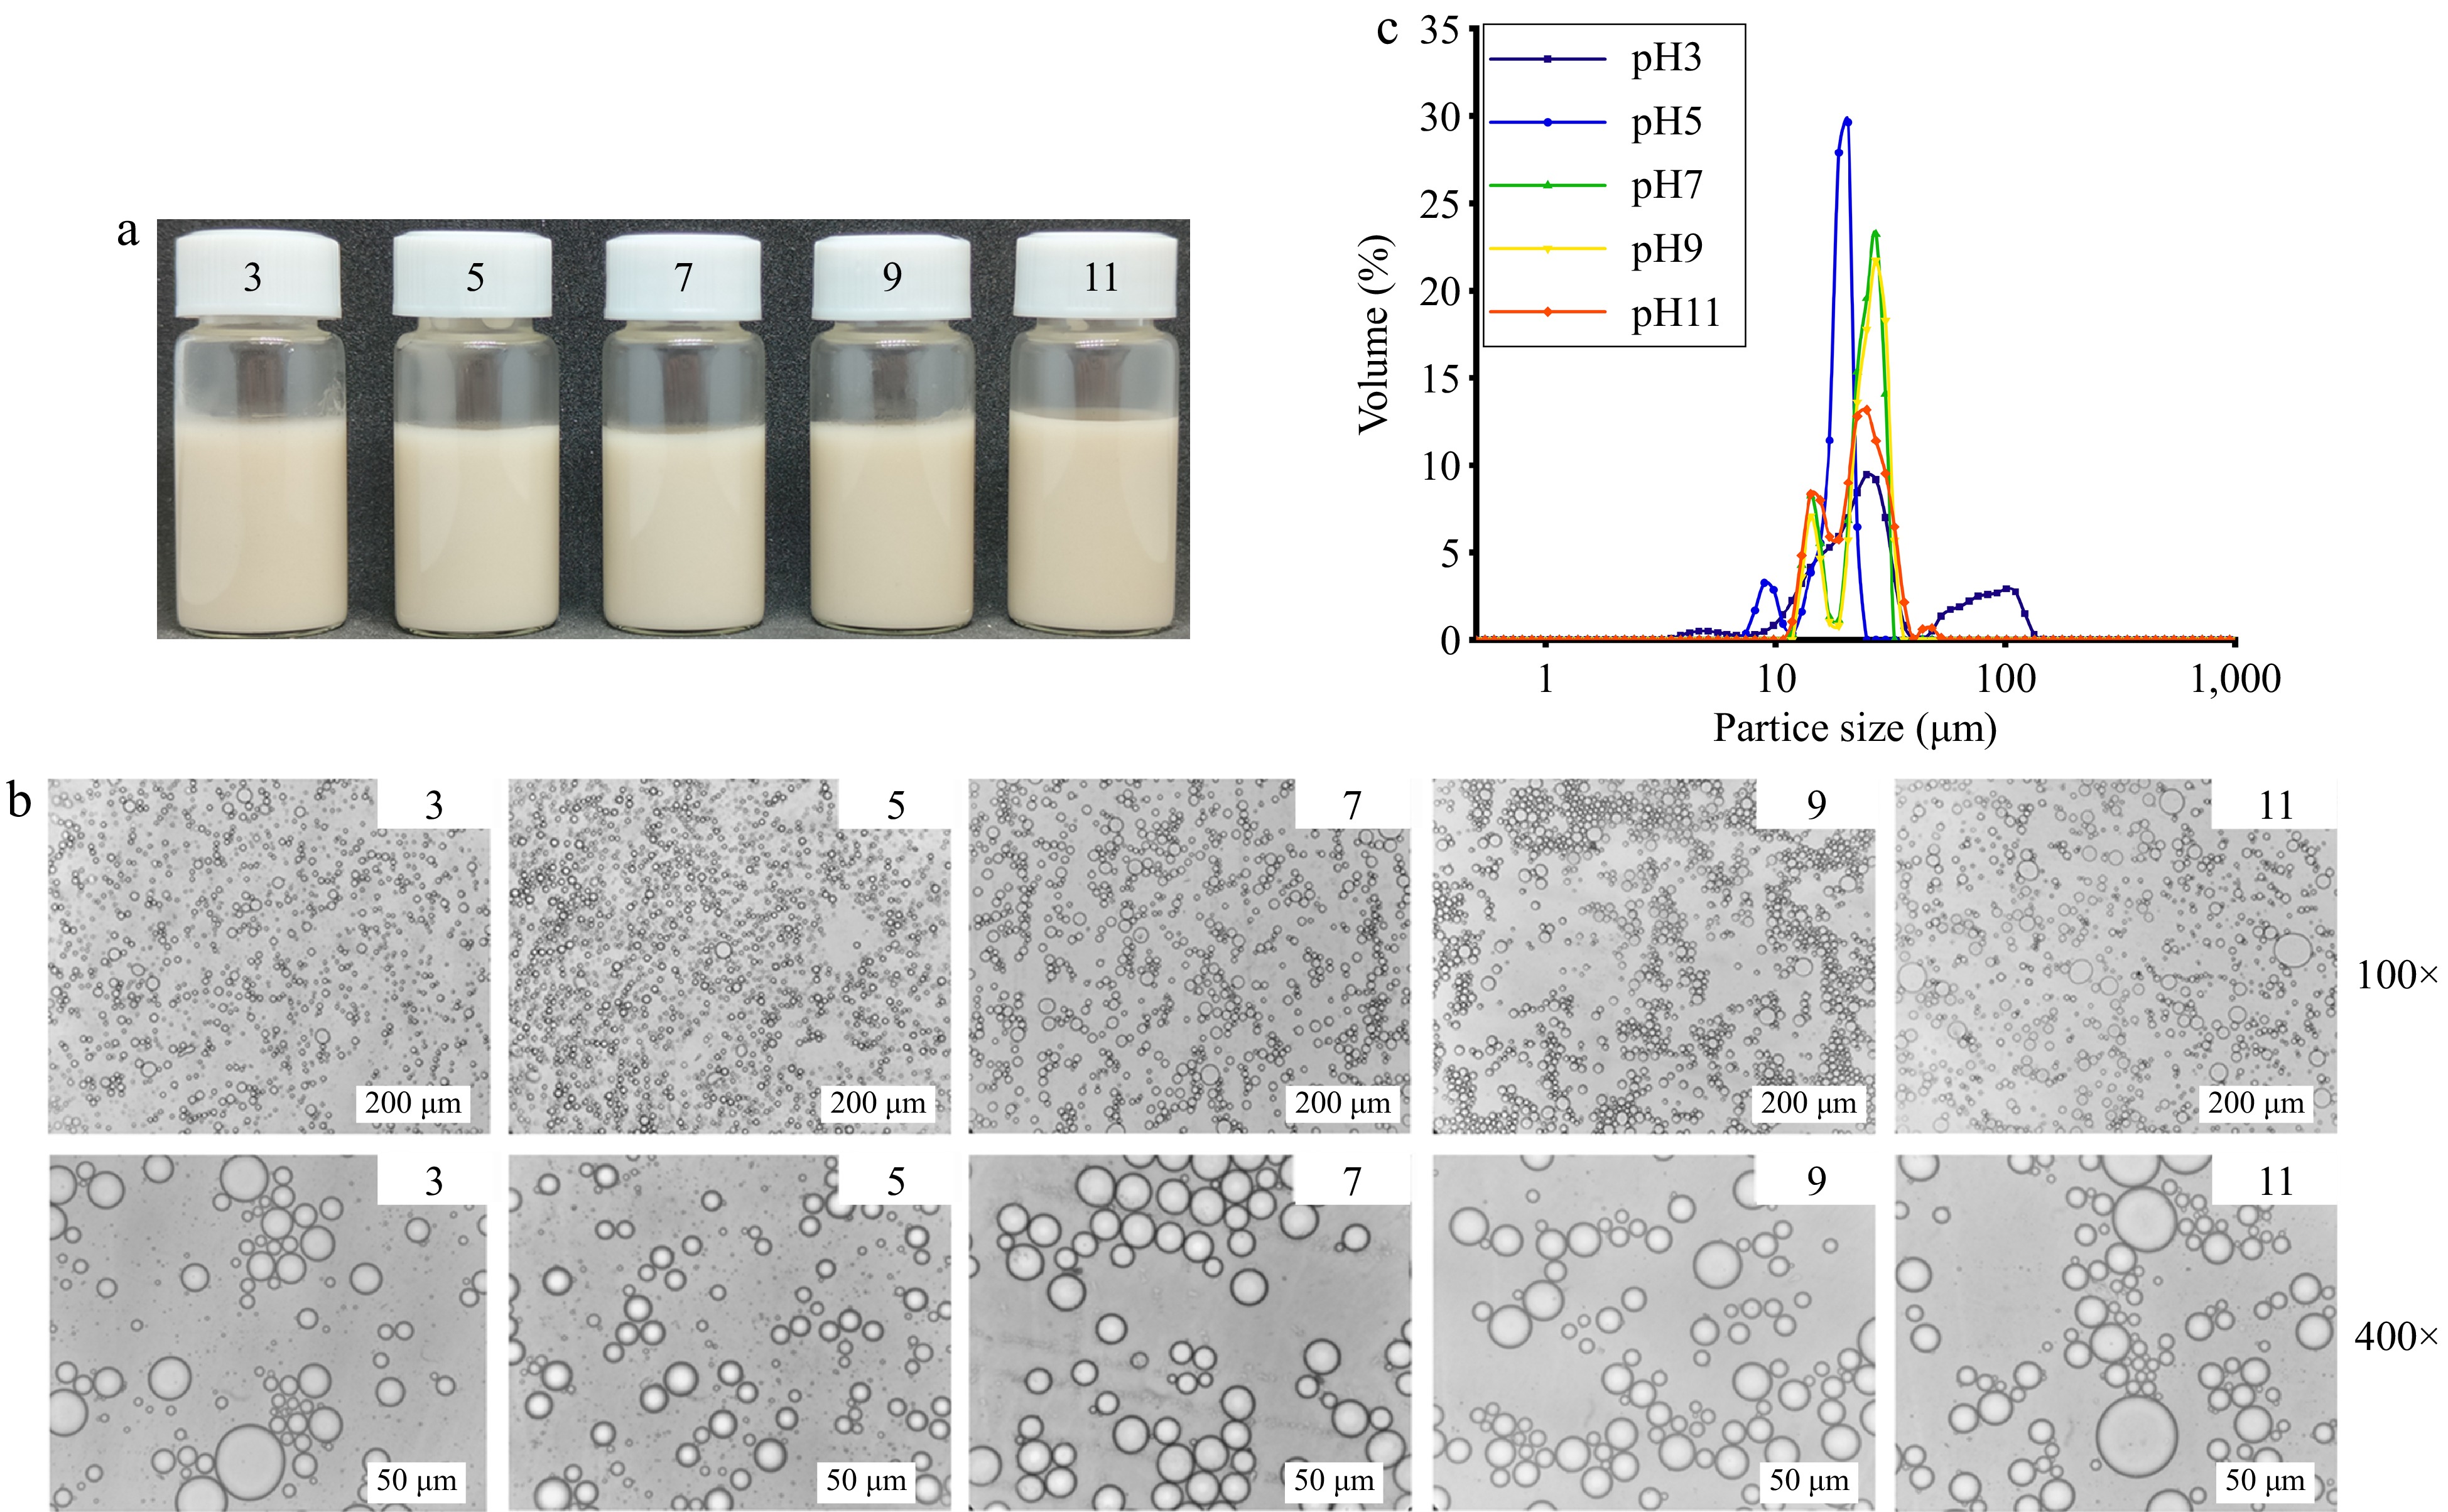
Figure 5.
Effect of pH on the stability of emulsions. (a) Static stability of emulsion. (b) Micromorphology of emulsion. (c) Particle size distribution of emulsion.
-
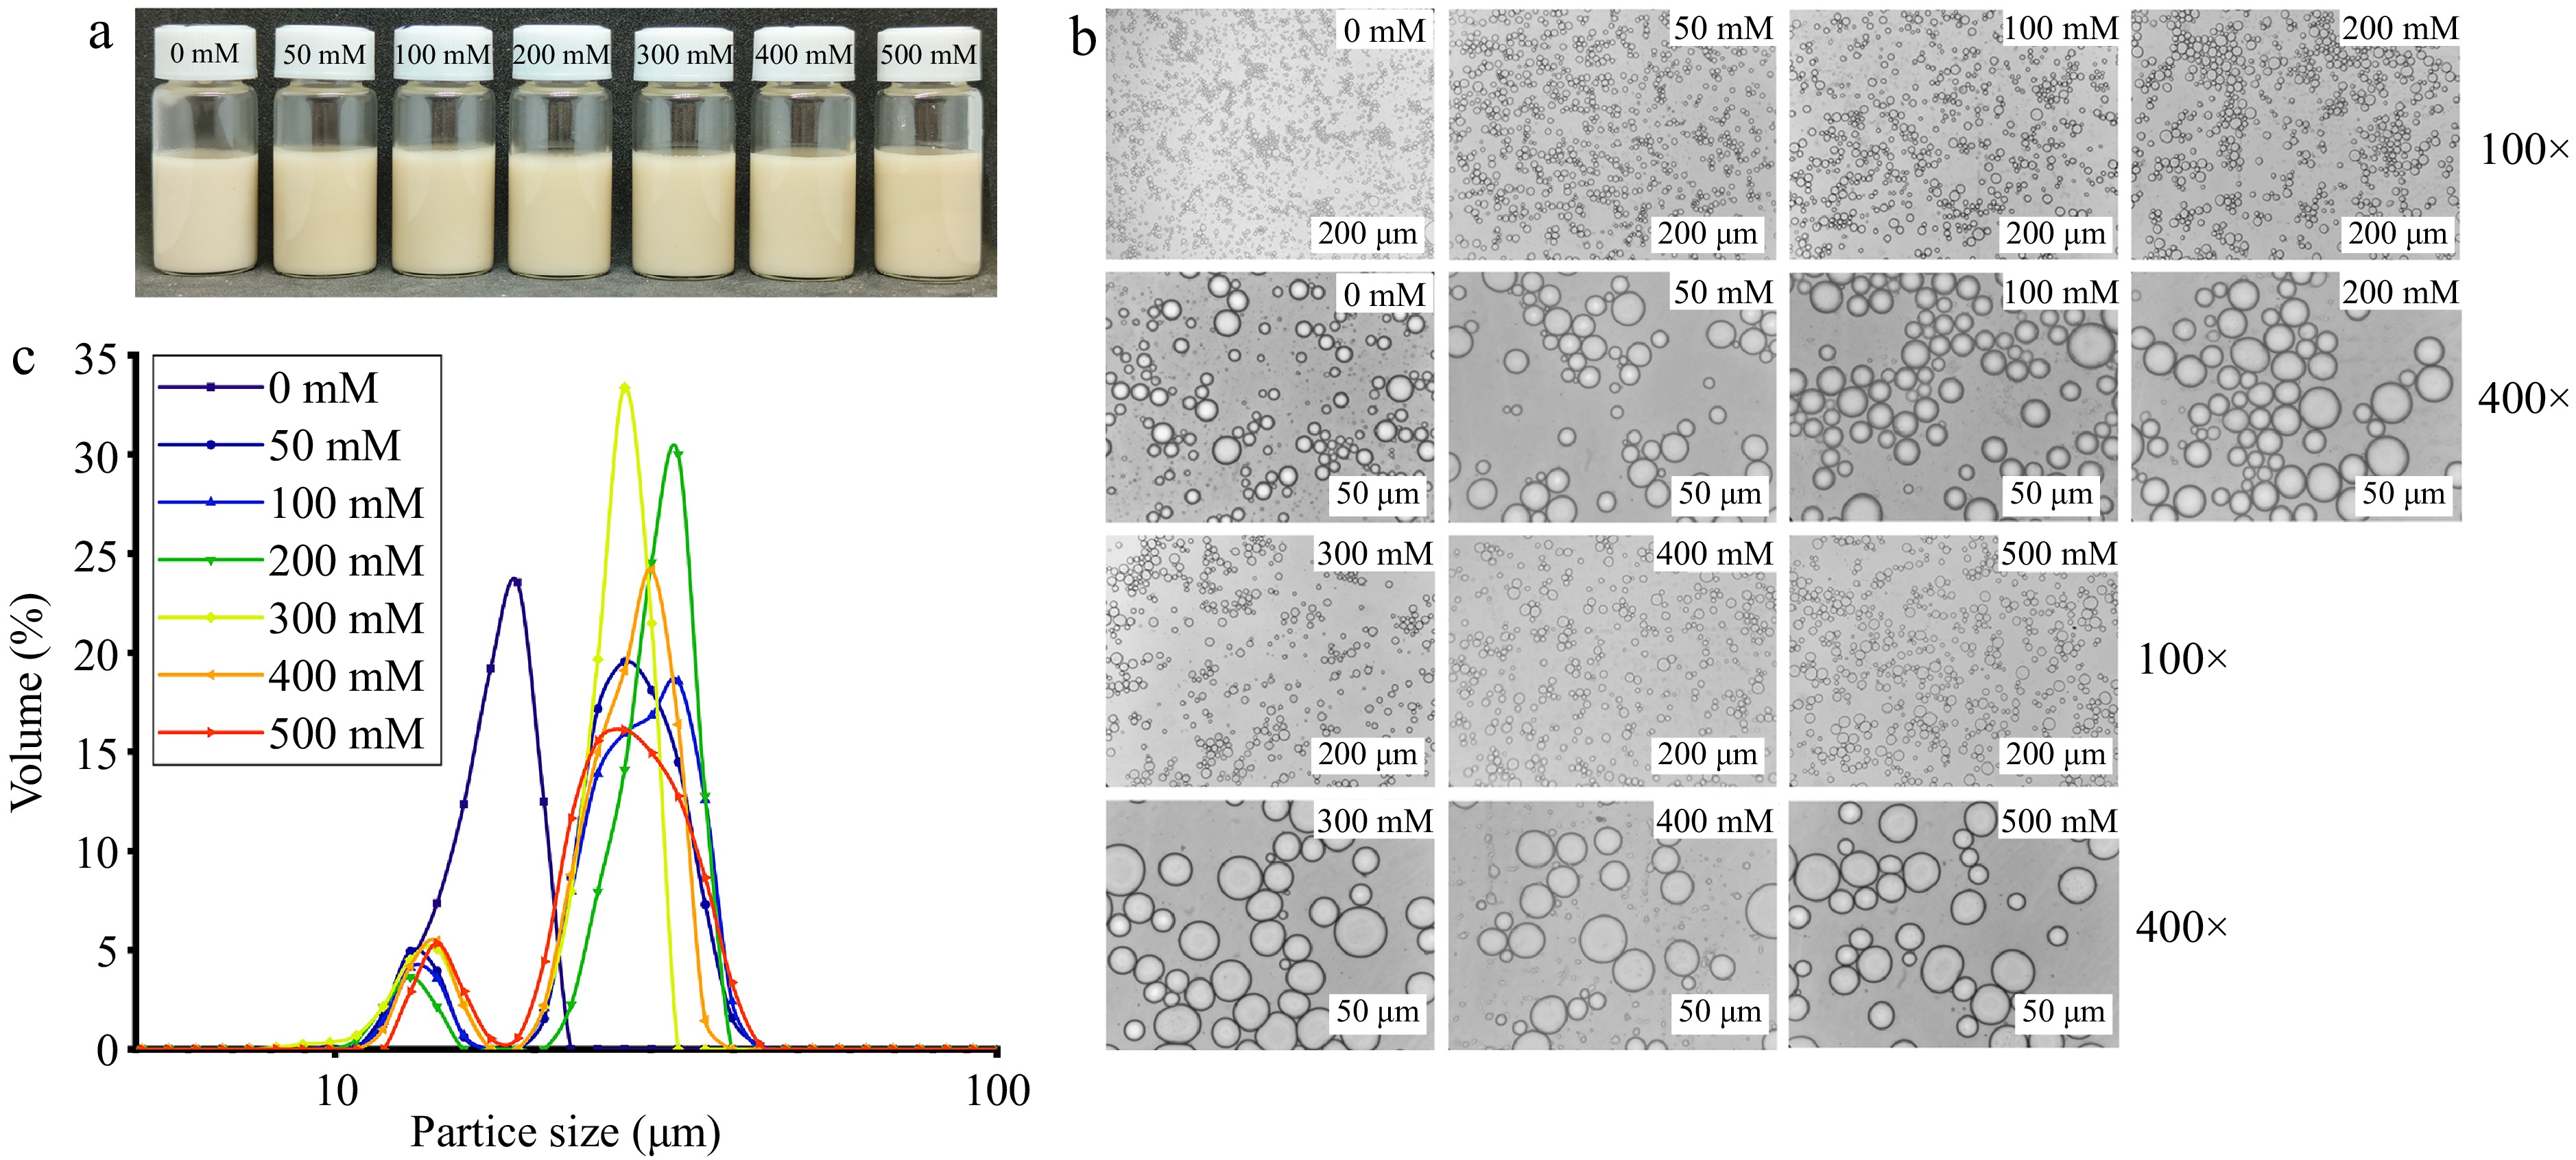
Figure 6.
Effect of salt ion concentration on the stability of emulsions. (a) Static stability of emulsion. (b) Micromorphology of emulsion. (c) Particle size distribution of emulsion.
-
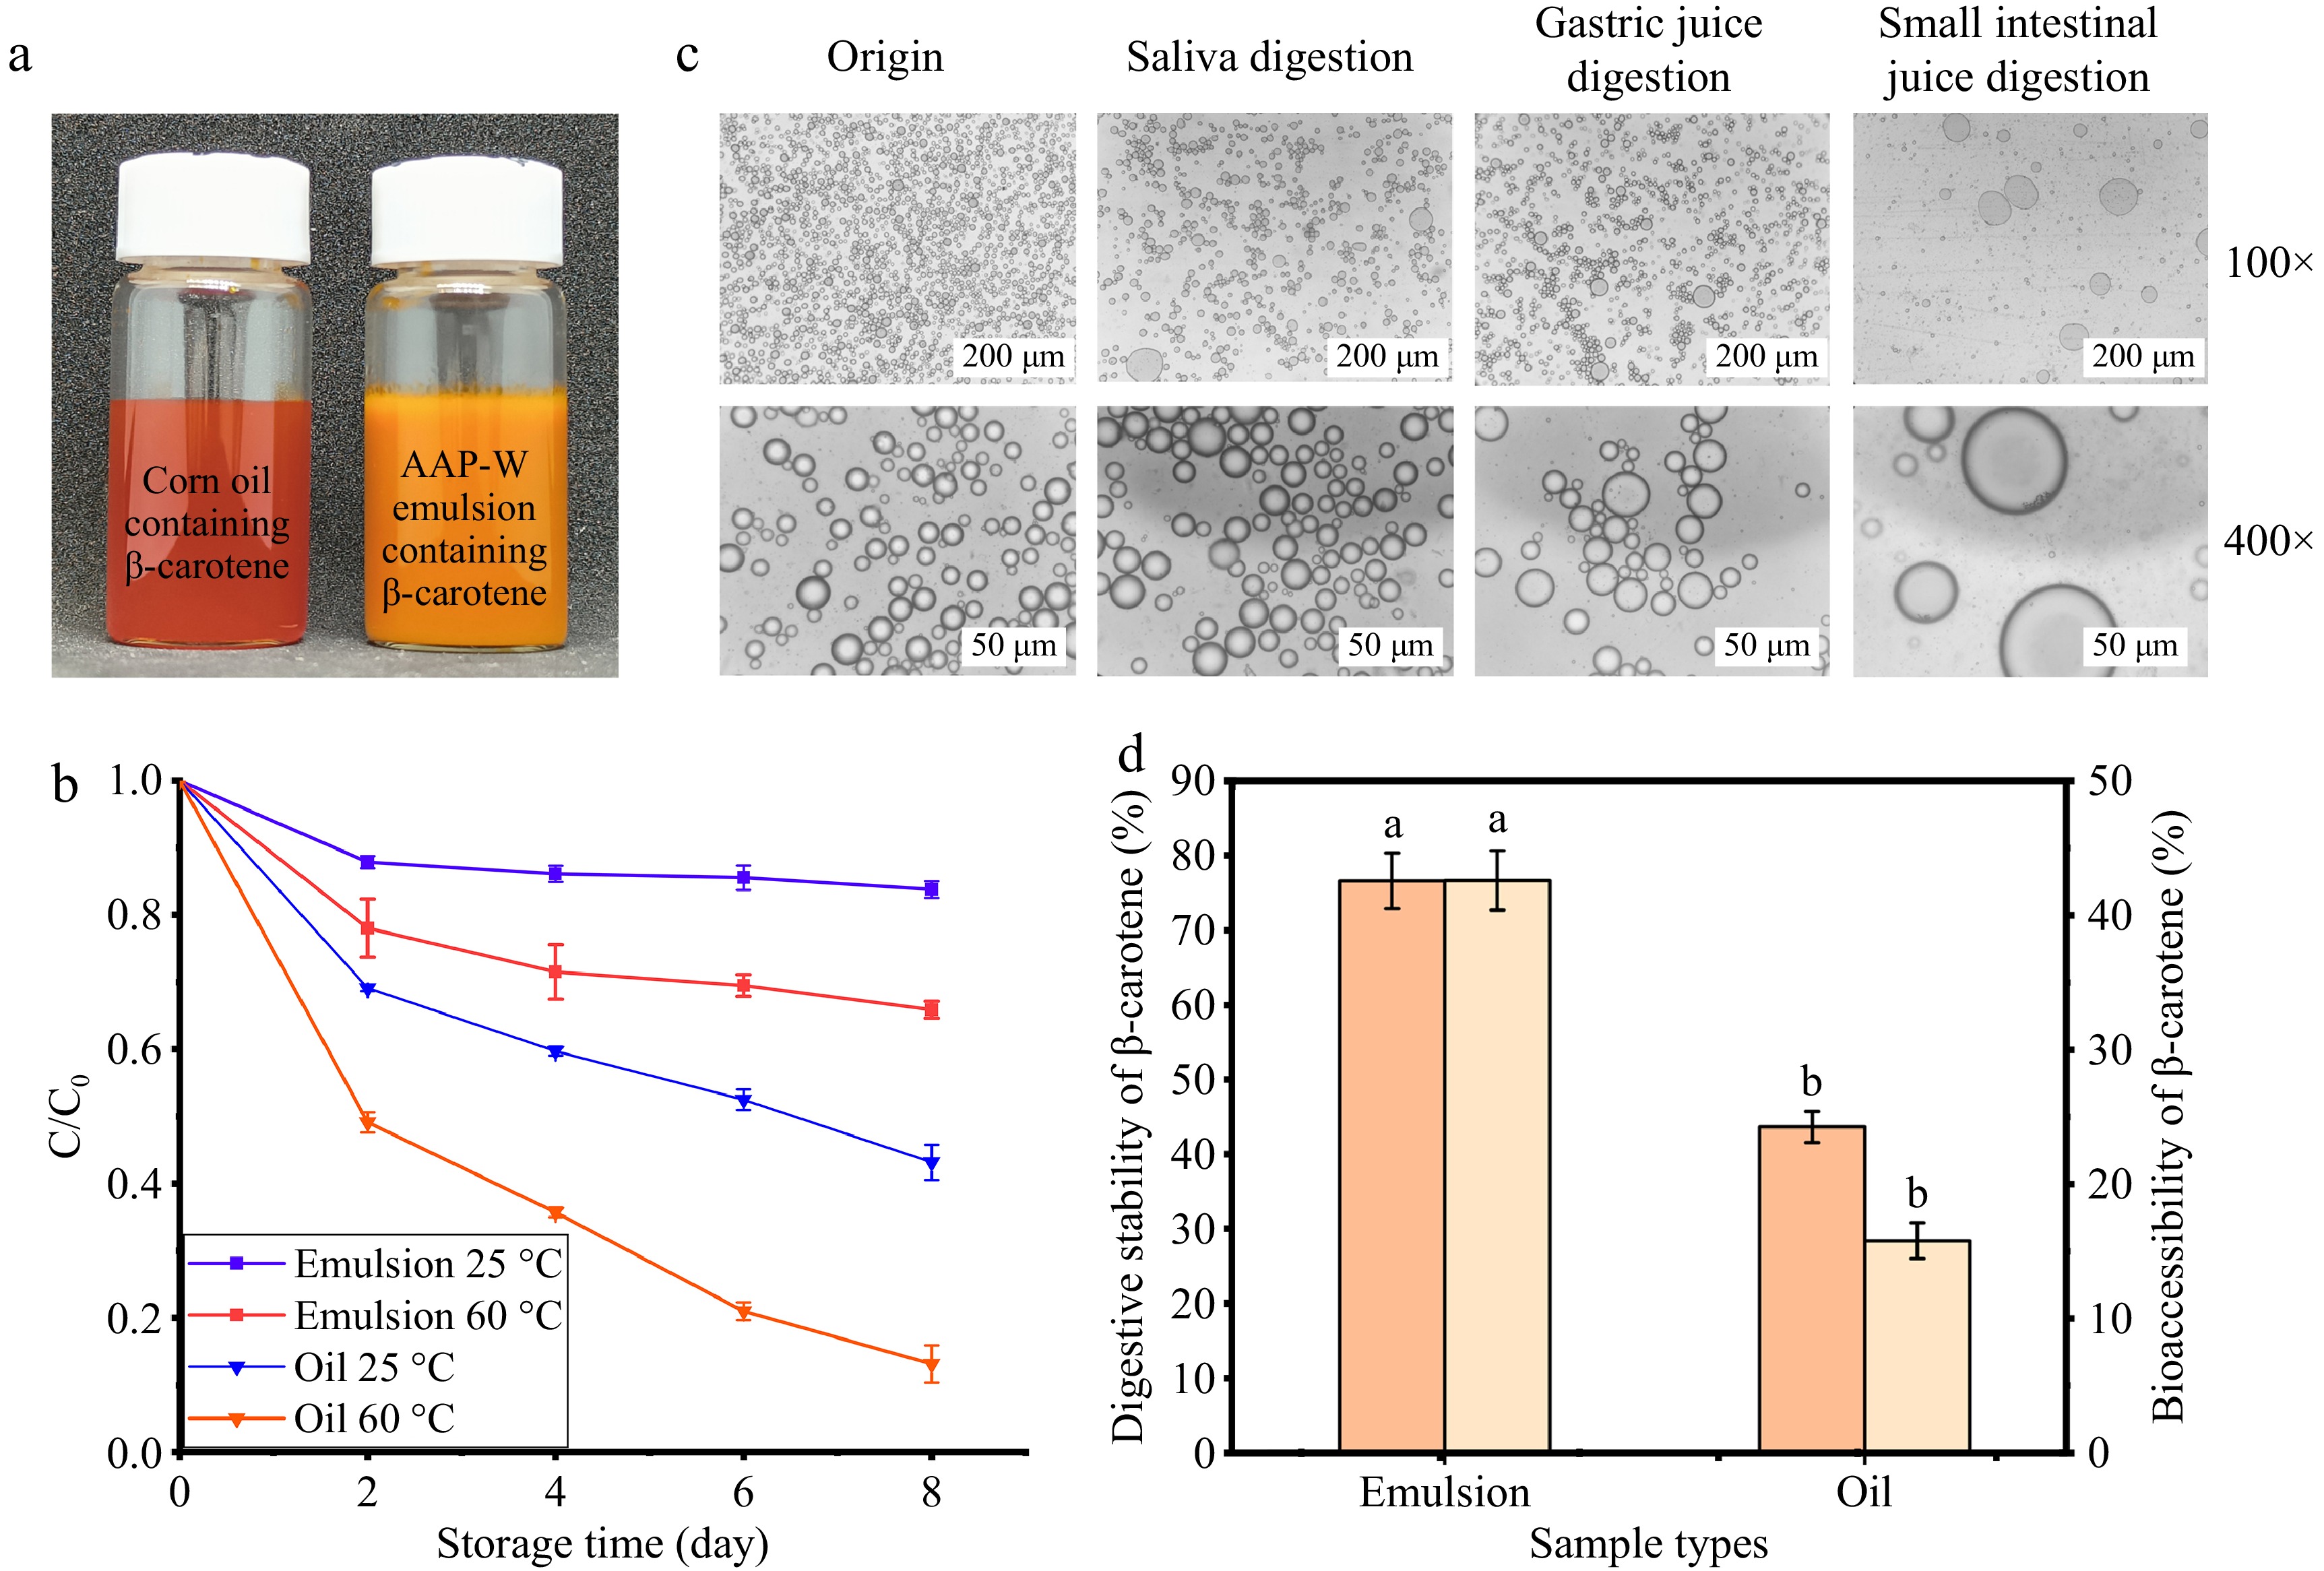
Figure 7.
Characterization of AAP-W emulsions loaded with β-carotene. (a) Load β-carotene corn oil and AAP-W emulsion. (b) Retention rate of β-carotene. (c) Changes of micromorphology of emulsion during in vitro digestion. (d) Digestive stability and bioavailability of β-carotene.
-
Yield (%) Total sugar (%) Protein (%) Alduronic acid (%) AAP-W 3.04 ± 0.90a 66.22 ± 0.15a 8.98 ± 1.26a 12.62 ± 0.17b AAP-A 1.31 ± 0.72b 59.69 ± 0.22c 5.04 ± 0.60b 13.23 ± 0.24a AAP-AL 3.78 ± 0.53a 61.48 ± 0.28b 5.48 ± 0.20b 10.13 ± 0.17c Identical letters denote no significant differences, whereas differing letters signify significant differences at p < 0.05. Table 1.
Yield, total sugar, protein, and alduronic acid content of AAP extracted by different methods.
-
Mn (Da) Mw (Da) Mw/Mn AAP-W 3.53 × 10⁵ ± 510a 6.72 × 10⁵ ± 360b 1.90 ± 0.4b AAP-A 1.72 × 10⁵ ± 380c 1.01 × 10⁶ ± 310a 5.89 ± 0.9a AAP-AL 3.16 × 10⁵ ± 490b 6.56 × 10⁵ ± 450c 2.07 ± 0.5b Identical letters signify no significant differences, while differing letters indicate significant differences at a significance level of p < 0.05. Table 2.
Molecular weight and polydispersity coefficient of AAP under different extraction methods.
-
Monosaccharide composition (%) AAP-W AAP-A AAP-AL Man 38.369 35.227 39.243 Rib 2.581 2.022 2.107 Rha 0.217 0.311 0.258 GlcA 4.787 4.45 4.193 GalA 0.133 0.144 0.142 Glc 46.76 49.124 44.479 Gal 2.217 3.481 3.272 Xyl 1.203 1.913 1.957 Ara 0.271 0.167 0.992 Fuc 3.462 3.16 3.356 Table 3.
Monosaccharide composition of AAP under different extraction methods.
Figures
(7)
Tables
(3)