-
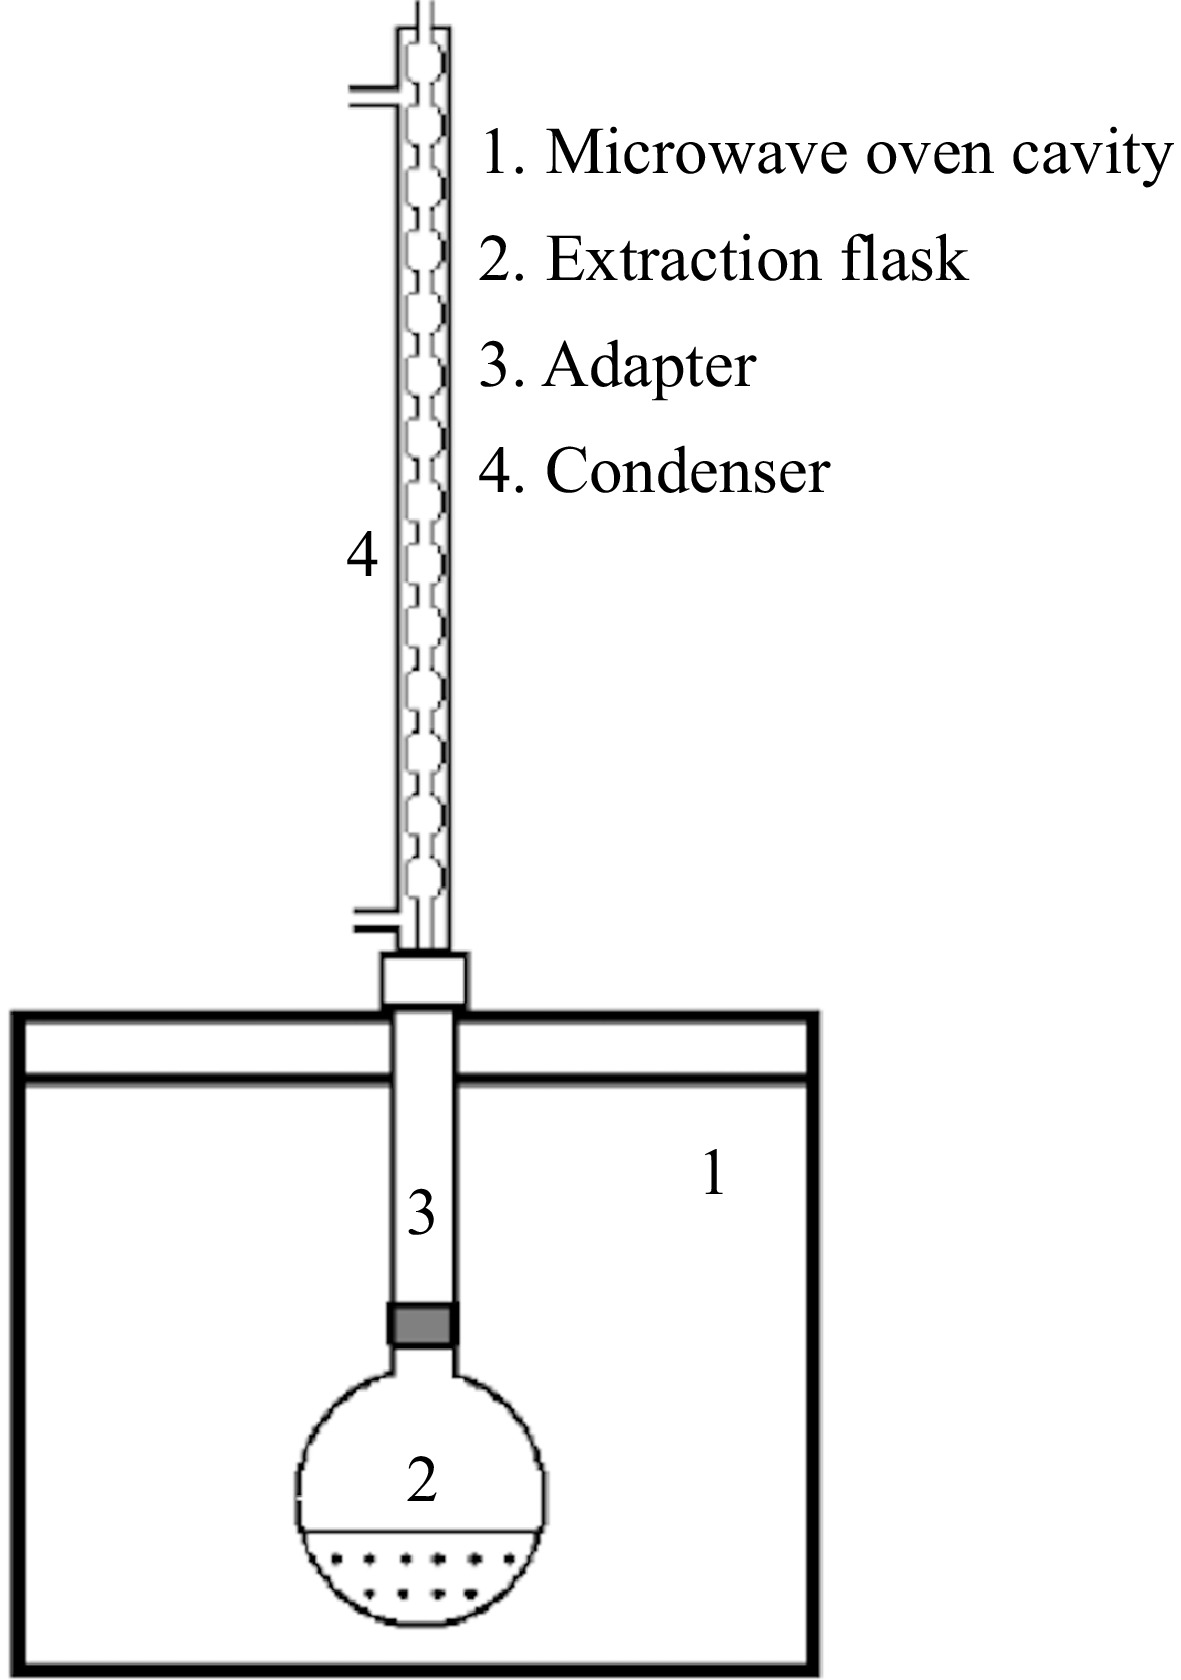
Figure 1.
Diagram of the microwave-assisted extraction equipment.
-
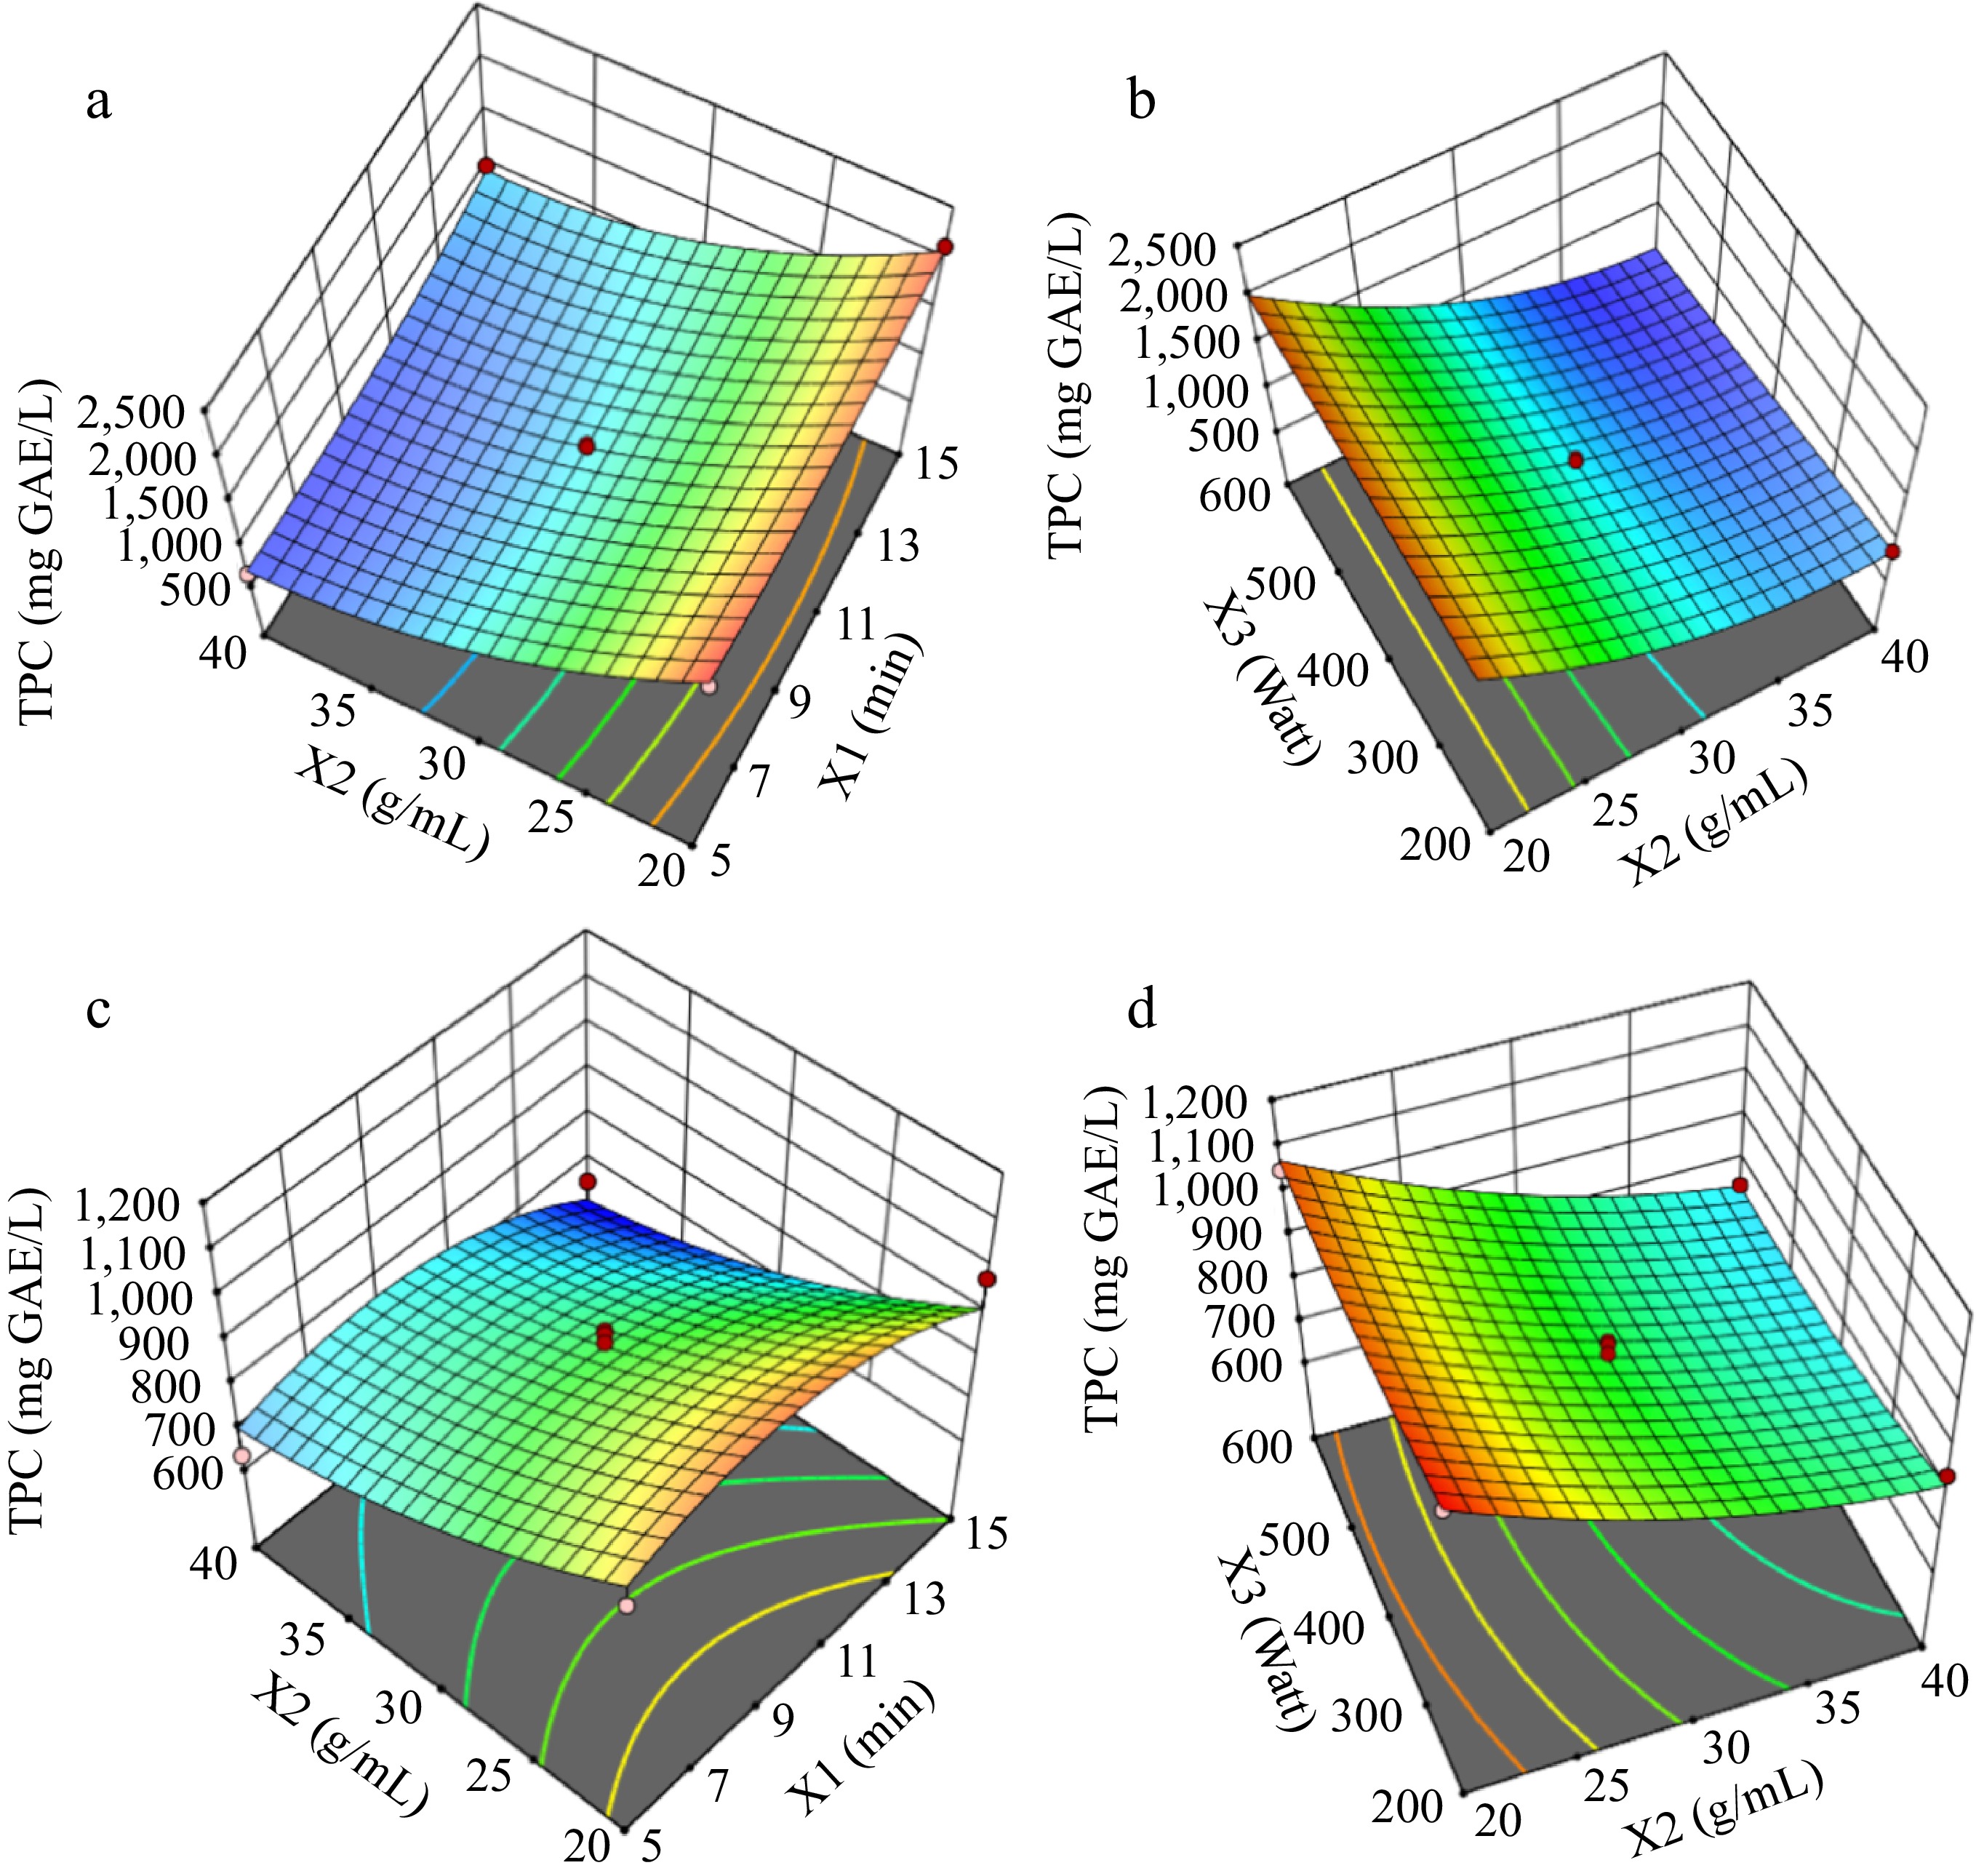
Figure 2.
Response surfaces for TPC graphs (a) and (b) are for solvent : water; graphs (c) and (d) are for solvent : ethanol-water.
-
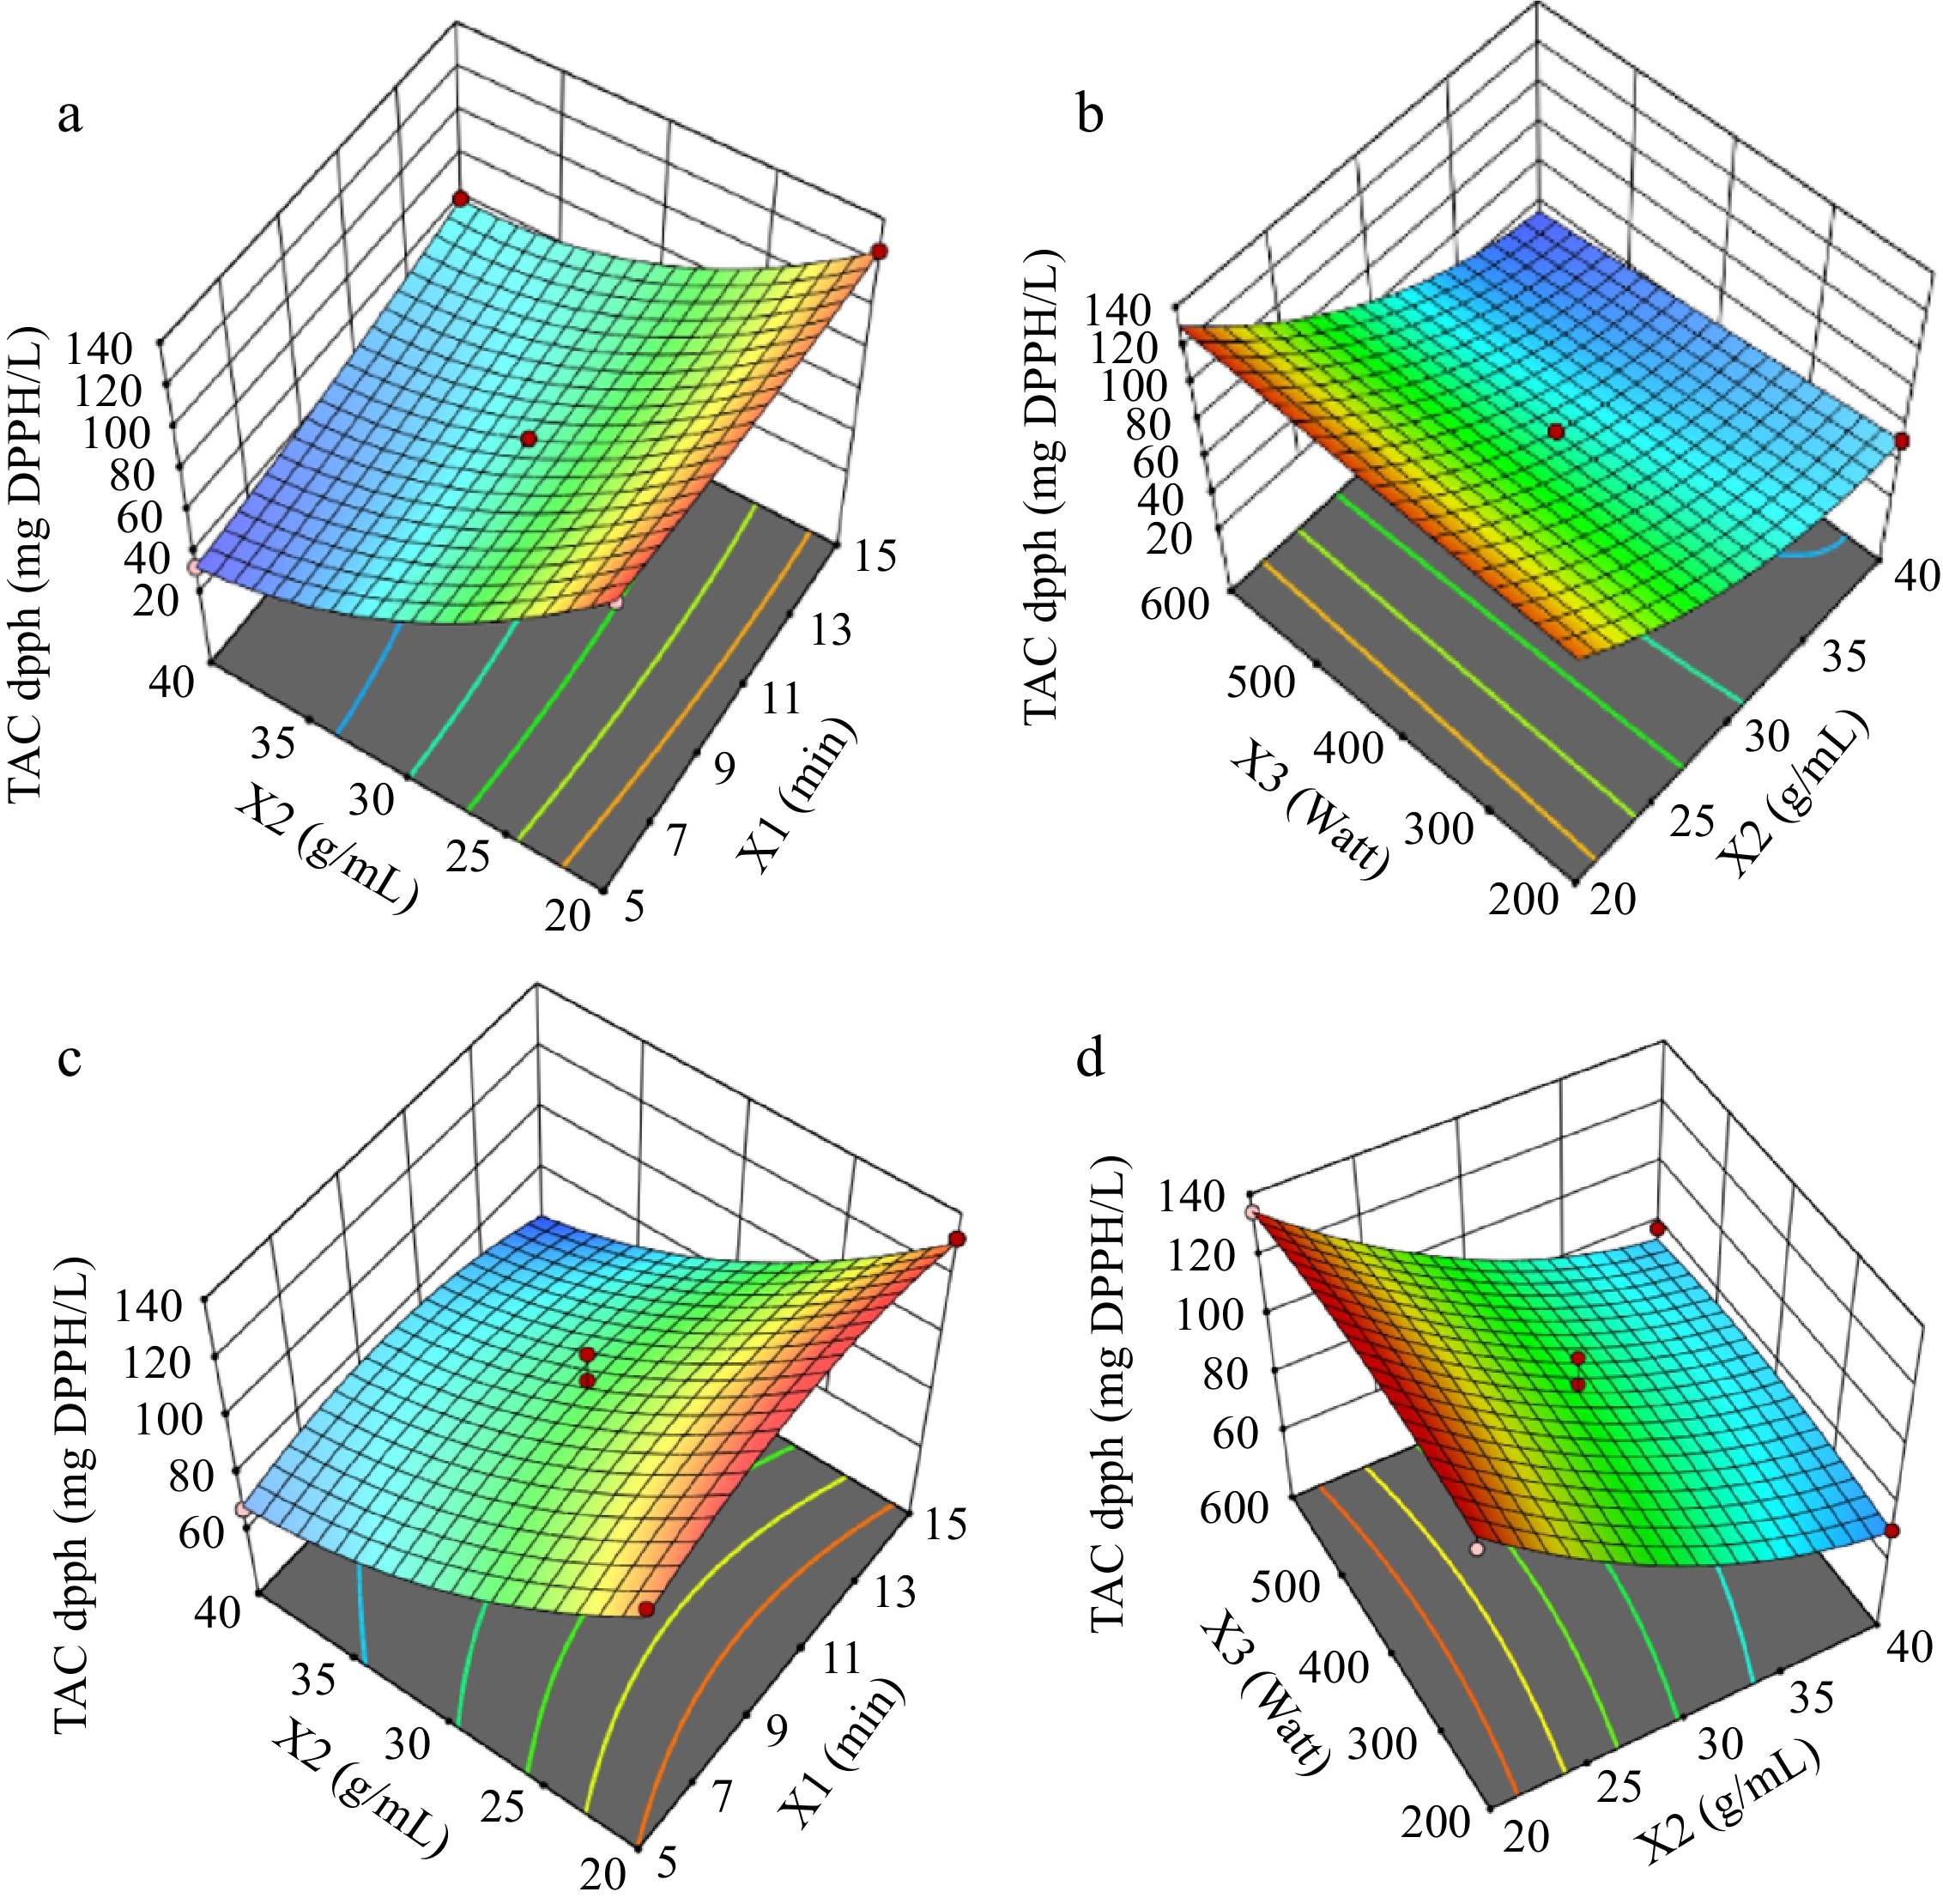
Figure 3.
Response surfaces for TACDPPH, graphs (a) and (b) are for solvent:water; graphs (c) and (d) are for solvent:ethanol-water.
-
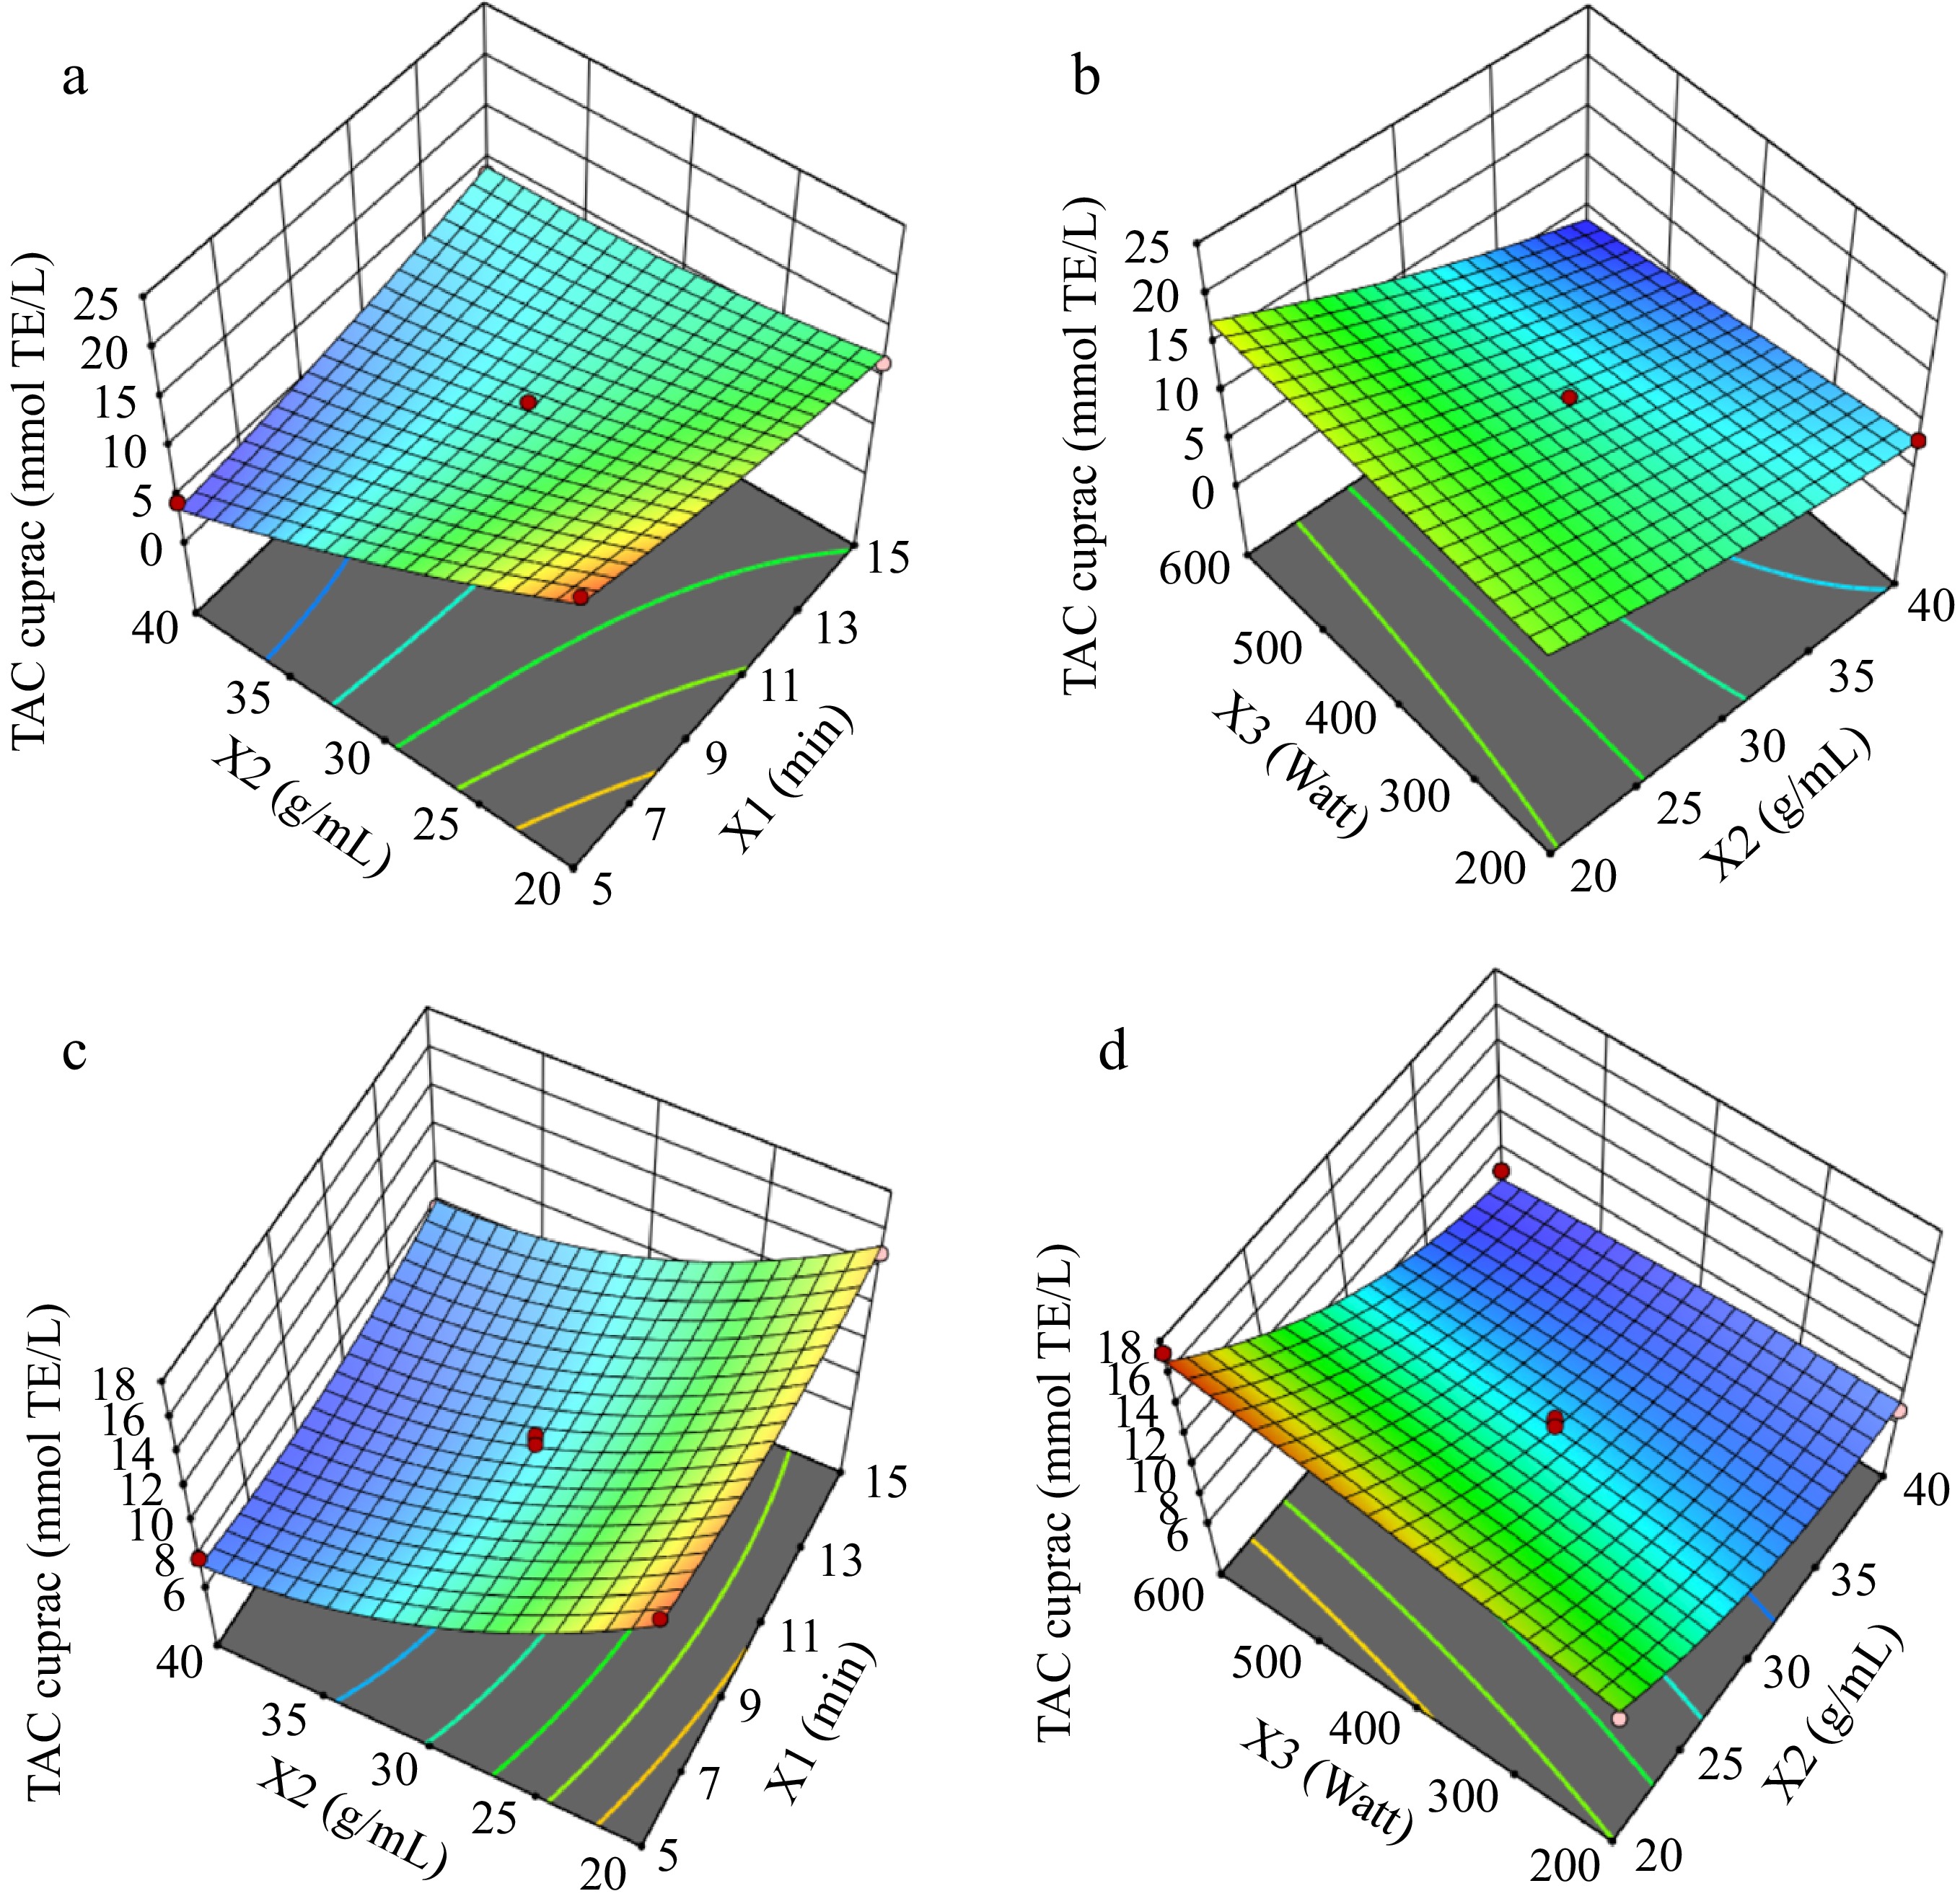
Figure 4.
Response surfaces for TACCUPRAC graphs (a) and (b) are for solvent : water; graphs (c) and (d) are for solvent : ethanol-water.
-
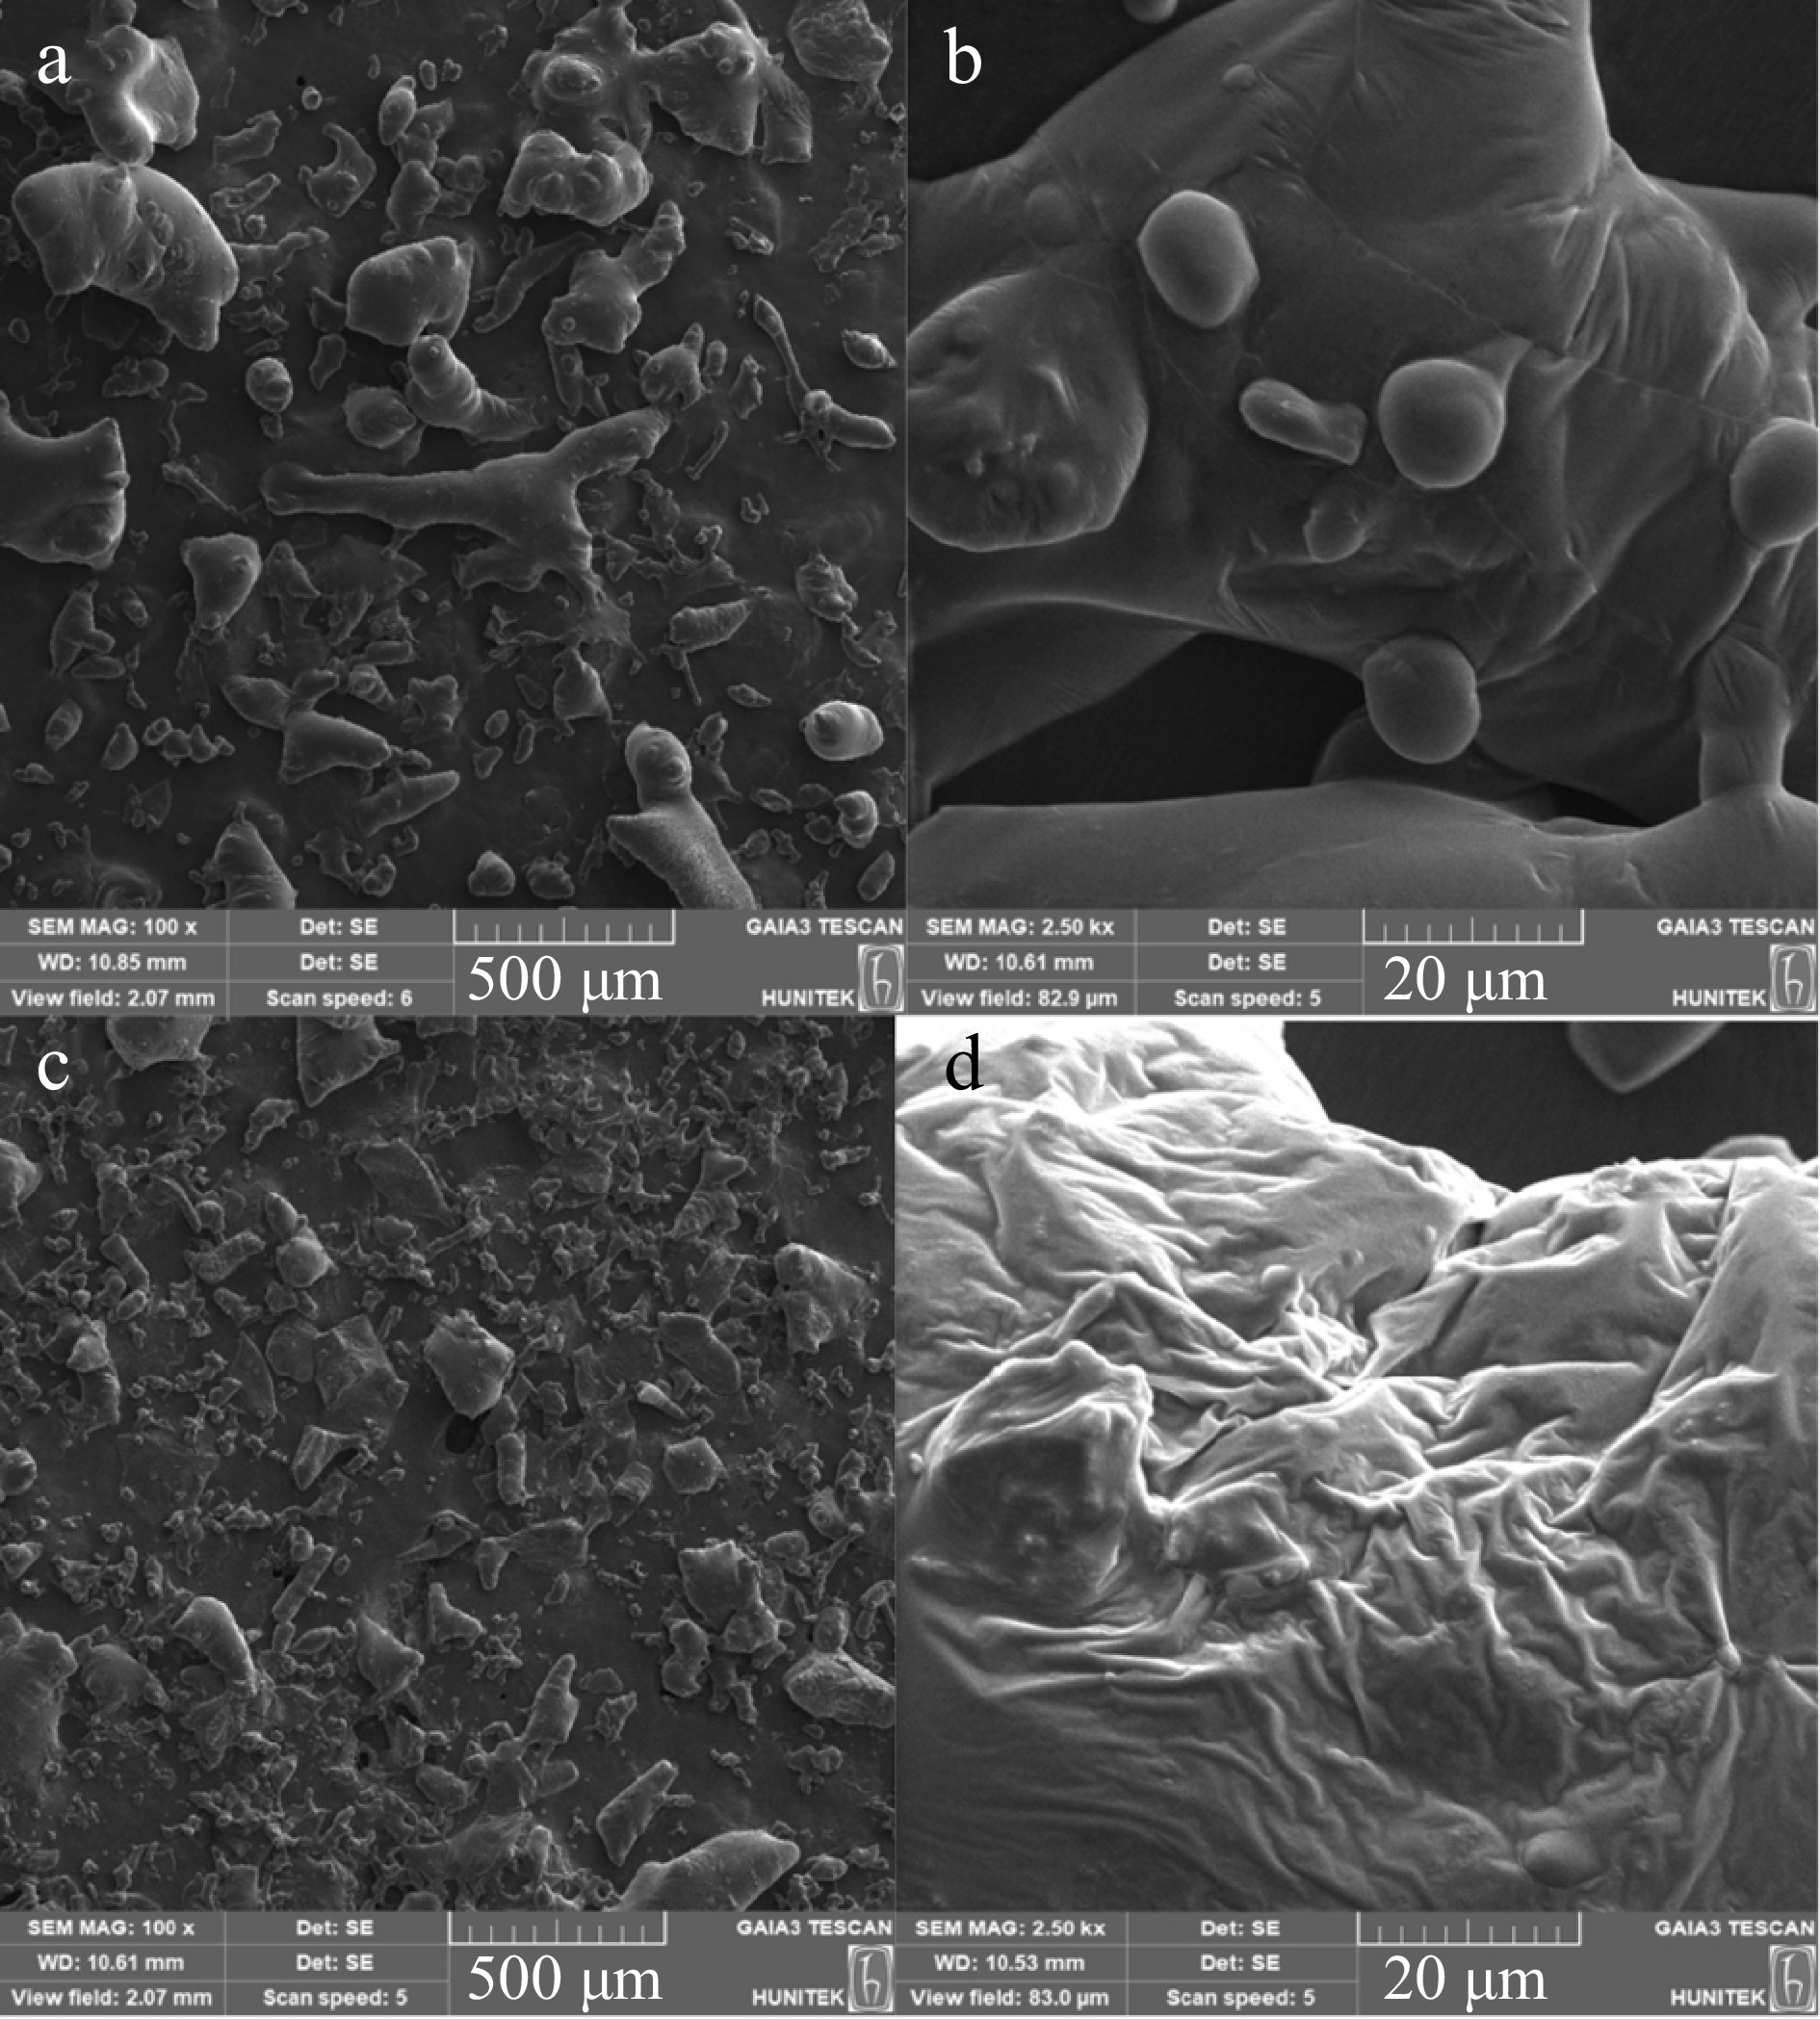
Figure 5.
SEM images of red cabbage extracts. (a) Red cabbage extract from CE (100×), (b) red cabbage extract from CE (2,500×), (c) red cabbage extract from MAE (100×), (d) red cabbage extract from MAE (2,500×)
-
Independent variables Code levels −1 0 1 Extraction time (X1, min) 5 10 15 Solid : solvent ratio (X2, 1/X) 20 30 40 Microwave power (X3, W) 200 400 600 Table 1.
Coded and actual values of the independent variables.
-
Source Sum of squares df Mean square F-value p-value Model (TPC) 2.34E+06 8 2.92E+05 67.92 0.0001 Significant X1 20274.94 1 20274.94 4.72 0.0819 X2 1.69E+06 1 1.69E+06 392.13 < 0.0001 X3 22967.4 1 22967.4 5.34 0.0688 X1X2 22734.61 1 22734.61 5.29 0.0698 X1X3 12778.04 1 12778.04 2.97 0.1453 X2X3 3159.87 1 3159.87 0.7352 0.4304 X12 26836.11 1 26836.11 6.24 0.0546 X22 2.33E+05 1 2.33E+05 54.26 0.0007 X32 0 0 Residual 21488.64 5 4297.73 Lack of fit 14143.94 1 14143.94 7.7 0.0501 Not significant Pure error 7344.7 4 1836.18 Cor total 2.36E+06 13 Model (TACDPPH) 9307.92 8 1163.49 4871.42 < 0.0001 Significant X1 193.06 1 193.06 808.33 < 0.0001 X2 6939.72 1 6939.72 29055.95 < 0.0001 X3 29.43 1 29.43 123.22 0.0001 X1X2 306.43 1 306.43 1282.97 < 0.0001 X1X3 262.93 1 262.93 1100.85 < 0.0001 X2X3 16.56 1 16.56 69.31 0.0004 X12 14.59 1 14.59 61.1 0.0005 X22 708.01 1 708.01 2964.36 < 0.0001 X32 0 0 Residual 1.19 5 0.2388 Lack of fit 0.5408 1 0.5408 3.31 0.143 Not significant Pure error 0.6534 4 0.1633 Cor total 9309.12 13 Model (TACCUPRAC) 184.87 8 23.11 16.62 0.0033 Significant X1 5.4 1 5.4 3.88 0.106 X2 109.62 1 109.62 78.82 0.0003 X3 1.45 1 1.45 1.04 0.3537 X1X2 55.2 1 55.2 39.7 0.0015 X1X3 1.78 1 1.78 1.28 0.309 X2X3 1.23 1 1.23 0.8834 0.3904 X12 0.7006 1 0.7006 0.5038 0.5096 X22 1.42 1 1.42 1.02 0.3587 X32 0 0 Residual 6.95 5 1.39 Lack of fit 3.91 1 3.91 5.13 0.0863 Not significant Pure error 3.05 4 0.7619 Cor total 191.83 13 Table 2.
ANOVA for the quadratic equations of Design Expert 12.0.1 for MAE of TPC, TACDPPH, and TACCUPRAC in red cabbage and statistical indicators for each response (solvent : water).
-
Source Sum of squares df Mean square F-value p-value Model (TPC) 2.80E+05 9 31099.63 7.02 0.0088 Significant X1 19499.18 1 19499.18 4.4 0.0741 X2 1.93E+05 1 1.93E+05 43.66 0.0003 X3 6063.76 1 6063.76 1.37 0.2803 X1X2 2.36 1 2.36 0.0005 0.9822 X1X3 7959.32 1 7959.32 1.8 0.222 X2X3 359.1 1 359.1 0.0811 0.7841 X12 42236.73 1 42236.73 9.53 0.0176 X22 9986.68 1 9986.68 2.25 0.1769 X32 2963.88 1 2963.88 0.669 0.4403 Residual 31011.78 7 4430.25 Lack of fit 25791.29 3 8597.1 6.59 0.0501 Not significant Pure error 5220.5 4 1305.12 Cor total 3.11E+05 16 Model (TACDPPH) 8898.31 9 988.7 21.78 0.0003 Significant X1 0.2048 1 0.2048 0.0045 0.9483 X2 7871.99 1 7871.99 173.4 < 0.0001 X3 7.09 1 7.09 0.1561 0.7045 X1X2 19.98 1 19.98 0.4401 0.5283 X1X3 3.96 1 3.96 0.0872 0.7763 X2X3 3.55 1 3.55 0.0783 0.7877 X12 432.95 1 432.95 9.54 0.0176 X22 533.11 1 533.11 11.74 0.011 X32 75.26 1 75.26 1.66 0.2388 Residual 317.79 7 45.4 Lack of fit 66.7 3 22.23 0.3542 0.7899 Not significant Pure error 251.08 4 62.77 Cor total 9216.09 16 Model (TACCUPRAC) 167.95 9 18.66 25.72 0.0001 Significant X1 0.4512 1 0.4512 0.622 0.4562 X2 137.7 1 137.7 189.81 < 0.0001 X3 2.59 1 2.59 3.57 0.1009 X1X2 1.24 1 1.24 1.71 0.2318 X1X3 0.0462 1 0.0462 0.0637 0.808 X2X3 5.62 1 5.62 7.74 0.0272 X12 3.09 1 3.09 4.26 0.0779 X22 16.41 1 16.41 22.63 0.0021 X32 0.1155 1 0.1155 0.1592 0.7018 Residual 5.08 7 0.7254 Lack of fit 3.32 3 1.11 2.51 0.1973 Not significant Pure error 1.76 4 0.44 Cor Total 173.03 16 Table 3.
ANOVA for the quadratic equations of Design Expert 12.0.1 for MAE of TPC, TACDPPH, and TACCUPRAC in red cabbage and statistical indicators for each response (solvent : ethanol-water, 50:50, v:v).
-
Temperature (°C) Time (h) Solvent* TPC (mg GAE/L) TACCUPRAC (mmol TE/L) TACDPPH (mg DPPH/L) 40 4 w 1018.5 ± 1.28D 8.9 ± 0.03B 33.1 ± 0.75B 6 1165.9 ± 1.29C 11.2 ± 0.02A 54.52 ± 0.32A 70 4 1324.4 ± 2.22A 11.6 ± 0.16A 48.0 ± 0.08A 6 1192.6 ± 1.28B 11.6 ± 0.31A 50.2 ± 1.78A 40 4 e-w 1677.3 ± 1.15a 16.77 ± 0.14a 66.3 ± 0.81a 6 1515.3 ± 1.15b 14.2 ± 0.04b 58.5 ± 0.49b 70 4 1268.0 ± 2.00c 10.0 ± 0.03d 36.1 ± 1.48d 6 1202.7 ± 1.15d 10.7 ± 0.03c 44.5 ± 0.65c The results are given as the mean of three replicates with the standard deviations. Different letters represent the significant differences (p ≤ 0.05) between the results for each column. Upper case letters represent the solvent-water and lower case letters represent the solvent-ethanol-water. * w: water, e-w: ethanol-water. Table 4.
TPC, TACCUPRAC and TACDPPH yields of conventional extraction.
Figures
(5)
Tables
(4)