-

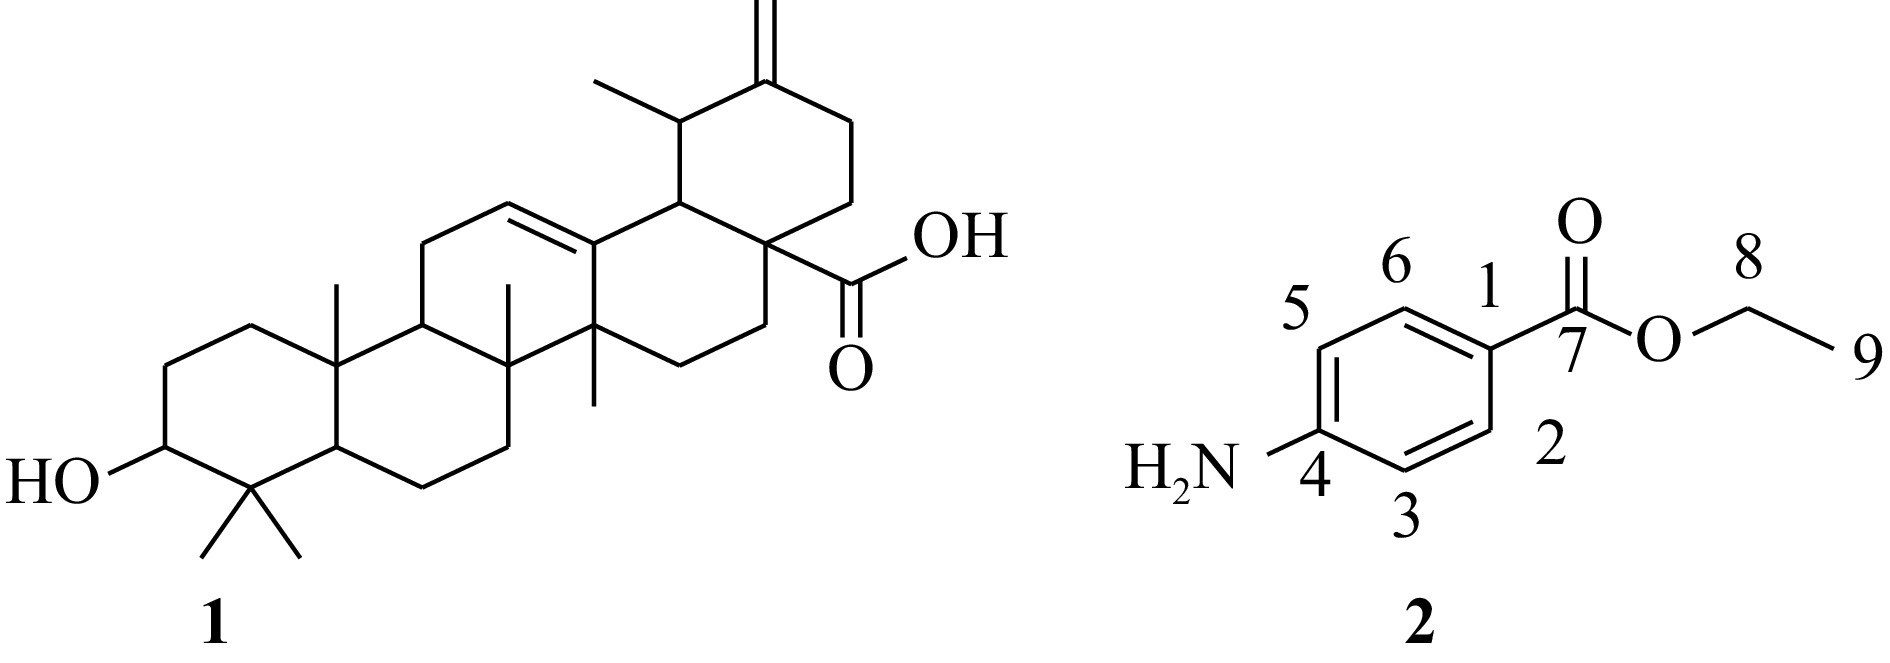
Figure 1.
Structure of isolated compounds from the leaves of Salvia rosmarinus.
-

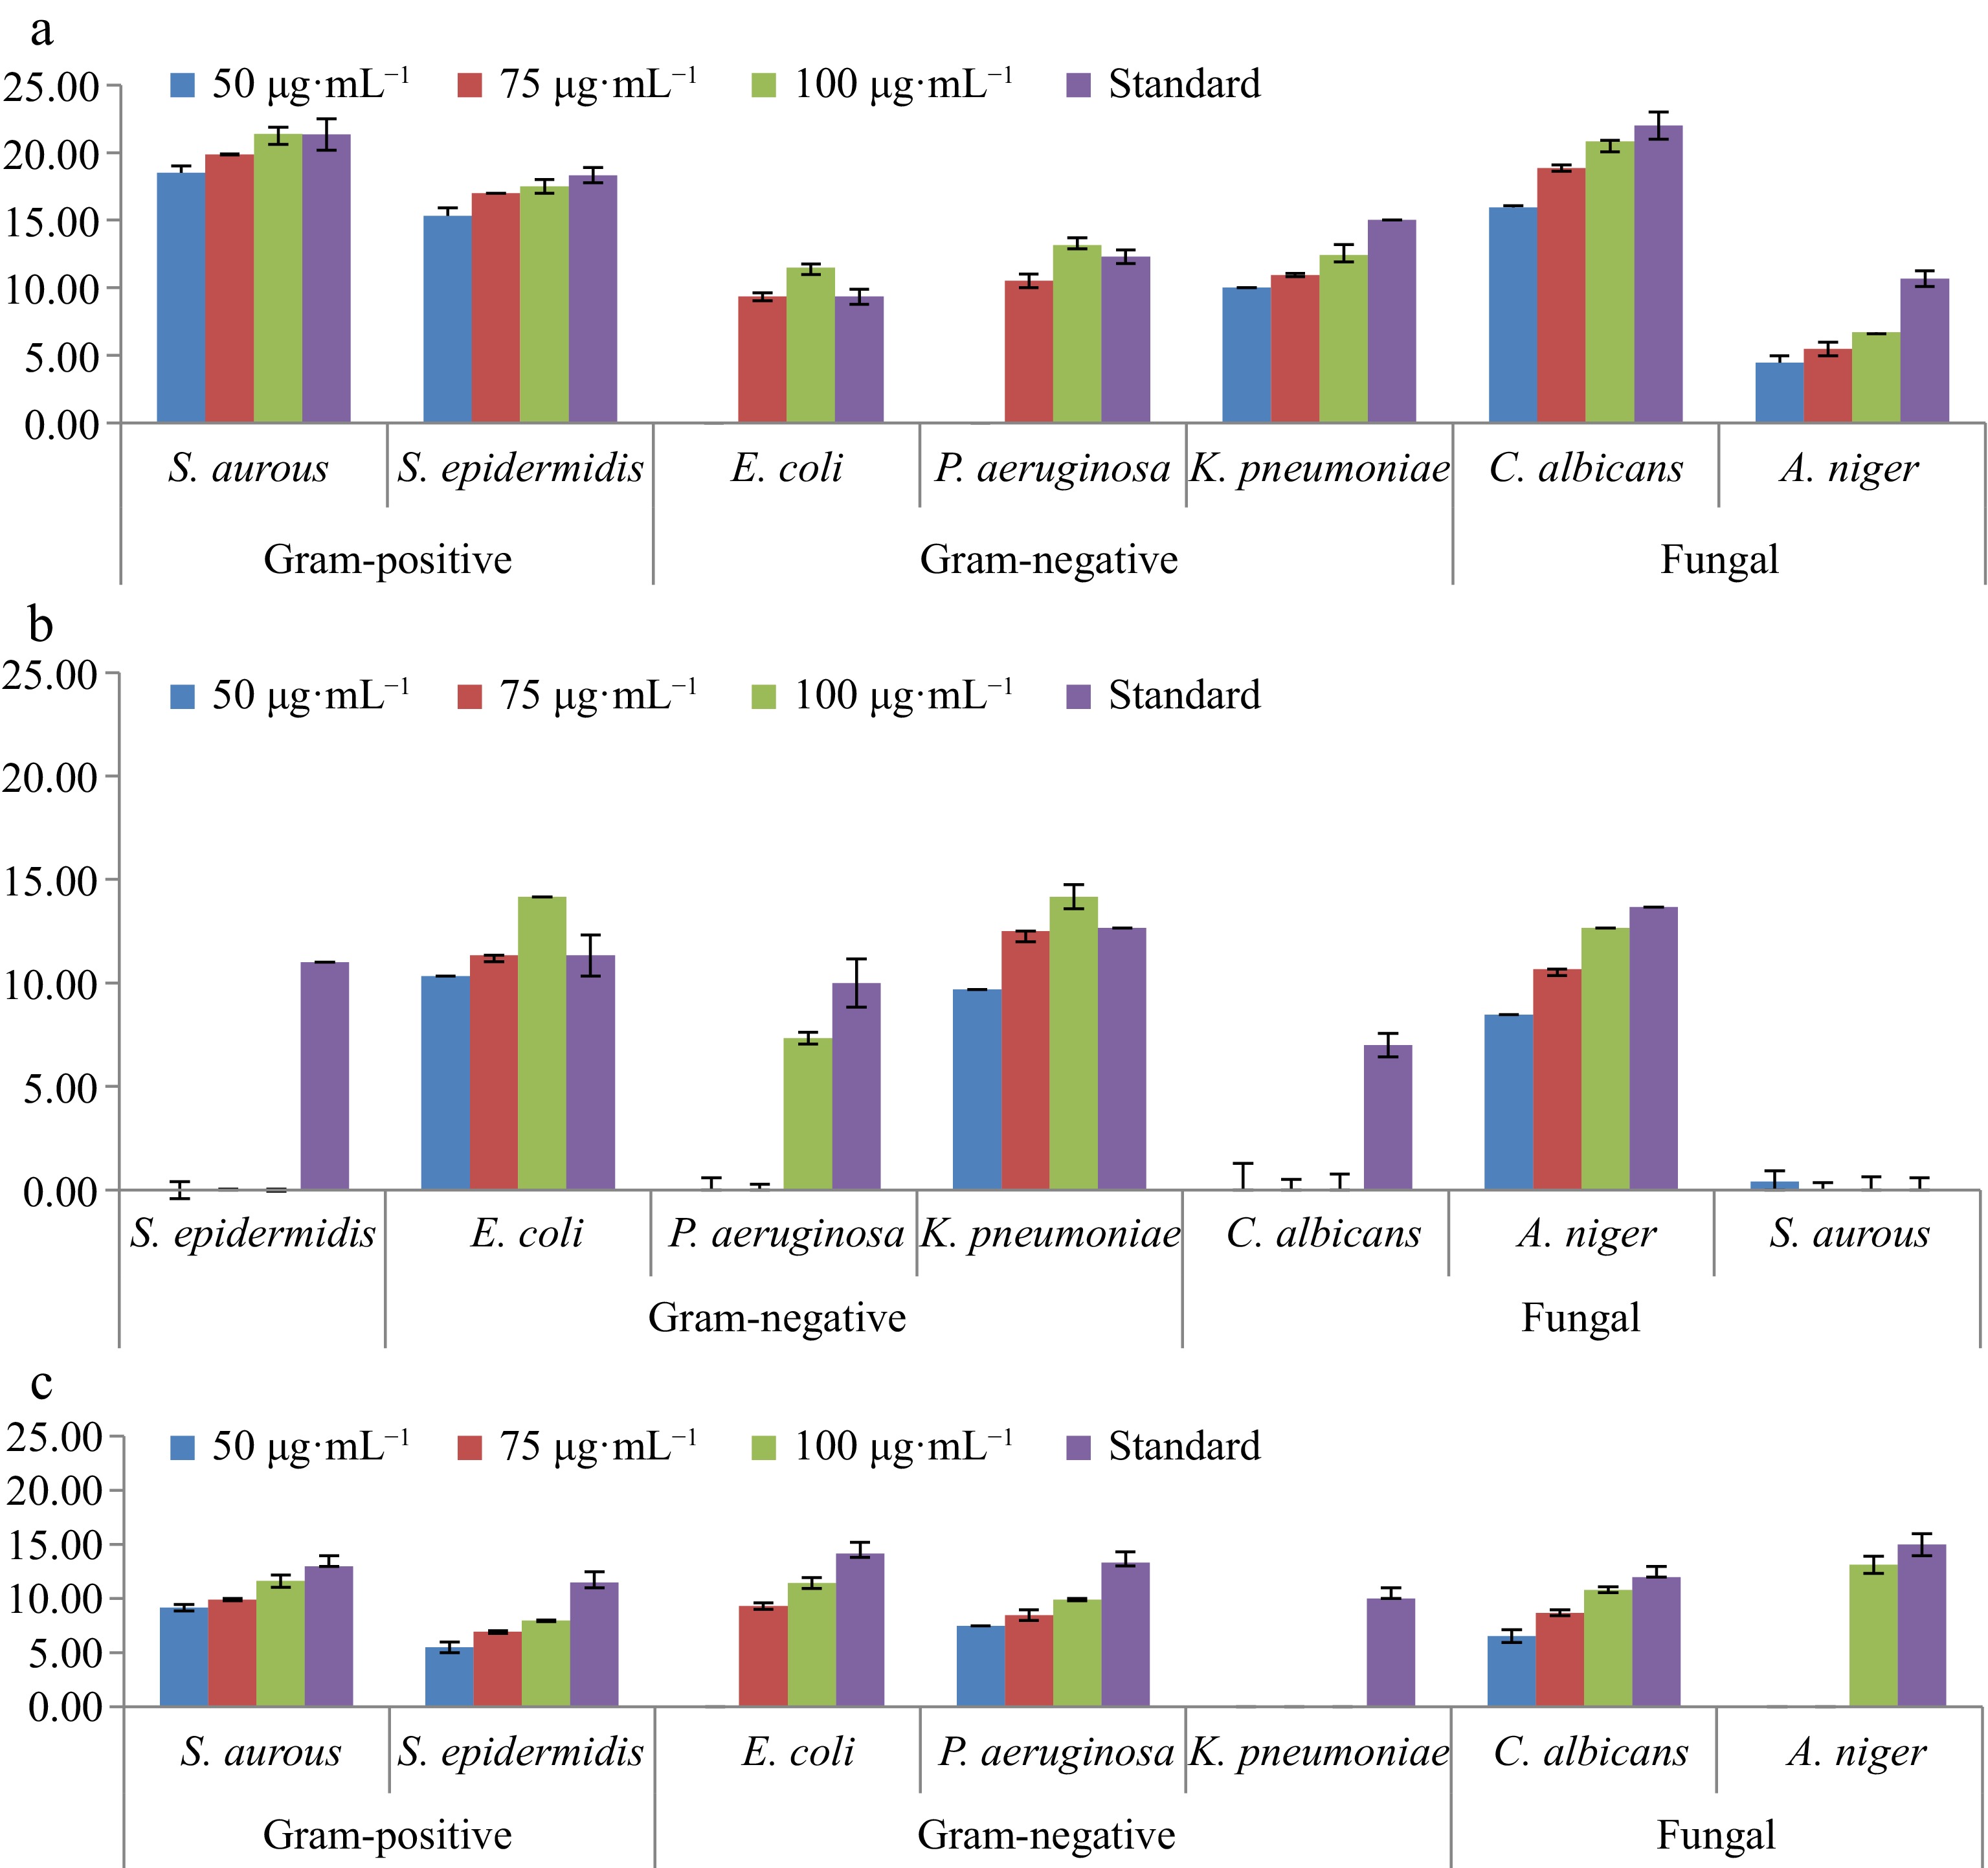
Figure 2.
Microbes' resistance with drugs relative to standard antibiotics in extracts of Salvia rosmarinus. The figures represent understudy of three extracts derived from Salvia rosmarinus. (a) Petroleum ether, (b) chloroform/methanol (1:1), and (c) methanol extracts tested in Salvia rosmarinus.
-

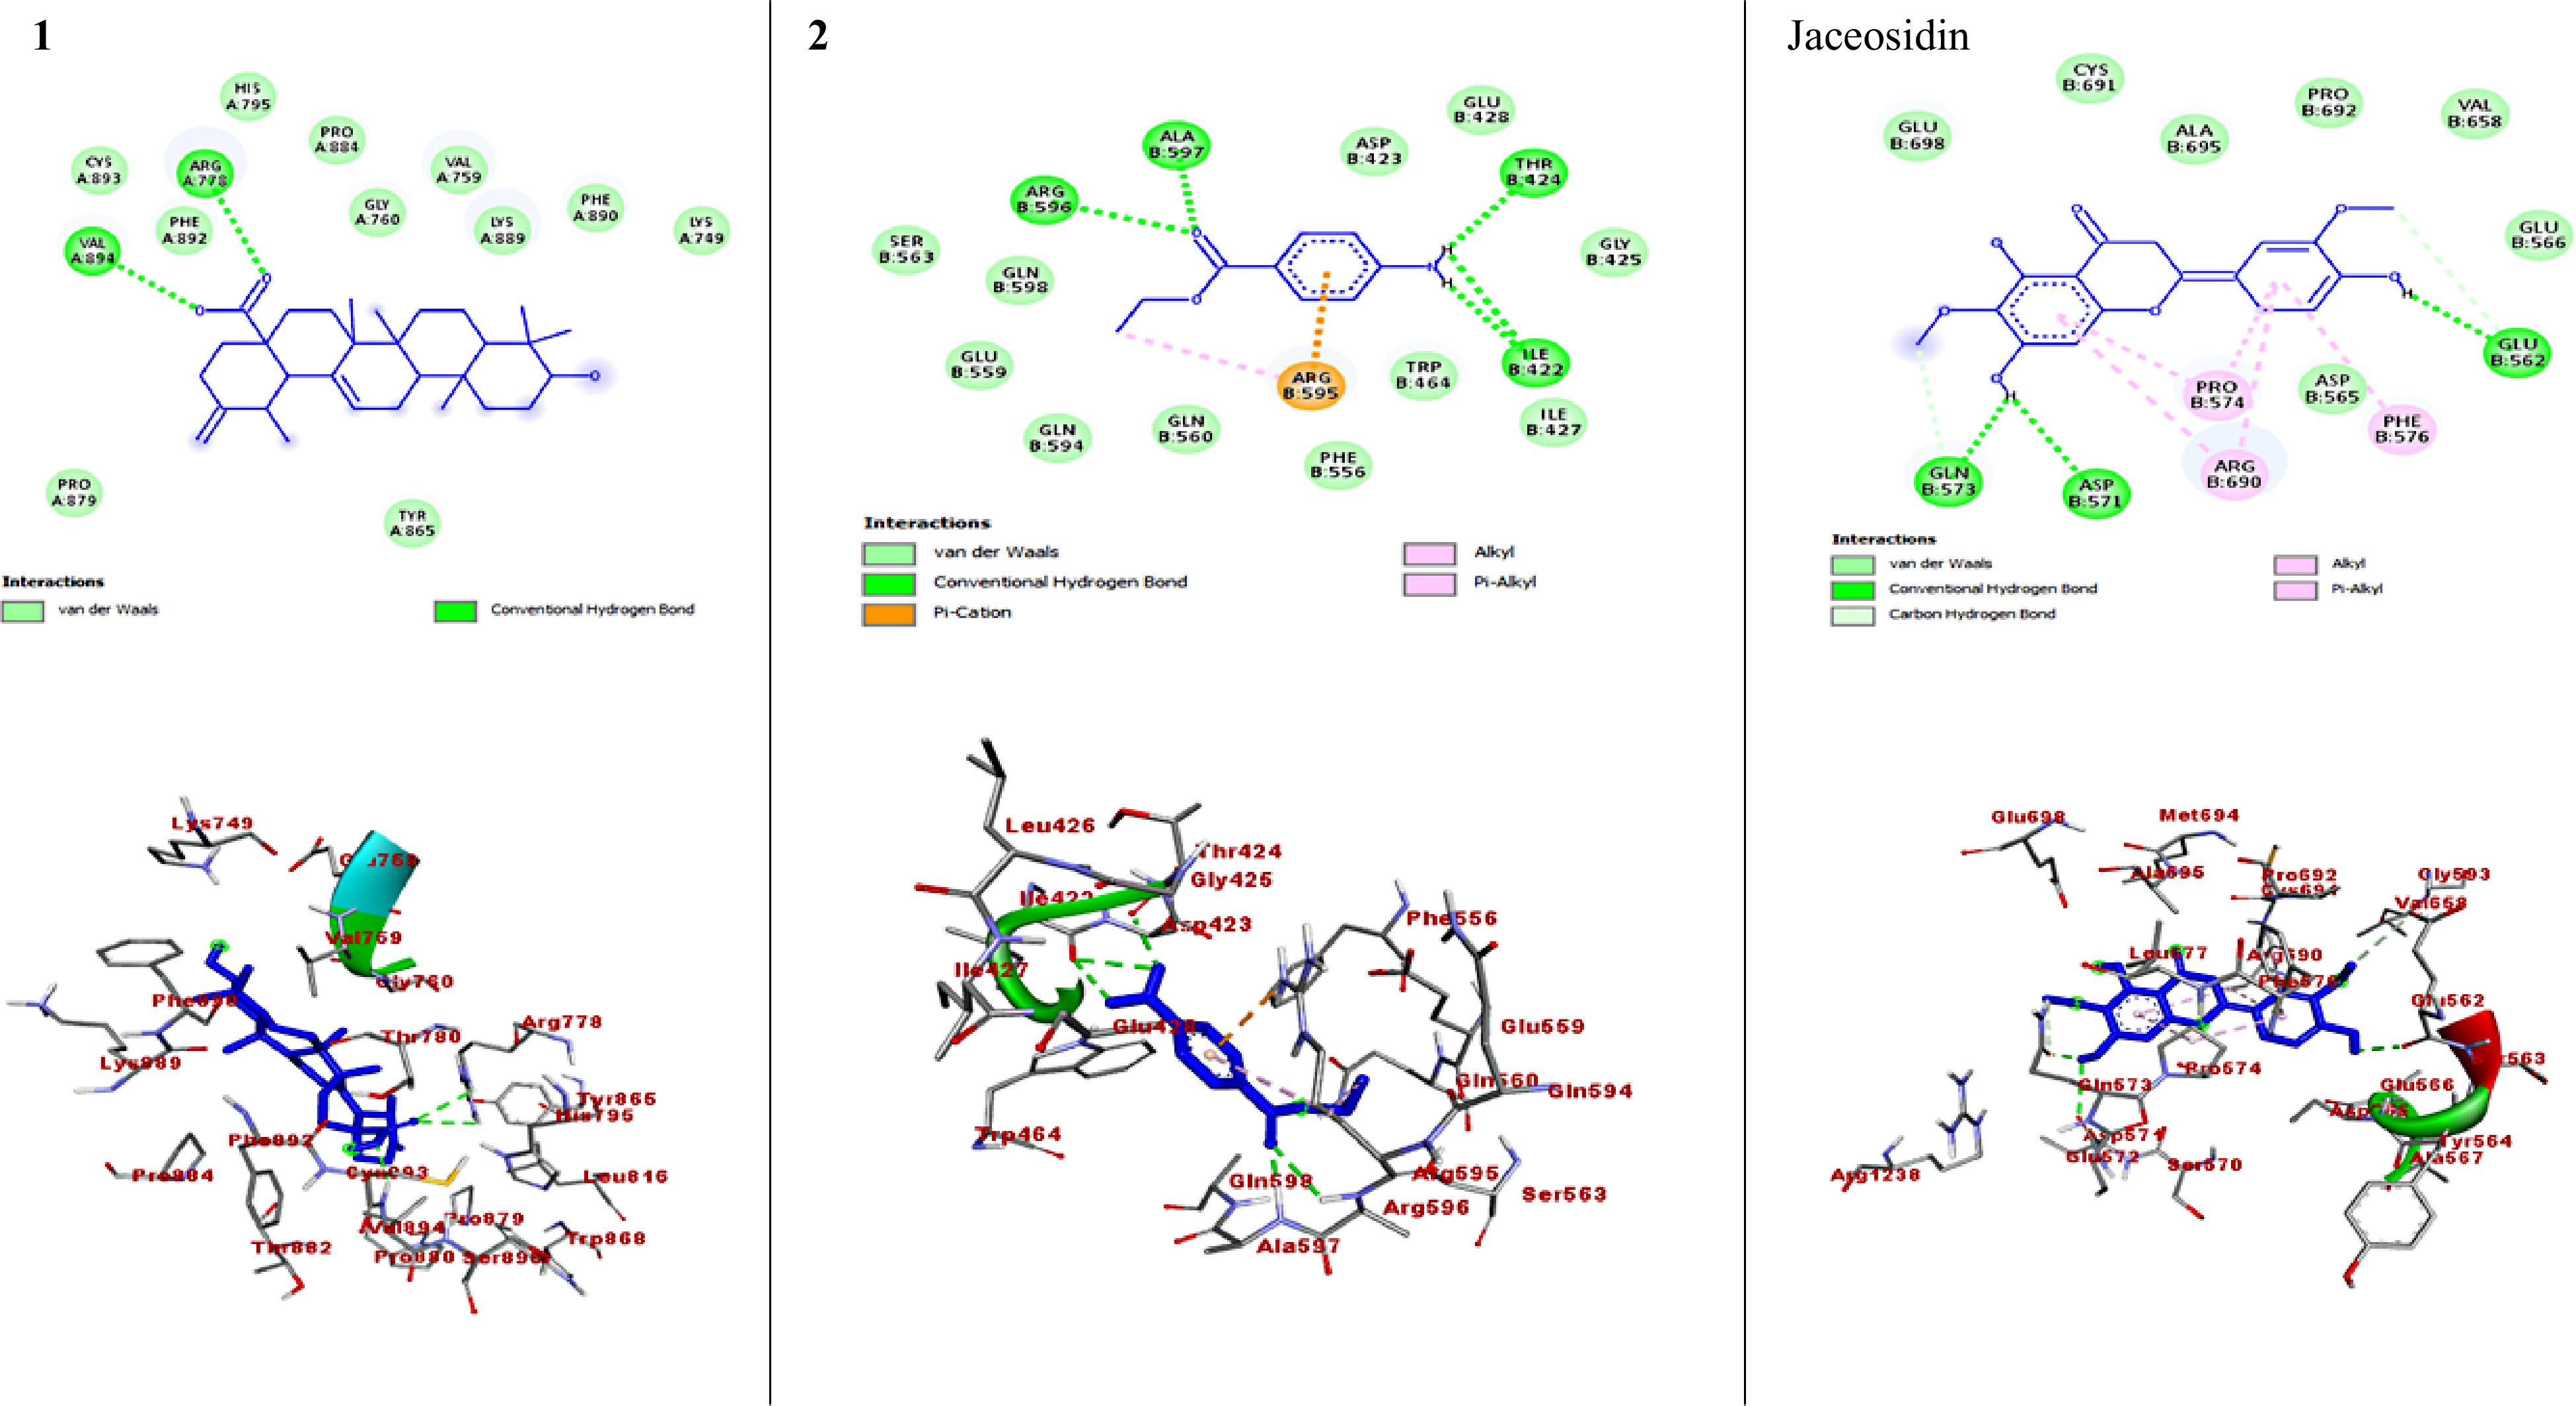
Figure 3.
The 2D and 3D binding interactions of compounds against DNMT1 enzyme (PDB ID: 4WXX). The 2D and 3D binding interactions of compound 1 and 2 represent against DNMT1 enzyme, and jaceosidin (standard) against DNMT1 enzyme.
-

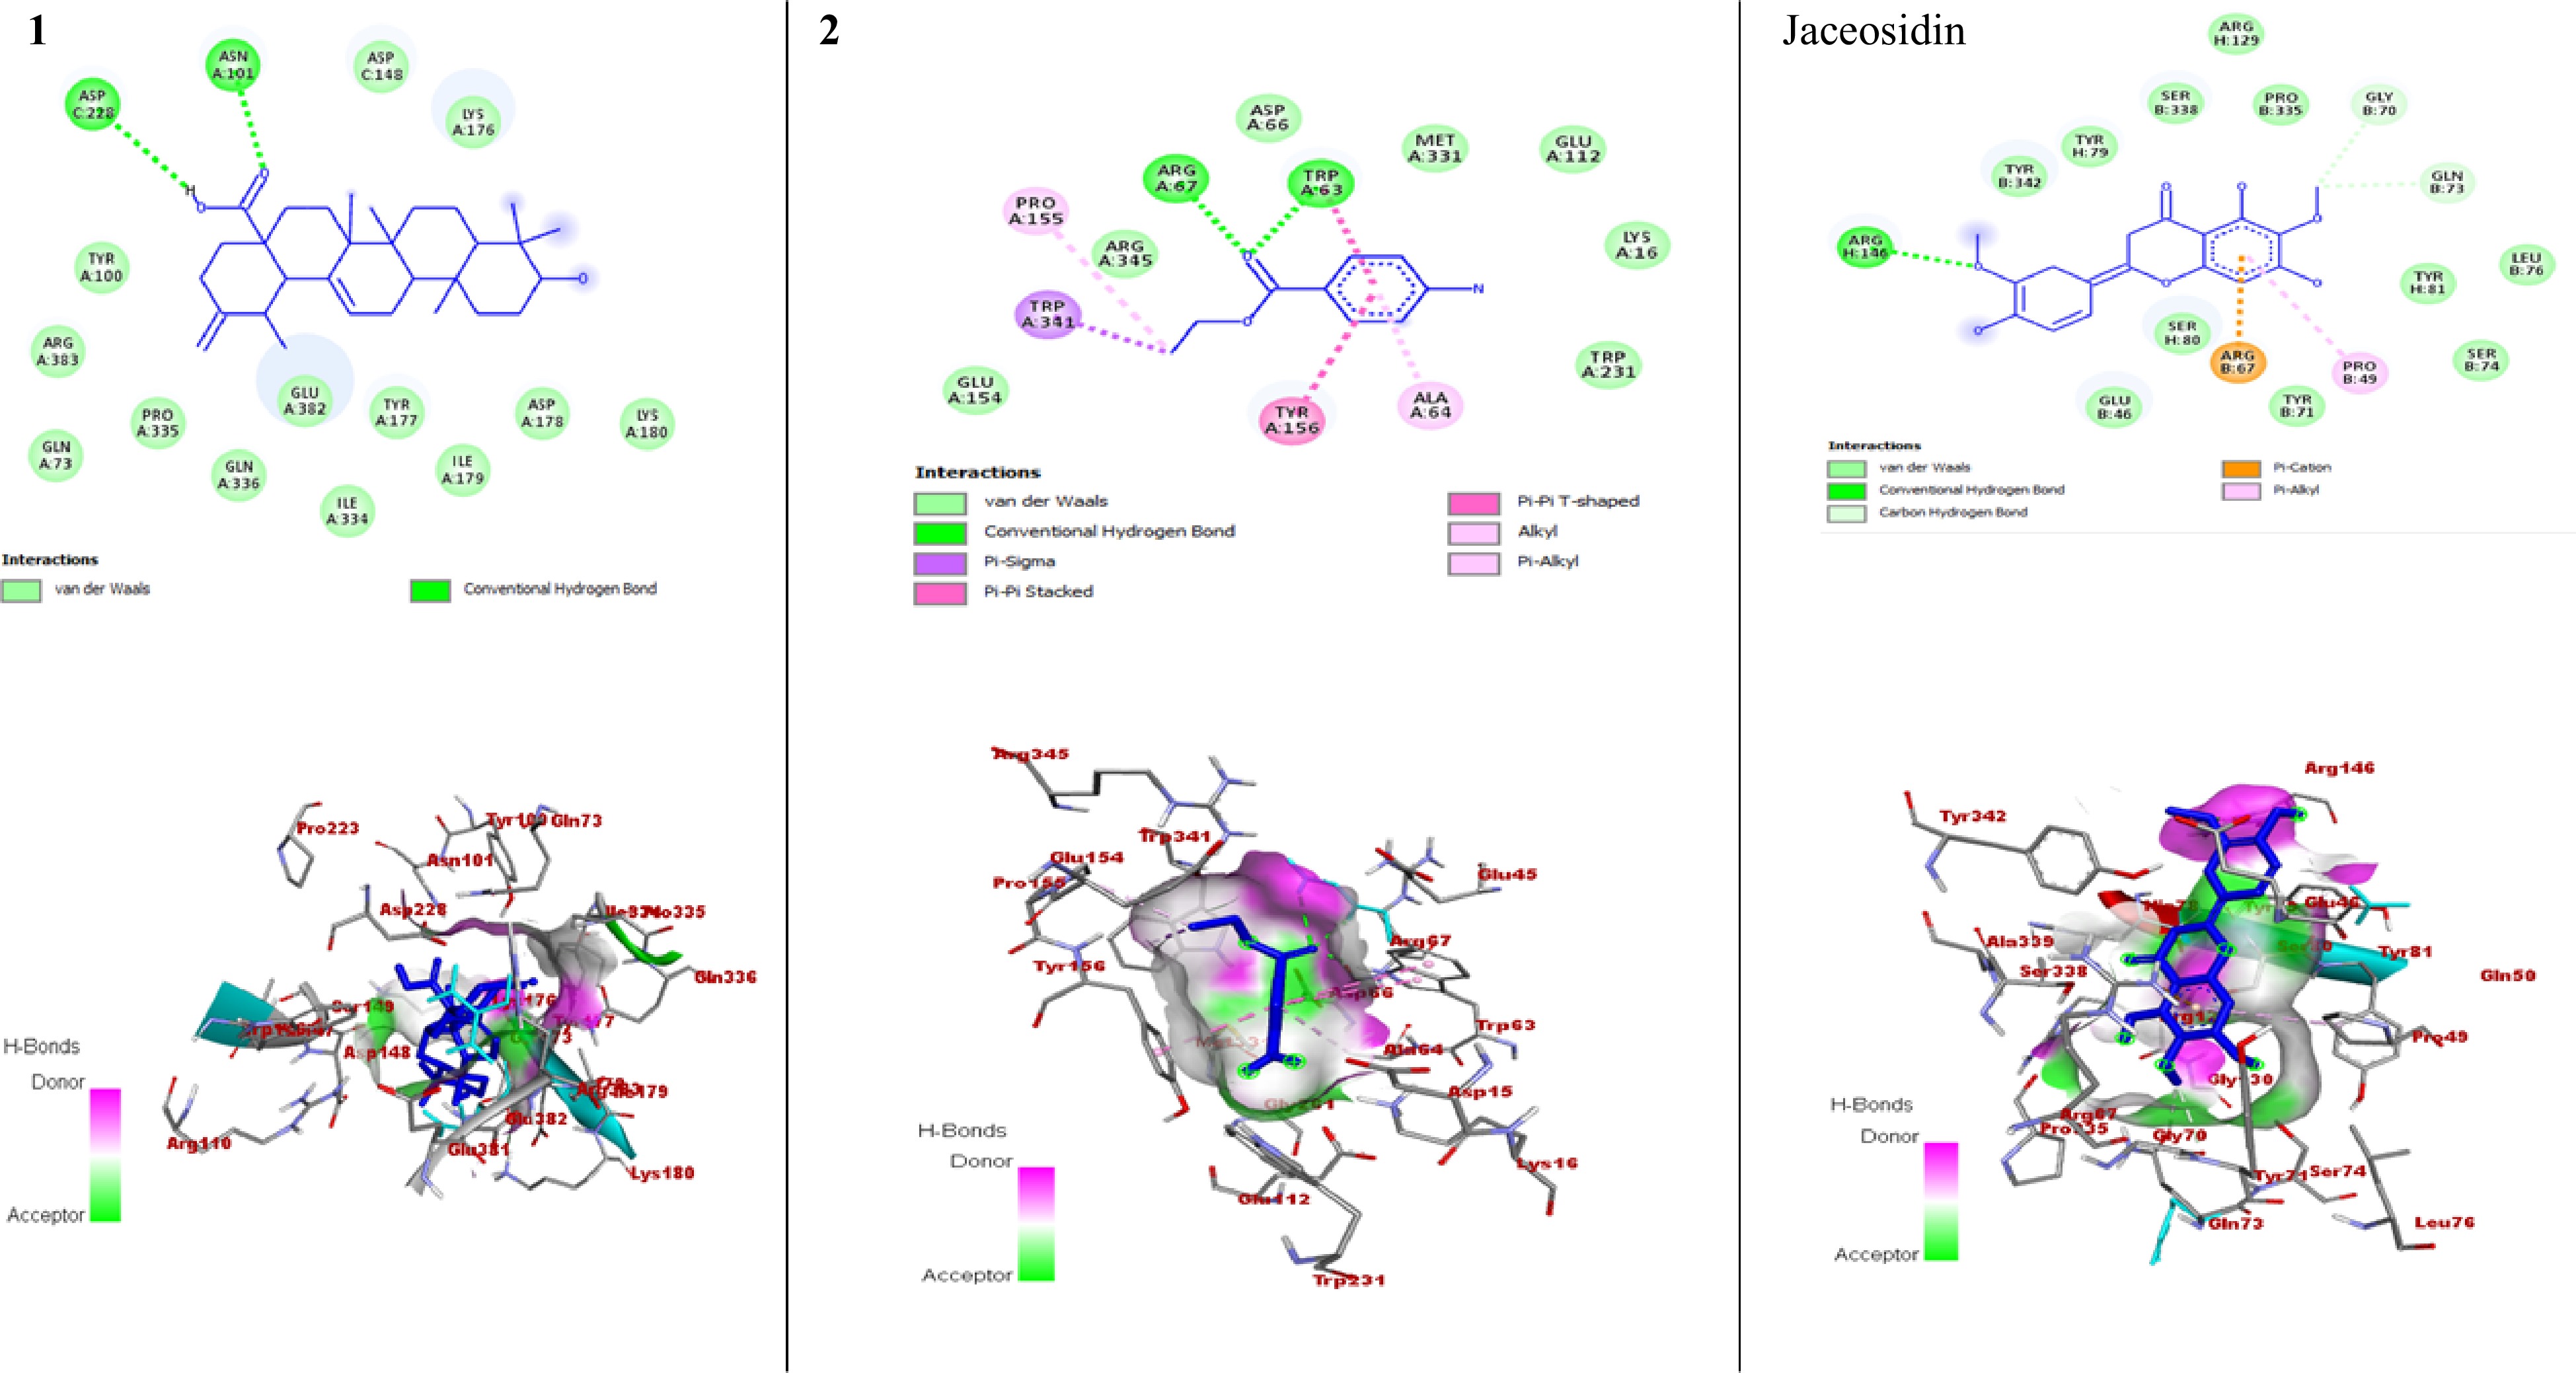
Figure 4.
The 2D and 3D binding interactions of compounds against HPV type 16 E6 (PDB ID: 4XR8). The 2D and 3D binding interactions of compound 1 and 2 represent against HPV type 16 E6 enzyme, and jaceosidin (standard) against HPV type 16 E6 enzyme.
-
Botanical name Phytochemicals Phytochemical screening tests Different extracts Petroleum ether Chloroform/methanol (1:1) Mehanol Salvia rosmarinus Alkaloids Wagner's test ++ ++ ++ Steroids Libermann Burchard test ++ + ++ Glycoside Keller-Killiani test − + − Coumarins Appirade test − + + Terpenoids Libermann Burchard test ++ ++ ++ Flavonoids Shinoda test ++ ++ ++ Carbohydrate Fehling's test − ++ ++ Tannins Lead acetate test ++ ++ ++ Saponins Foam test + + + + indicates moderate presence, ++ indicates highly present, − indicates absence. Table 1.
Phytochemical screening tests result of petroleum ether, chloroform/methanol (1:1) and methanol extracts of Salvia rosmarinus leaves.
-
Position NMR data of compound 1 Abdel-Monem
et al.[26]1H-NMR 13C-NMR 13C-NMR 1 38.60 39.9 2 27.8 28.5 3 3.2 (m, 1H) 78.3 80.3 4 − 39.4 39.9 5 55.3 56.7 6 18.1 18.3 7 36.7 34.2 8 − 41.9 40.7 9 53 48.8 10 − 38.4 38.2 11 23.9 24.6 12 5.3 (t, J = 3.7 Hz, 1H) 125.5 127.7 13 − 138.2 138 14 − 41.8 43.3 15 30.4 29.1 16 26.5 25.6 17 − 47.8 48 18 δ 2.22 (d, J = 13.5 Hz, 1H) 55.2 56.1 19 37.1 38.7 20 − 153.1 152.8 21 32.9 33.5 22 39.0 40.1 23 27.4 29.4 24 16.3 16.9 25 15.0 16.6 26 20.2 18.3 27 22.7 24.6 28 − 180.2 177.8 29 16.4 17.3 30 4.7 (m, 1H), and 4.1 (m, 1H) 103.9 106.5 Table 2.
Comparison of the 13C-NMR spectral data of compound 1 and micromeric acid (MeOD, δ in ppm).
-
Position NMR data of compound 2 Alotaibi et al.[27] 1H-NMR 13C-NMR 1H-NMR 13C-NMR 1 − 120.9 − 119 2 7.79 (d, J = 8.7 Hz, 2H) 131.4 7.86 (d, J = 7.6 Hz) 132 3 6.90 (d, J = 8.7 Hz, 2H) 116.8 6.83 (d, J = 7.6 Hz) 114 4 − 148.2 − 151 5 6.90 (d, J = 8.7 Hz, 2H) 116.8 6.83 (d, J = 7.6 Hz) 114 6 7.79 (d, J = 8.7 Hz, 2H) 131.4 7.86 (d, J = 7.6 Hz) 132 7 − 166.0 − 169 8 4.3 (q, J = 7.1 Hz, 2H) 60.4 4.3 (q, J = 7.0 Hz) 61 9 1.3 (t, J = 7.1 Hz, 3H) 14.7 1.36 (t, J = 7.0 Hz) 15 Table 3.
Comparison of the 1H-NMR, and 13C-NMR spectral data of compound 2 and benzocaine (DMSO, δ in ppm).
-
Type of specimen, and standard antibiotics for
each sampleConcentration (μg·mL−1) of extract
in 99.8% DMSOAverage values of the zone of inhibition (mm) Gram-positive (+) bacteria Gram-negative (−) bacteria Fungai S. aurous S. epidermidis E. coli P. aeruginosa K. pneumoniae C. albicans A. niger Petroleum ether extracts S. rosmarinus 50 18.50 ± 0.50 15.33 ± 0.58 0.00 ± 0.00 0.00 ± 0.00 10.00 ± 0.00 15.93 ± 0.12 4.47 ± 0.50 75 19.87 ± 0.06 17.00 ± 0.00 9.33 ± 0.29 10.53 ± 0.50 10.93 ± 0.12 18.87 ± 0.23 5.47 ± 0.50 100 21.37 ± 0.78 17.50 ± 0.50 11.47 ± 0.50 13.17 ± 0.29 12.43 ± 0.51 20.83 ± 0.76 6.70 ± 0.10 Standard antibiotics Cipro. 21.33 ± 1.15 18.33 ± 0.58 9.33 ± 0.58 12.30 ± 0.52 15.00 ± 0.00 Ketocon. 22.00 ± 1.00 10.67 ± 0.58 Chloroform/methanol (1:1) extracts 50 5.47 ± 0.42 0.00 ± 0.00 10.33 ± 0.00 0.00 ± 0.00 9.70 ± 0.00 0.00 ± 0.12 8.47 ± 0.50 S. rosmarinus 75 5.93 ± 0.06 0.00 ± 0.00 11.33 ± 0.29 0.00 ± 0.50 12.50 ± 0.12 0.00 ± 0.23 10.67 ± 0.50 100 6.47 ± 0.06 0.00 ± 0.00 14.17 ± 0.50 7.33 ± 0.29 14.17 ± 0.51 0.00 ± 0.76 12.67 ± 0.10 Standard antibiotics Cipro. 15.00 ± 0.00 11.00 ± 1.00 11.33 ± 0.58 10.00 ± 0.52 12.67 ± 0.00 Ketocon. 7.00 ± 1.00 13.67 ± 0.58 Methanol extracts 50 9.17 ± 0.29 5.50 ± 0.50 0.00 ± 0.00 7.50 ± 0.00 0.00 ± 0.00 6.57 ± 0.12 0.00 ± 0.50 S. rosmarinus 75 9.90 ± 0.10 6.93 ± 0.12 9.33 ± 0.29 8.50 ± 0.50 0.00 ± 0.00 8.70 ± 0.23 0.00 ± 0.50 100 11.63 ± 0.55 7.97 ± 0.06 11.47 ± 0.50 9.90 ± 0.10 0.00 ± 0.00 10.83 ± 0.76 13.13 ± 0.10 Standard antibiotics Cipro. 13.00 ± 0.00 11.50 ± 0.50 14.20 ± 0.58 13.33 ± 0.29 10.00 ± 0.00 Ketocon. 12.00 ± 1.00 15.00 ± 0.58 Mean values of flavonoids (mg·g−1) by 570 nm S. rosmarinus Petroleum ether extracts Chloroform/methanol (1:1) extracts Methanol extracts 50 0.736 0.797 0.862 75 0.902 0.881 0.890 100 0.922 0.904 0.940 Samples: Antibiotics: Cipro., Ciprofloxacin; Ketocon., ketoconazole (Nizoral); DMSO 99.8%, Dimethyl sulfoxide. Table 4.
Comparison of mean zone of inhibition (MZI) leaf extracts of Salvia rosmarinus.
-
Ligands Binding affinity
( kcal·mol−1)H-bond Residual interactions Hydrophobic/electrostatic Van der Waals 1 −8.4 ARG778 (2.85249), ARG778 (2.97417), VAL894 (2.42832) − Lys-889, Pro-879, Tyr-865, His-795, Cys-893, Gly-760, Val-759, Phe-892, Phe-890, Pro-884, Lys-749 2 −5.3 ARG596 (2.73996), ALA597 (1.84126), ILE422 (2.99493), THR424 (2.1965), ILE422 (2.93653) Electrostatic Pi-Cation-ARG595 (3.56619), Hydrophobic Alkyl-ARG595 (4.15839), Hydrophobic Pi-Alkyl-ARG595 (5.14967) Asp-423, Glu-428, Gly-425, Ile-427, Trp-464, Phe-556, Gln-560, Gln-594, Glu-559, Gln-598, Ser-563 Jaceosidin −7.8 ASP571 (2.93566), GLN573 (2.02126), GLU562 (2.42376), GLN573 (3.49555), GLU562 (3.46629) Hydrophobic Alkyl-PRO574 (4.59409), Hydrophobic Alkyl-ARG690 (5.09748), Hydrophobic Pi-Alkyl-PHE576 (5.1314), Hydrophobic Pi-Alkyl-PRO574 (4.97072), Hydrophobic Pi-Alkyl-ARG690 (5.07356) Glu-698, Cys-691, Ala-695, Pro-692, Val-658, Glu-566, Asp-565 Table 5.
Molecular docking results of ligand compounds 1 and 2 against DNMT1 enzyme (PDB ID: 4WXX).
-
Ligands Binding affinity
(kcal·mol−1)H-bond Residual interactions Hydrophobic/electrostatic Van der Waals 1 −10.1 ASN101 (2.25622), ASP228 (2.88341) − Asp-148, Lys-176, Lys-180, Asp-178, Ile-179, Tyr-177, Ile-334, Glu-382, Gln-336, Pro-335, Gln-73, Arg-383, Tyr-100 2 −6.5 TRP63 (1.90011), ARG67 (2.16075), ARG67 (2.8181) Hydrophobic Pi-Sigma-TRP341 (3.76182), Hydrophobic Pi-Pi Stacked-TYR156 (4.36581), Hydrophobic Pi-Pi T-shaped-TRP63 (5.16561), Hydrophobic Pi-Pi T-shaped-TRP63 (5.44632), Hydrophobic Alkyl-PRO155 (4.34691), Hydrophobic Pi-Alkyl-TRP341 (4.11391), Hydrophobic Pi-Alkyl-ALA64 (4.61525) Glu-154, Arg-345, Asp-66, Met-331, Glu-112, Lys-16, Trp-231 Jaceosidin −8.8 ARG146 (2.06941), GLY70 (3.49991), GLN73 (3.38801) Electrostatic Pi-Cation-ARG67 (3.93442), Hydrophobic Pi-Alkyl-PRO49 (5.40012) Tyr-342, Tyr-79, Ser-338, Arg-129, Pro-335, Leu-76, Tyr-81, Ser-74, Tyr-71, Ser-80, Glu-46 Table 6.
Molecular docking results of ligand compounds 1 and 2 against HPV type 16 E6 (PDB ID: 4XR8).
-
Ligands Formula Mol. Wt. (g·mol−1) NRB NHA NHD TPSA (A°2) Log P (iLOGP) Log S (ESOL) Lipinski's rule of five 1 C30H46O3 454.68 1 3 2 57.53 3.56 −6.21 1 2 C 9H11NO2 165.19 3 2 1 52.32 1.89 −2.21 0 Jaceosidin C17H14O7 330.3 3 7 3 105 1.7 1 0 NHD, number of hydrogen donors; NHA, number of hydrogen acceptors; NRB, number of rotatable bonds; TPSA, total polar surface area; and log P, octanol-water partition coefficients; Log S, turbid metric of solubility. Table 7.
Drug-likeness predictions of compounds computed by Swiss ADME.
-
Ligands Formula Skin permeation value
(logKp - cm·s−1)GI
absorptionInhibitor interaction BBB permeability Pgp substrate CYP1A2 inhibitor CYP2C19 inhibitor CYP2C9 inhibitor CYP2D6 inhibitor 1 C30H46O3 −4.44 Low No No No No No No 2 C 9H11NO2 −5.99 High Yes No No No No No Jaceosidin C17H14O7 −6.13 High No No Yes No Yes Yes GI, gastrointestinal; BBB, blood brain barrier; Pgp, P-glycoprotein; and CYP, cytochrome-P. Table 8.
Pre ADMET predictions of compounds, computed by Swiss ADME.
-
Ligands Formula LD50
(mg·kg−1)Toxicity
classOrgan toxicity Hepatotoxicity Carcinogenicity Immunotoxicity Mutagenicity Cytotoxicity Irritant 1 C30H46O3 2,000 4 Inactive Active Active Inactive Inactive Inactive 2 C 9H11NO2 NA NA Inactive Inactive Inactive Inactive Inactive Inactive Jaceosidin C17H14O7 69 3 Inactive Inactive Inactive Inactive Inactive Inactive NA, not available. Table 9.
Toxicity prediction of compounds, computed by ProTox-II and OSIRIS property explorer.
Figures
(4)
Tables
(9)