-
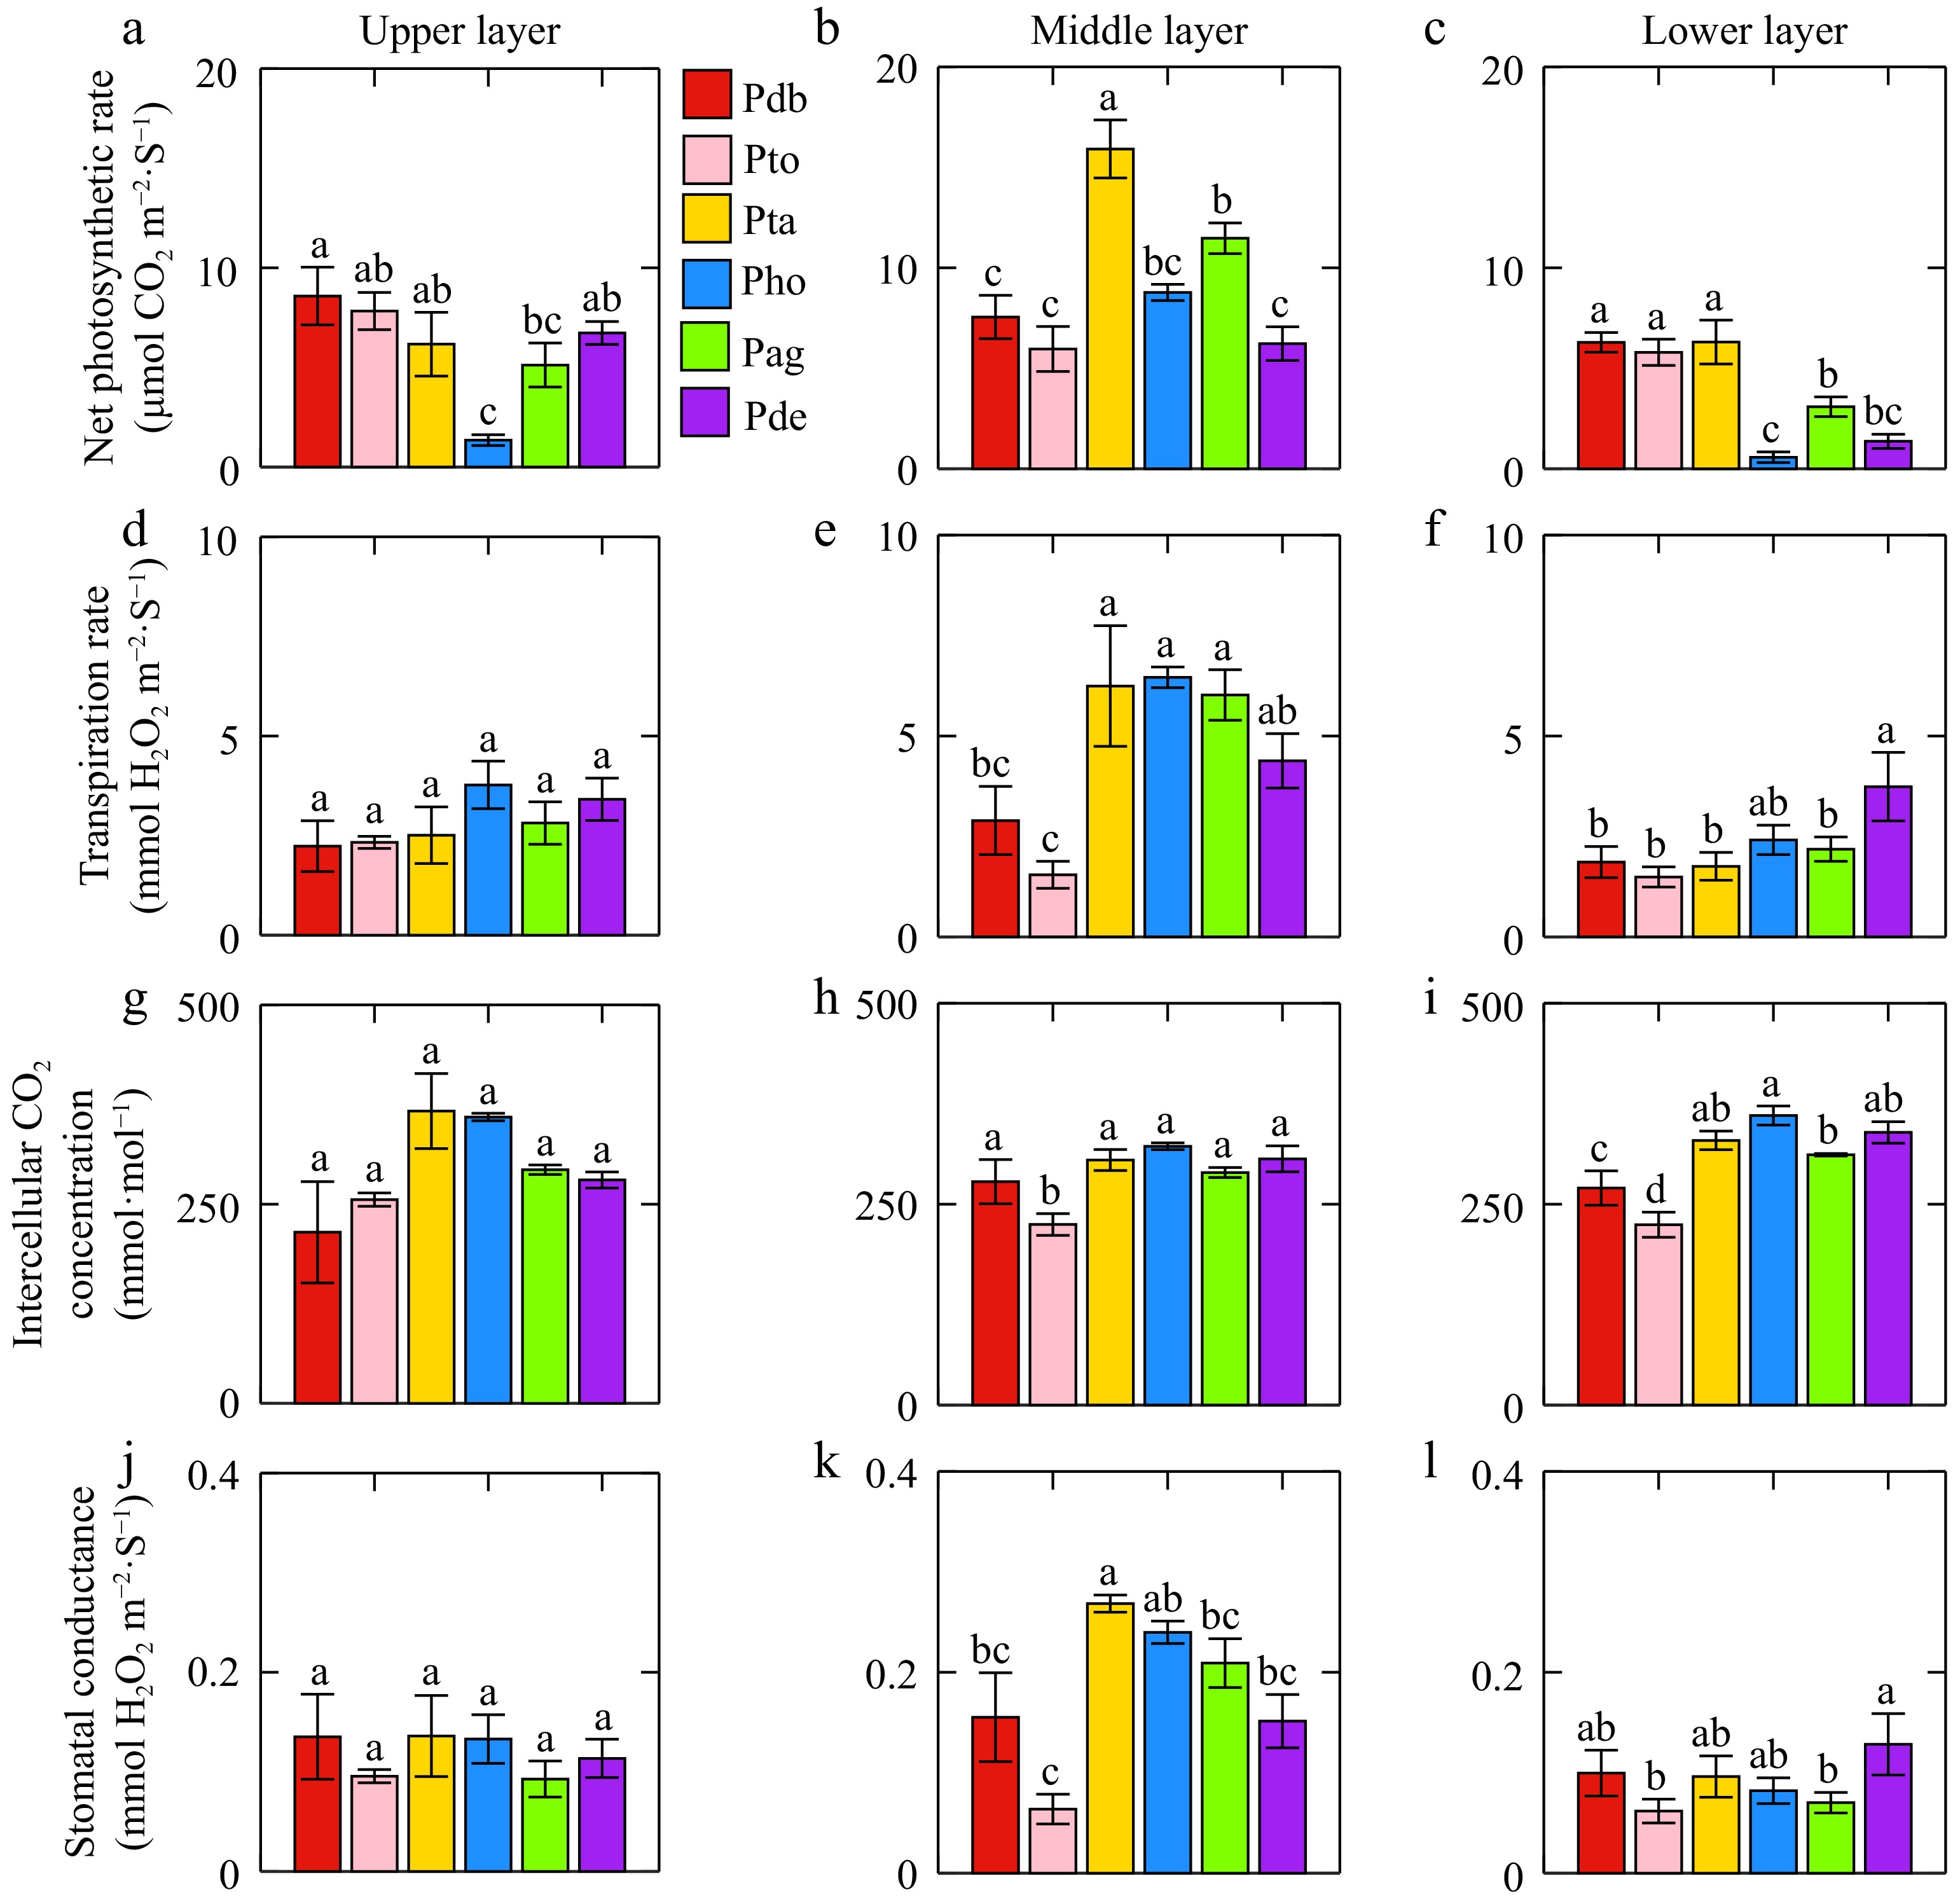
Figure 1.
(a)−(c) Differences in net photosynthetic rate, (d)−(f) transpiration rate, (g)−(i) intercellular CO2 concentration, and (j)−(l) stomatal conductance among different genotype of poplar leaves. Same letters in the figures indicate no significant difference and the error line was the standard error. Pdb, Pto, Pta, Pho, Pag, and Pde were Populus davidiana × P. bolleana, triploid Populus tomentosa, Populus tremula × P. alba, Populus hopeiensis, Populus alba × P. glandulosa, Populus deltoides × P. euramericana 'Nanlin895'.
-
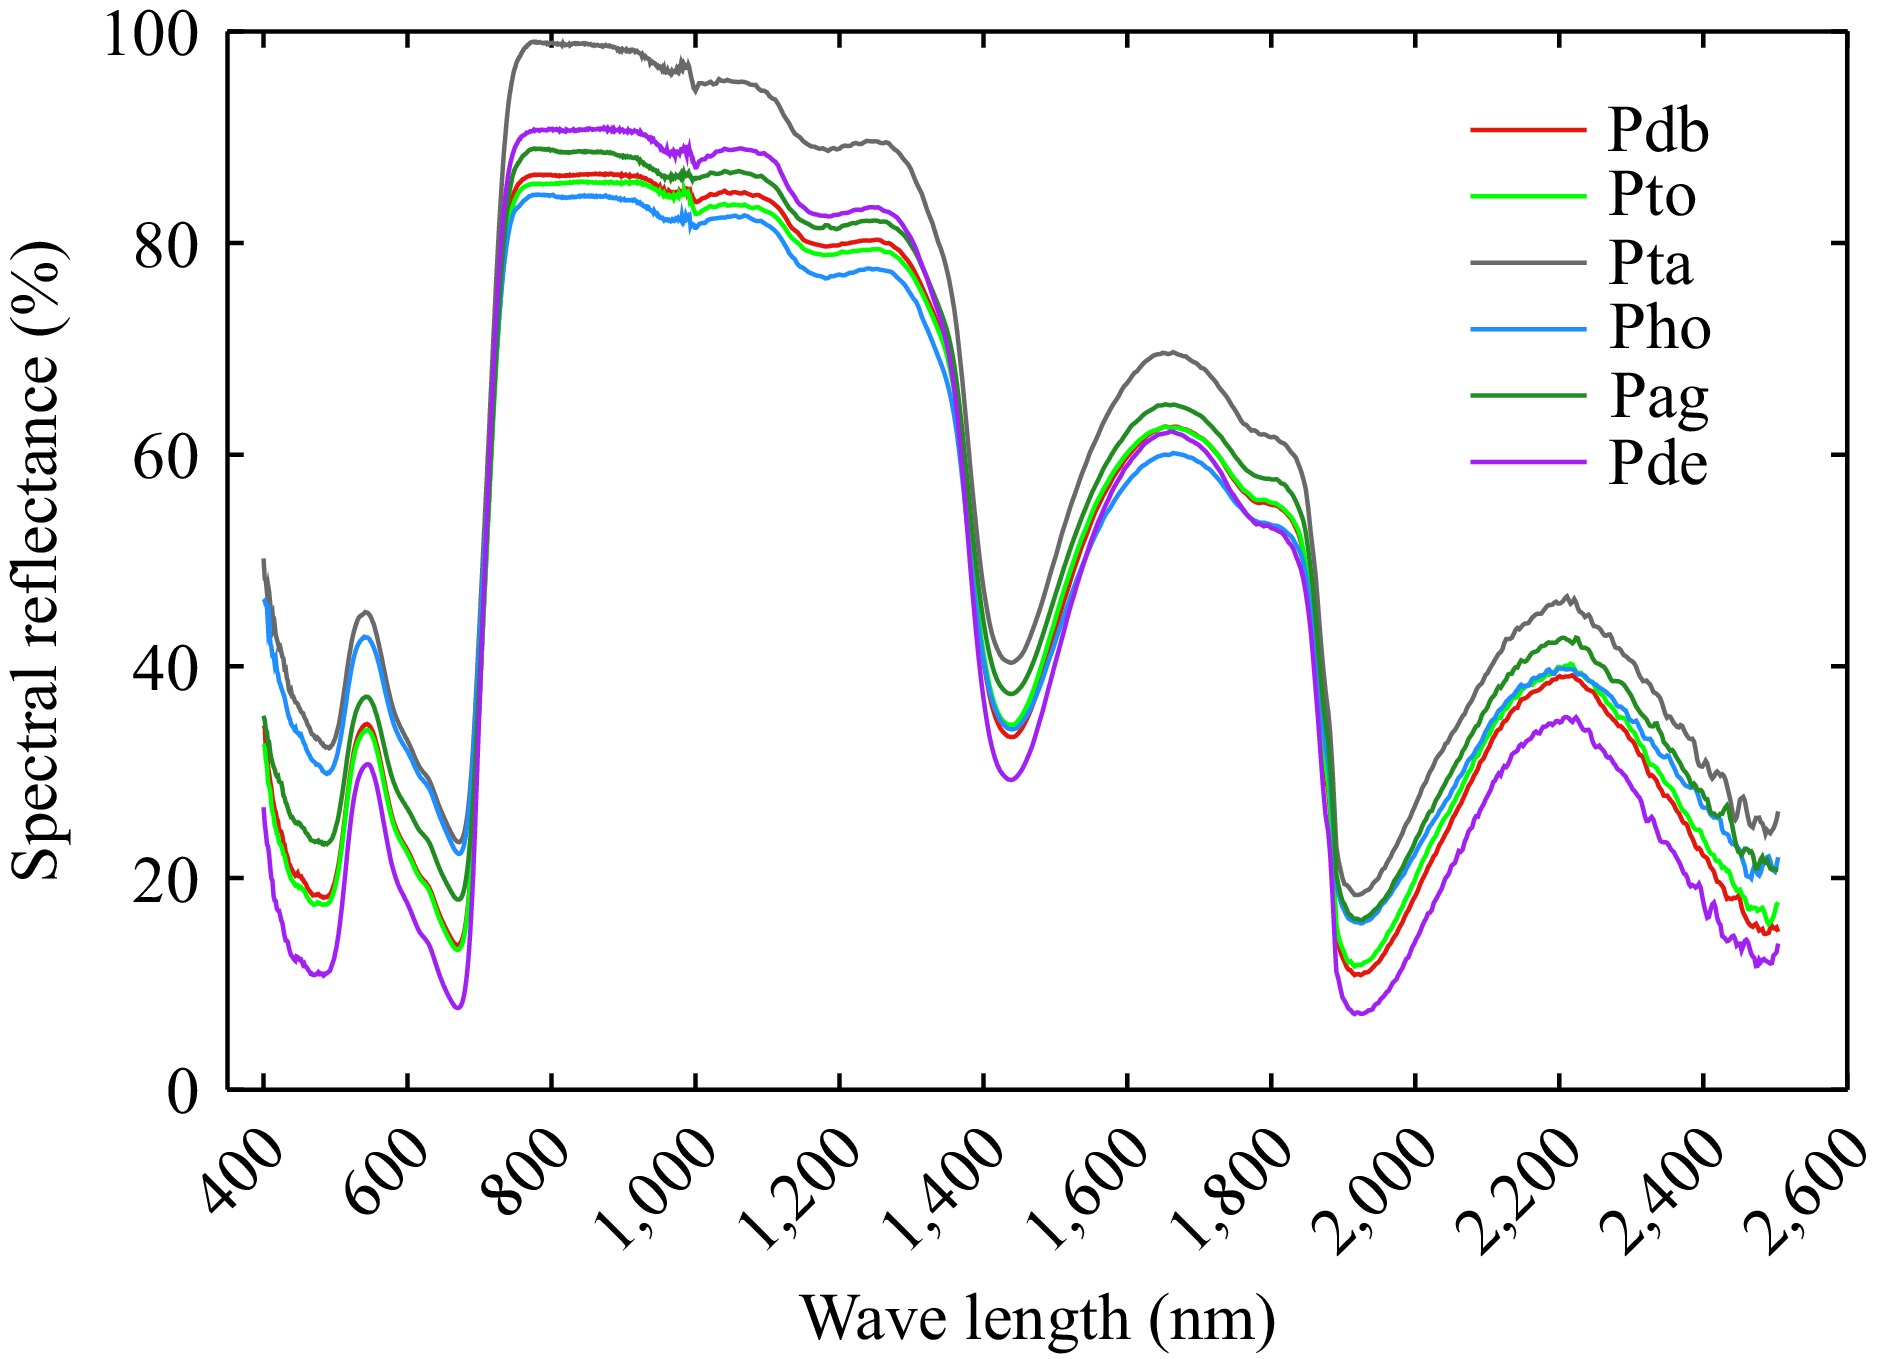
Figure 2.
Original leaf spectral reflectance from 400−2,500 nm of different poplar genotypes. Pdb, Pto, Pta, Pho, Pag, and Pde were Populus davidiana × P. bolleana, triploid Populus tomentosa, Populus tremula × P. alba, Populus hopeiensis, Populus alba × P. glandulosa, and Populus deltoides × P. euramericana 'Nanlin895'.
-
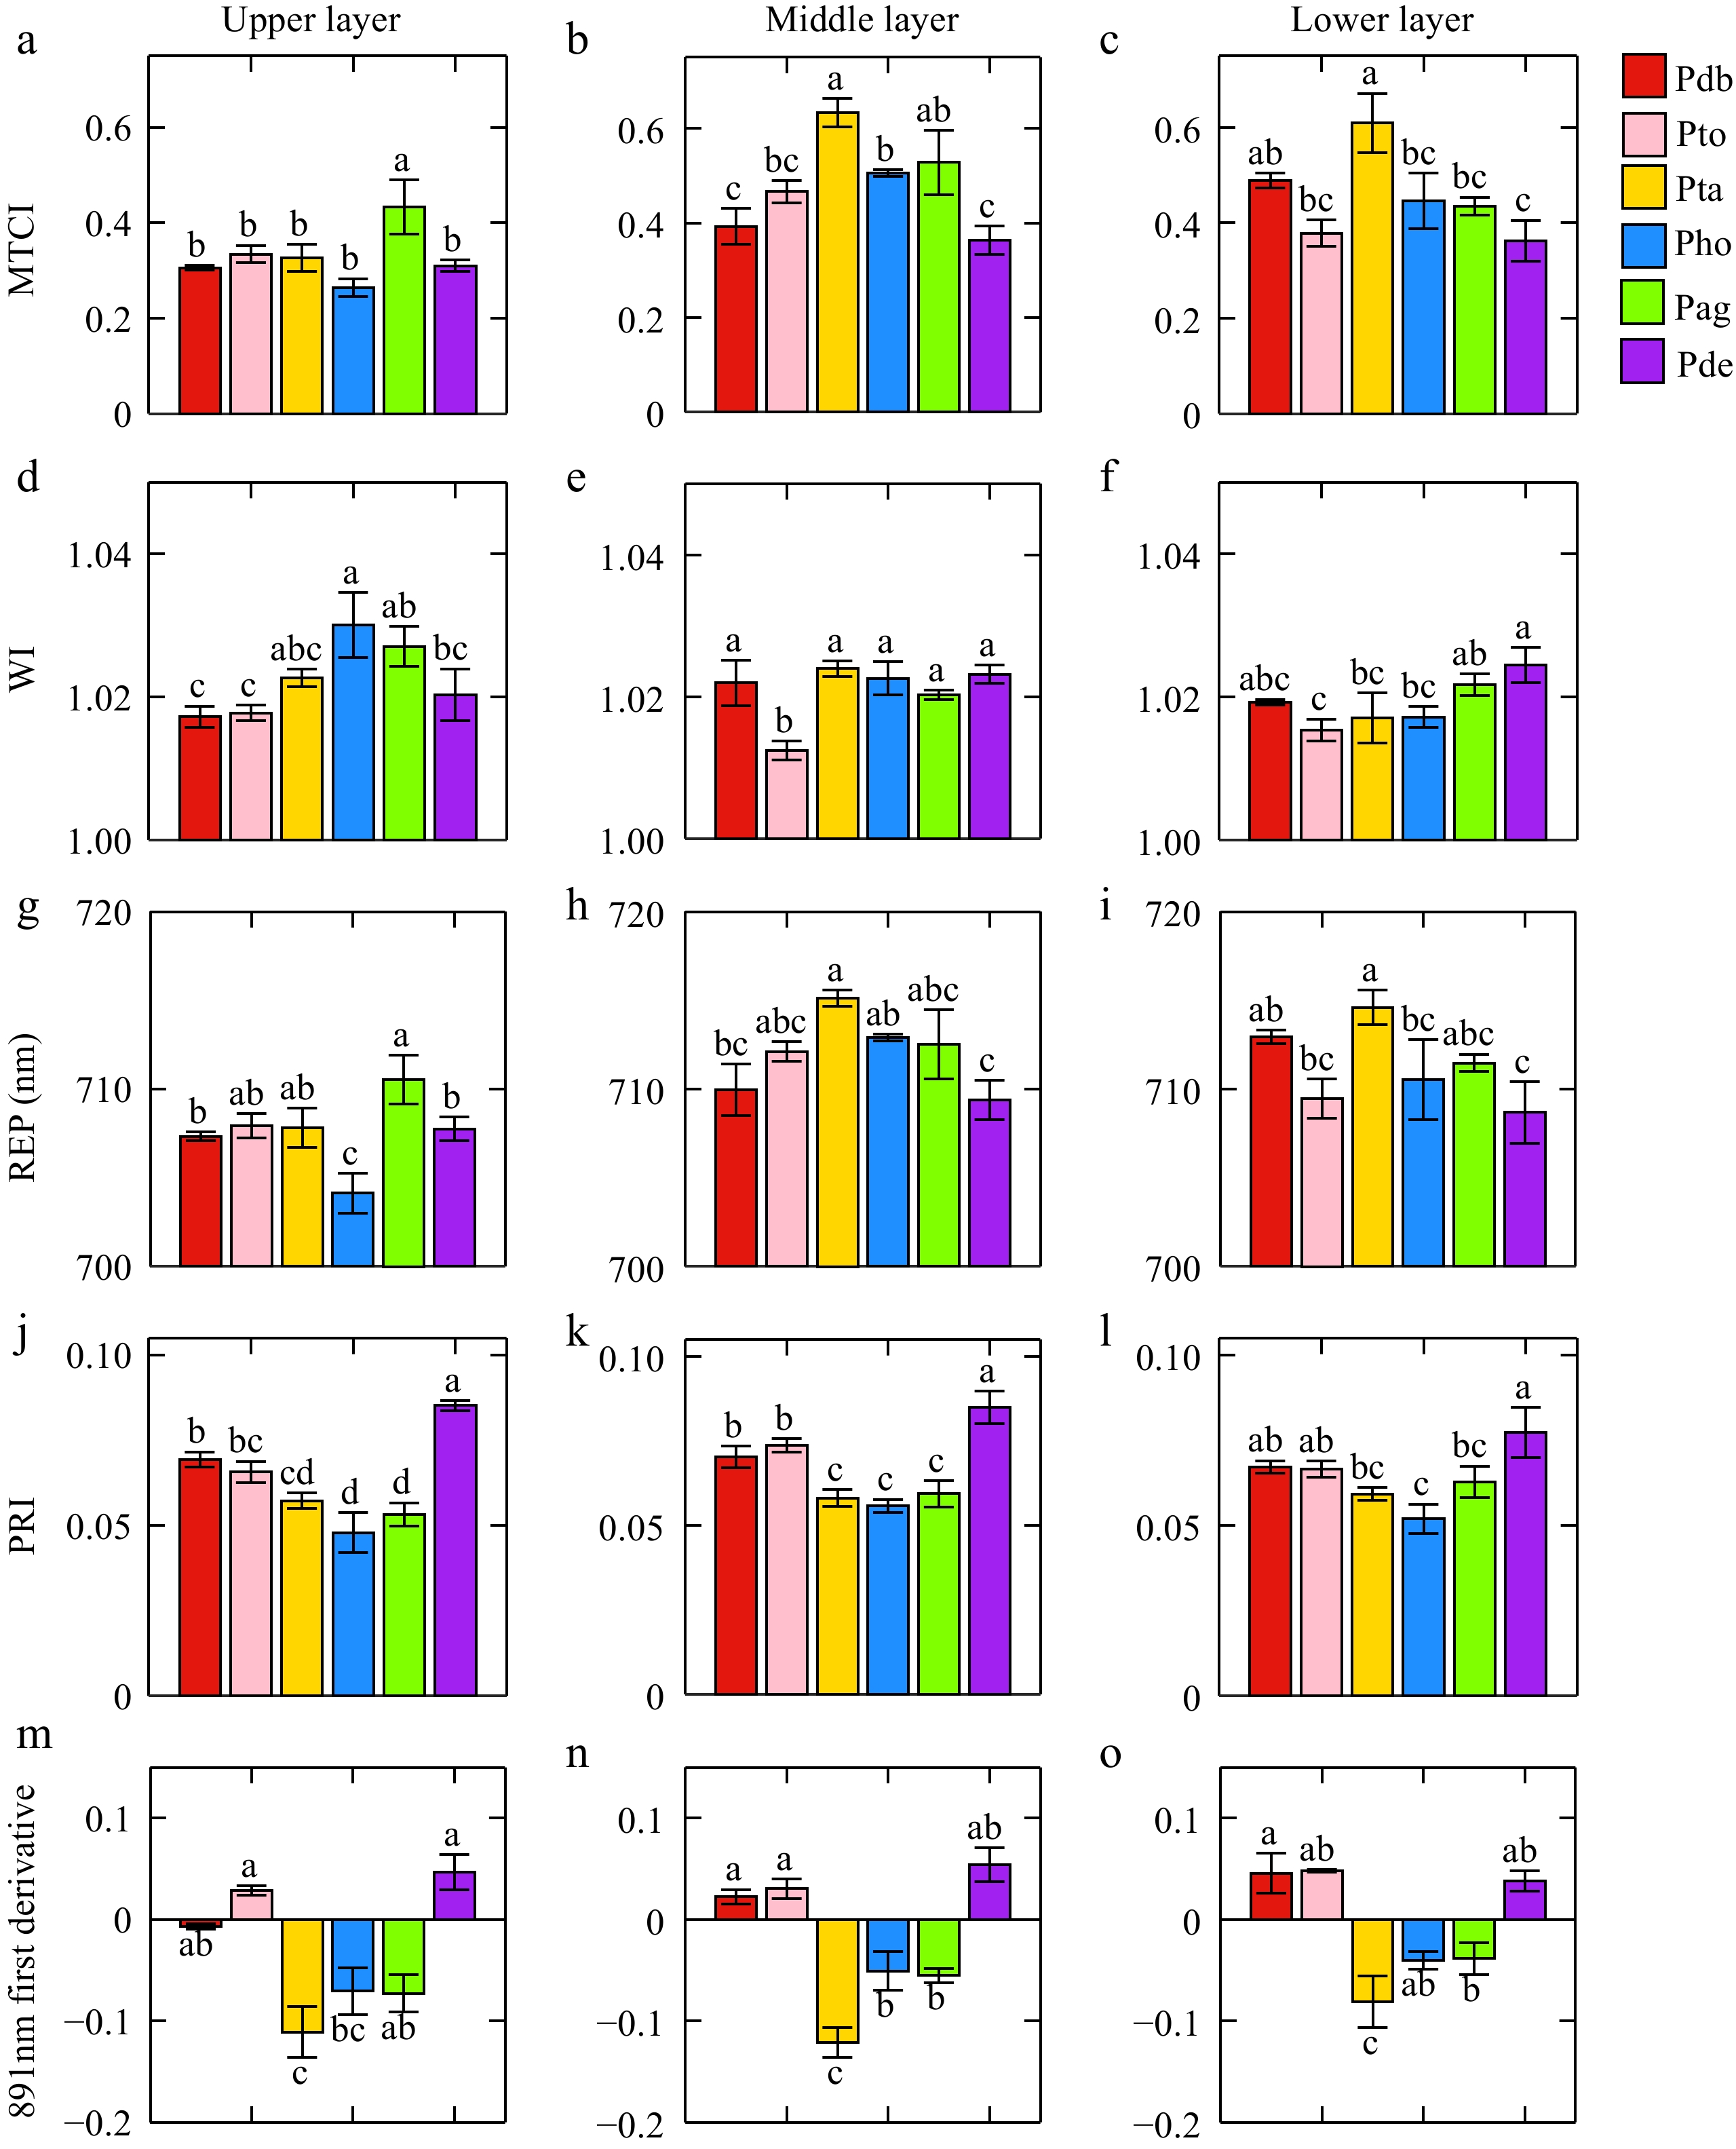
Figure 3.
Differences in leaf spectral features of different poplar genotypes. (a), (b), and (c) present the differences of MTCI in the upper, middle, and lower layers, respectively. (d), (e), and (f) indicate the differences of WI in the upper, middle, and lower layers. (g), (h), and (i) were the differences of REP in the upper, middle, and lower layers. (j), (k), and (l) indicate the differences of PRI in the upper, middle, and lower layers. (m), (n), and (o) indicate the differences of 891 nm first-derivation in the upper, middle, and lower layers.
-
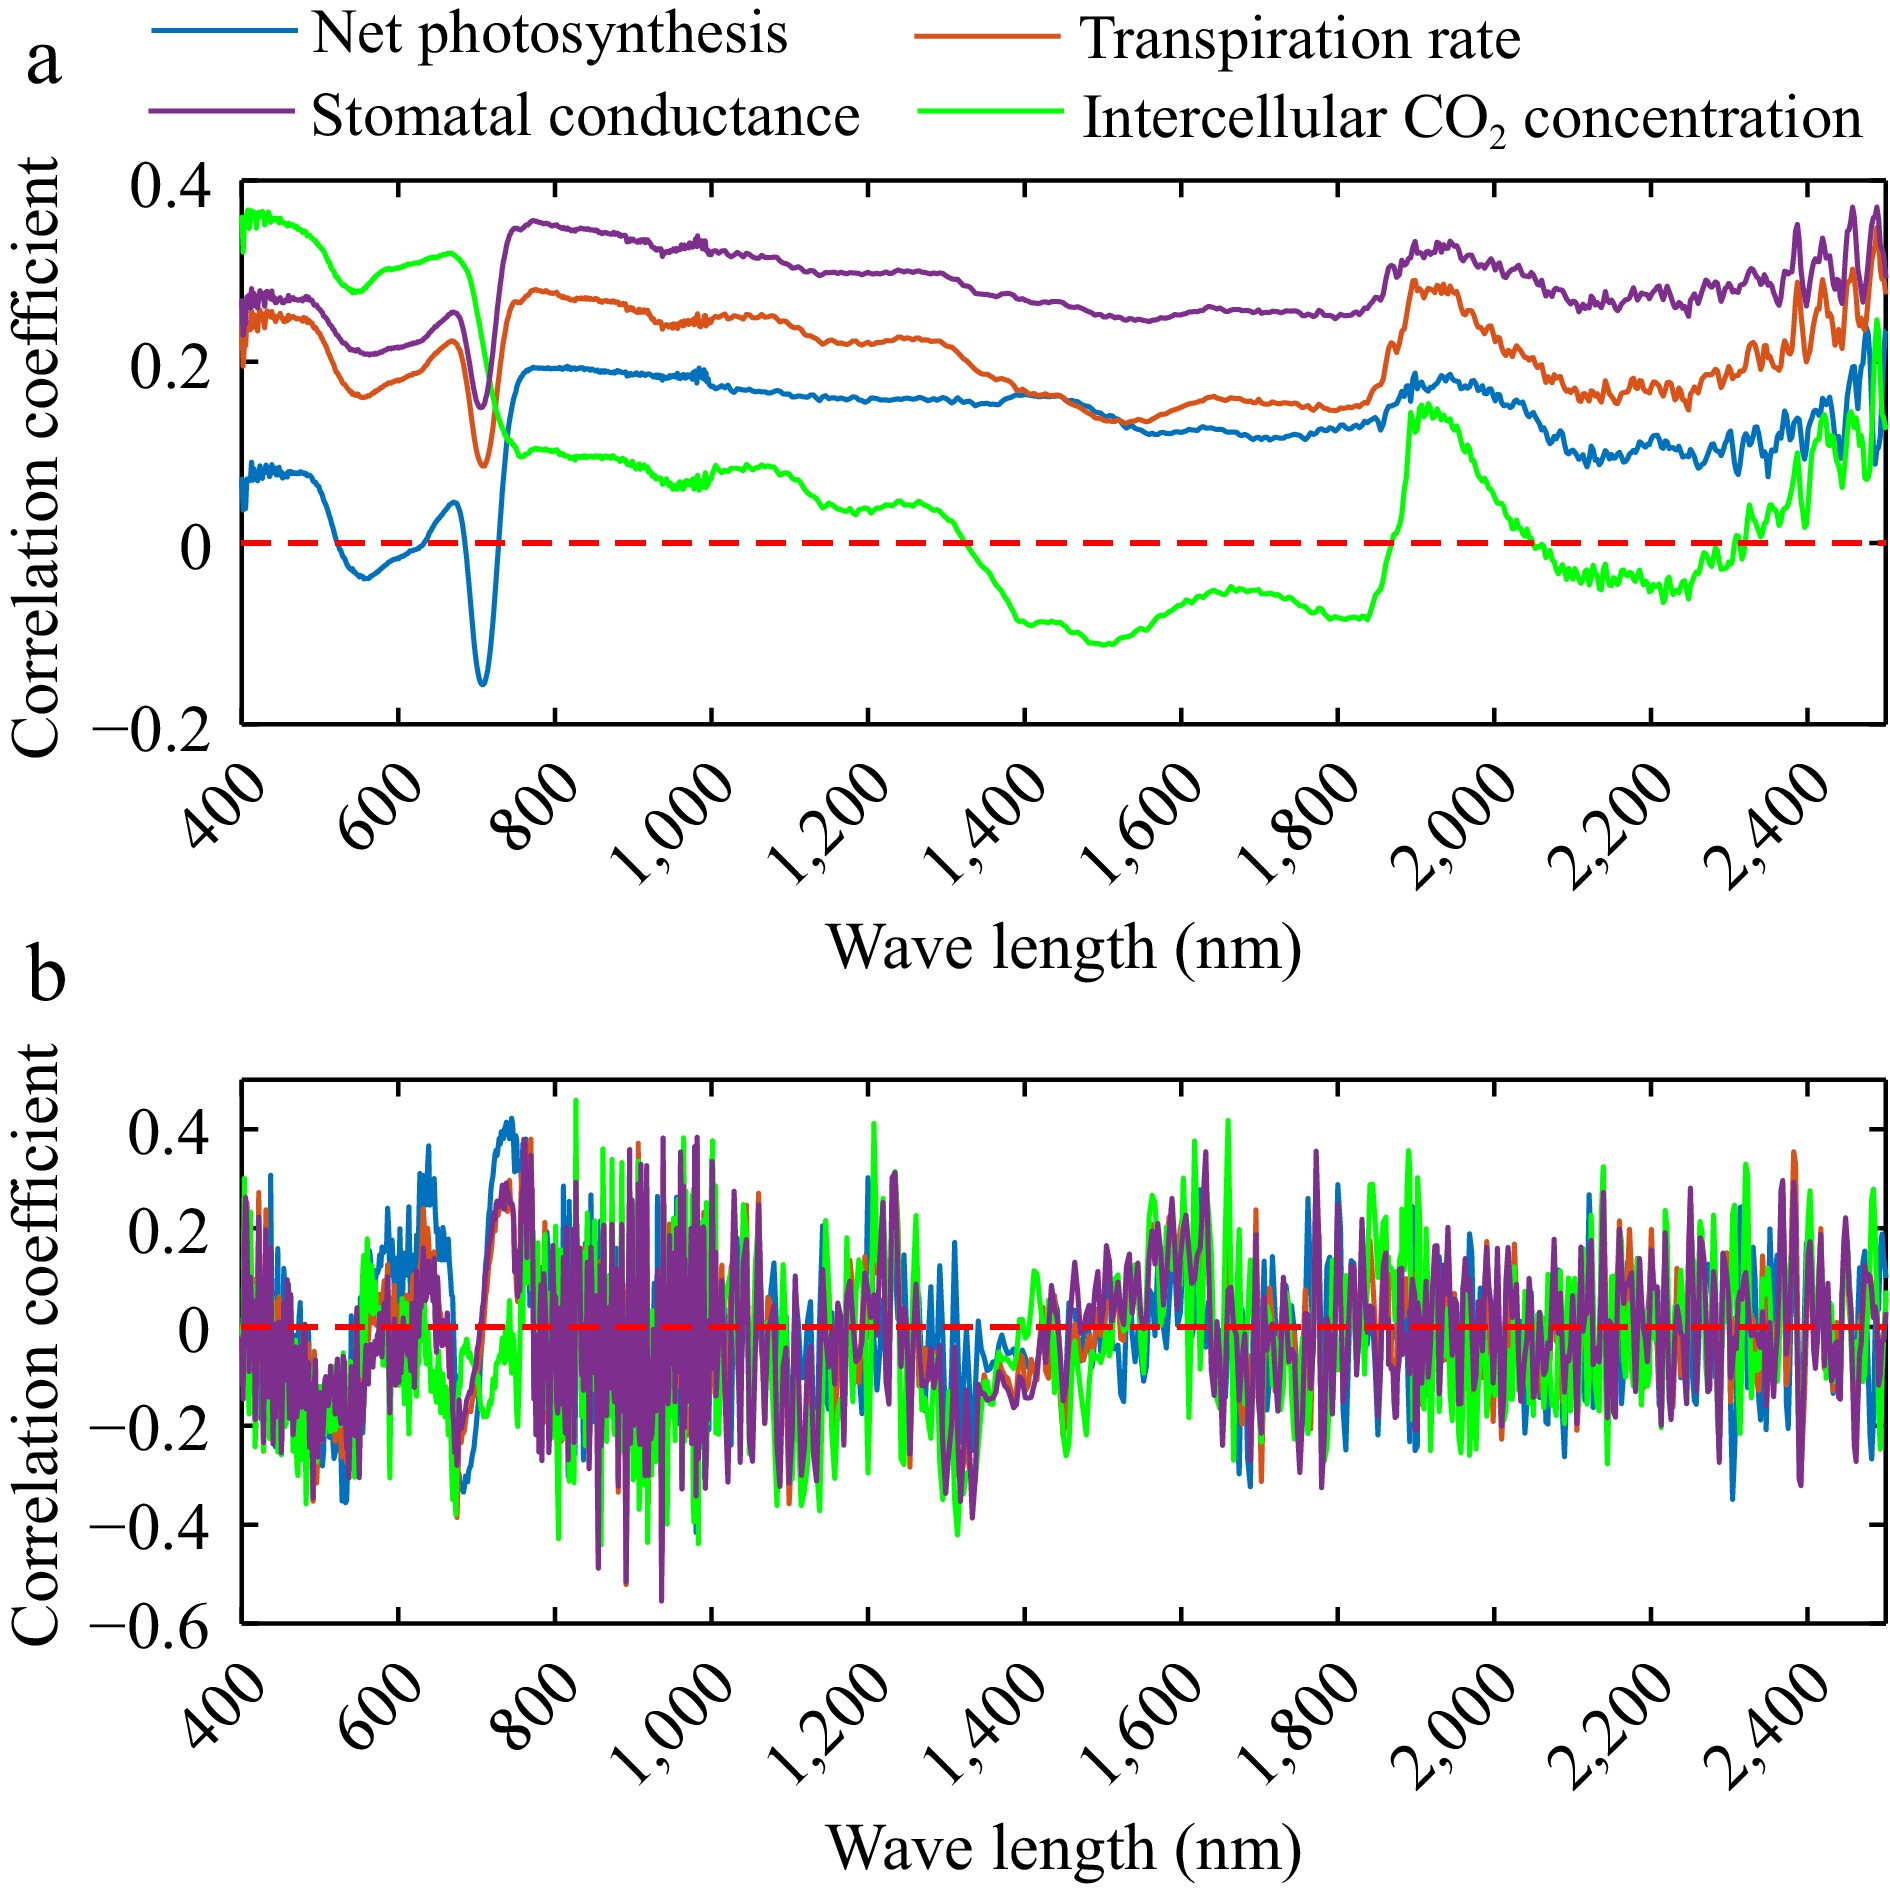
Figure 4.
Correlation between (a) reflectance, (b) first order derivation and photosynthetic parameters including net photosynthetic rate, transpiration rate, intercellular CO2 concentration, and stomatal conductance.
-
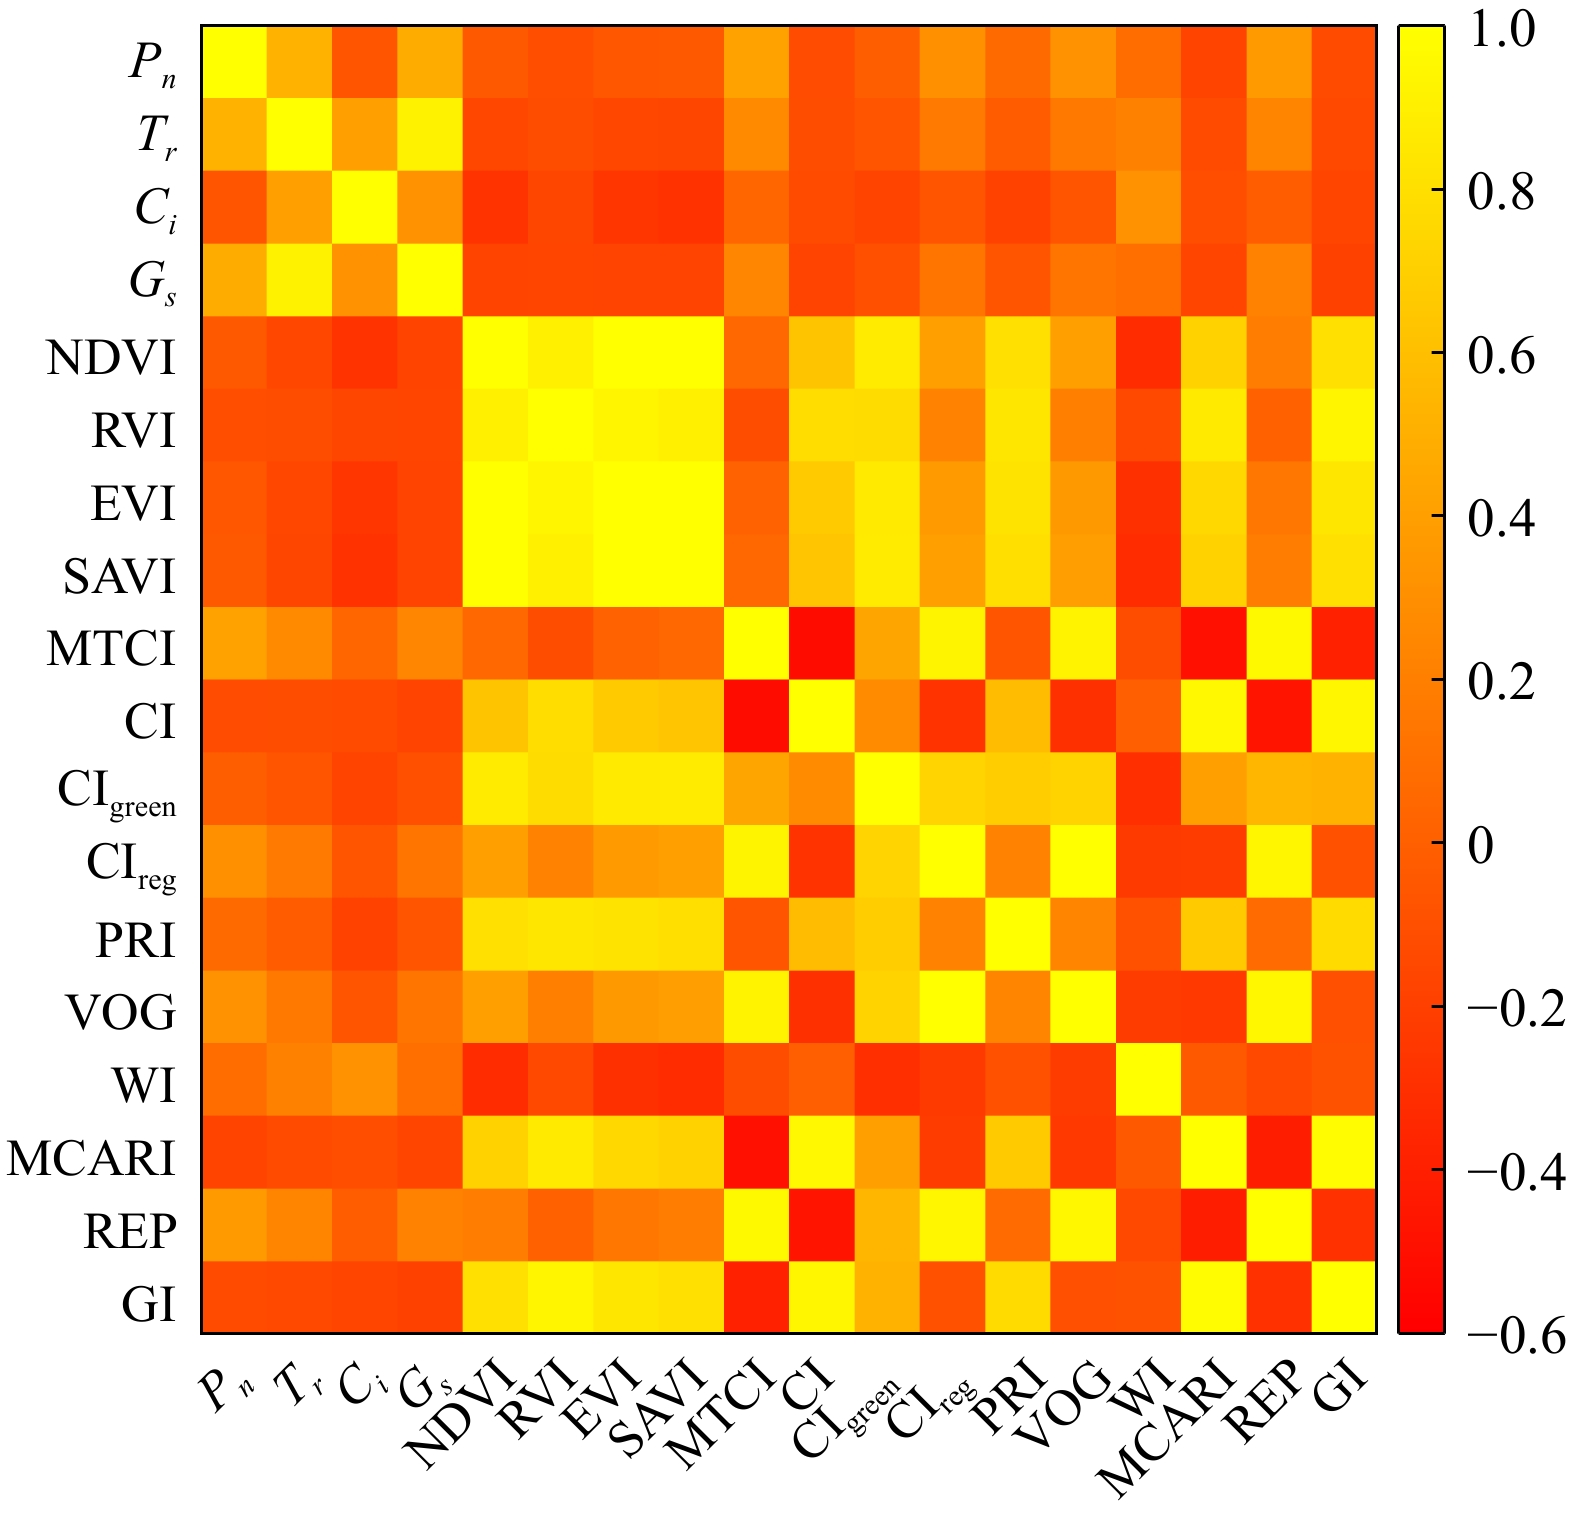
Figure 5.
Correlation between photosynthetic parameters and vegetation index.
-
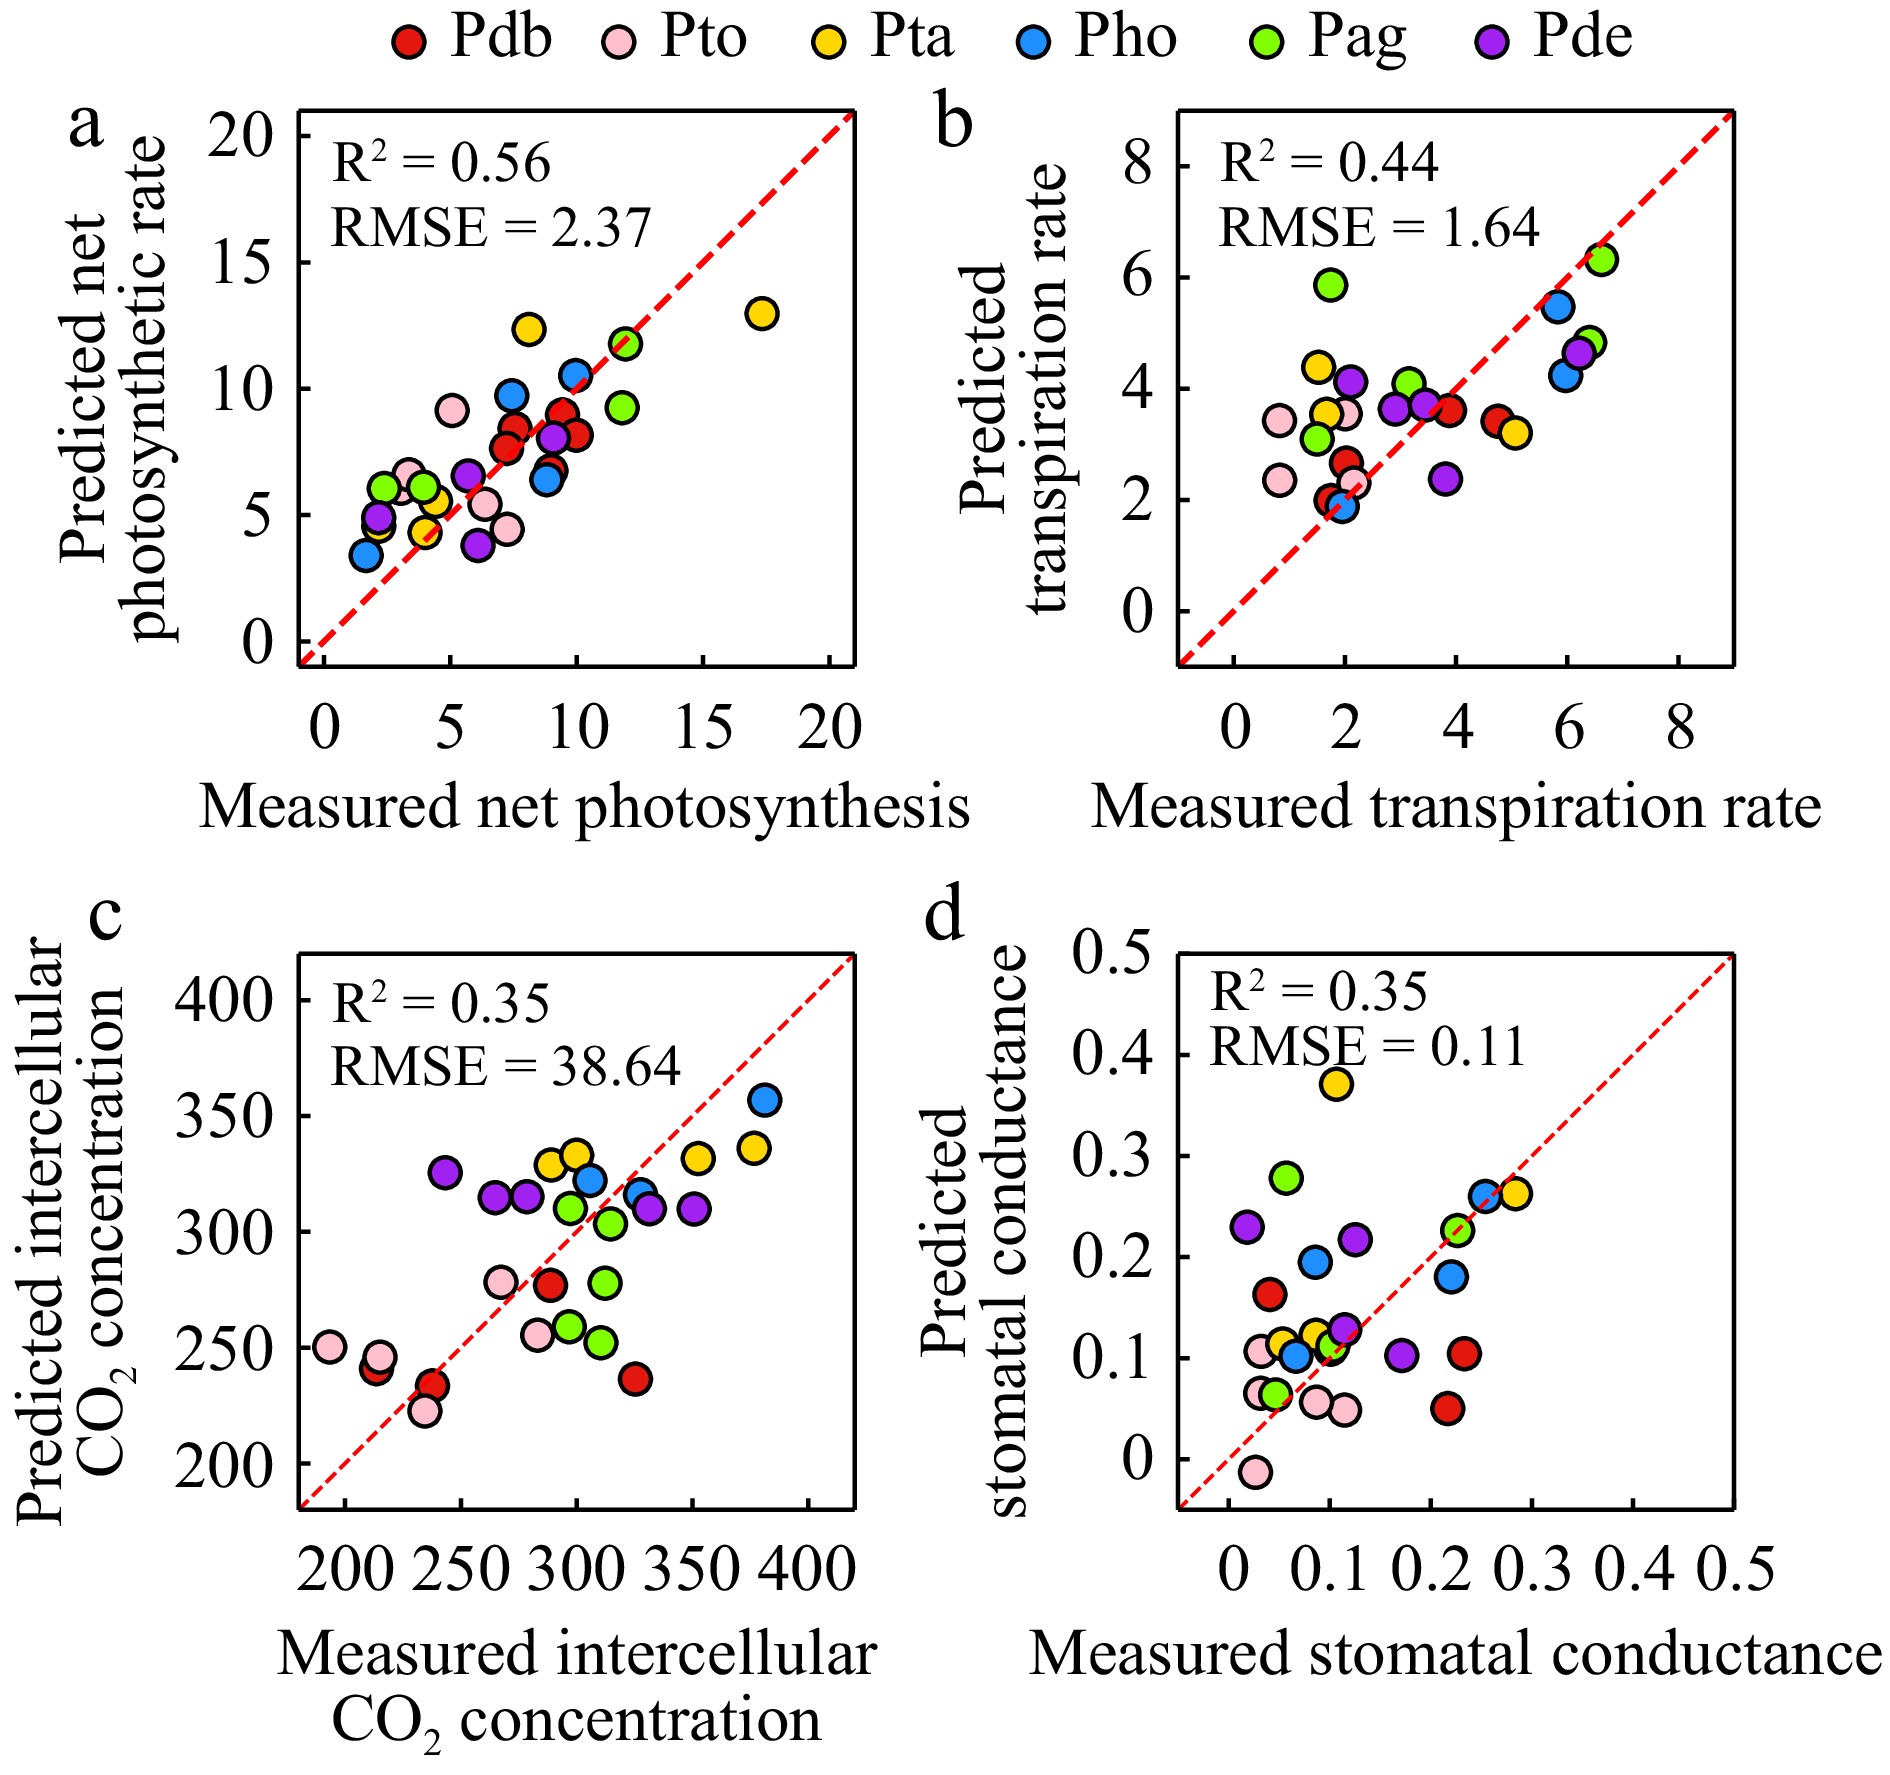
Figure 6.
Estimation of photosynthetic parameters including (a) net photosynthetic rate, (b) transpiration rate, (c) intercellular CO2 concentration, and (d) stomatal conductance.
-
Vegetation index Formula Ref. NDVI $ \rm NDVI=(NIR-RED)/(NIR+RED) $ [28] RVI $ \rm RVI=NIR/RED $ [29] SAVI $ \rm SAVI=\dfrac{{NIR-RED}}{1.5\times(NIR+RED+0.5)} $ [30] MTCI $\rm MTCI=(NIR-REG)/(REG-RED) $ [31] EVI $\rm EVI=\dfrac{{2.5 \times (NIR-REG)}}{(1+NIR+2.4 \times RED)} $ [32] CI $ \rm CI=\left({{R}}_{{640}}-{{R}}_{{673}}\right)/{{R}}_{{673}} $ [33] CIgreen $\rm {{CI}}_{{green}}=NIR/Green-1 $ CIreg $ \rm {CI}_{{reg}}=NIR/REG-1 $ PRI $ \rm PRI={{(R}}_{{531}}-{{R}}_{{570}})/{{(R}}_{{531}}+{{R}}_{{570}}) $ [34] VOG $\rm VOG={{R}}_{{740}}/{{R}}_{{720}} $ [35] WI $ \rm WI={{R}}_{{900}}/{{R}}_{{970}} $ [36] MCARI $\begin{aligned}& \rm MCARI=[({{R}}_{{700}}-{{R}}_{{670}})-0.2 \;\times\\ &\rm ({{R}}_{{700}}-{{R}}_{{550}})]\times({{R}}_{{700}}/{{R}}_{{670}}) \end{aligned}$ [37] REP $ \rm REP=\dfrac{{700+40}\times \left[\left({{R}}_{{670}}+{{R}}_{{780}}\right)/2-{{R}}_{{700}}\right]}{{{R}}_{{740}}-{{R}}_{{700}}} $ [38] GI $ \rm GI={{R}}_{{554}}/{{R}}_{{667}} $ [39] NIR (780−800 nm) represents the near-infrared band, RED (660−680 nm) represents the red band, and REG (710−730 nm) represents the red edge band. Table 1.
Formula of vegetation index.
-
Photosynthetic parameters Selected feature Pn MTCI, REP, VOG, CIreg, MCARI, GI, CI, RVI, WI, PRI Ci WI, NDVI, SAVI, EVI, PRI, D826.8, D918.4, D1207.5, D907.6, D885.4 Gs MTCI, REP, GI, EVI, CI, D891, D978.5, D491.1, D1001, D550.1 Tr MTCI, WI, REP, VOG, CIreg, D891, D491.1, D826.8, D918.4, D978.5 D represents first-order derivation. Table 2.
Selected variables in the optimal model of different photosynthetic parameters.
Figures
(6)
Tables
(2)