-
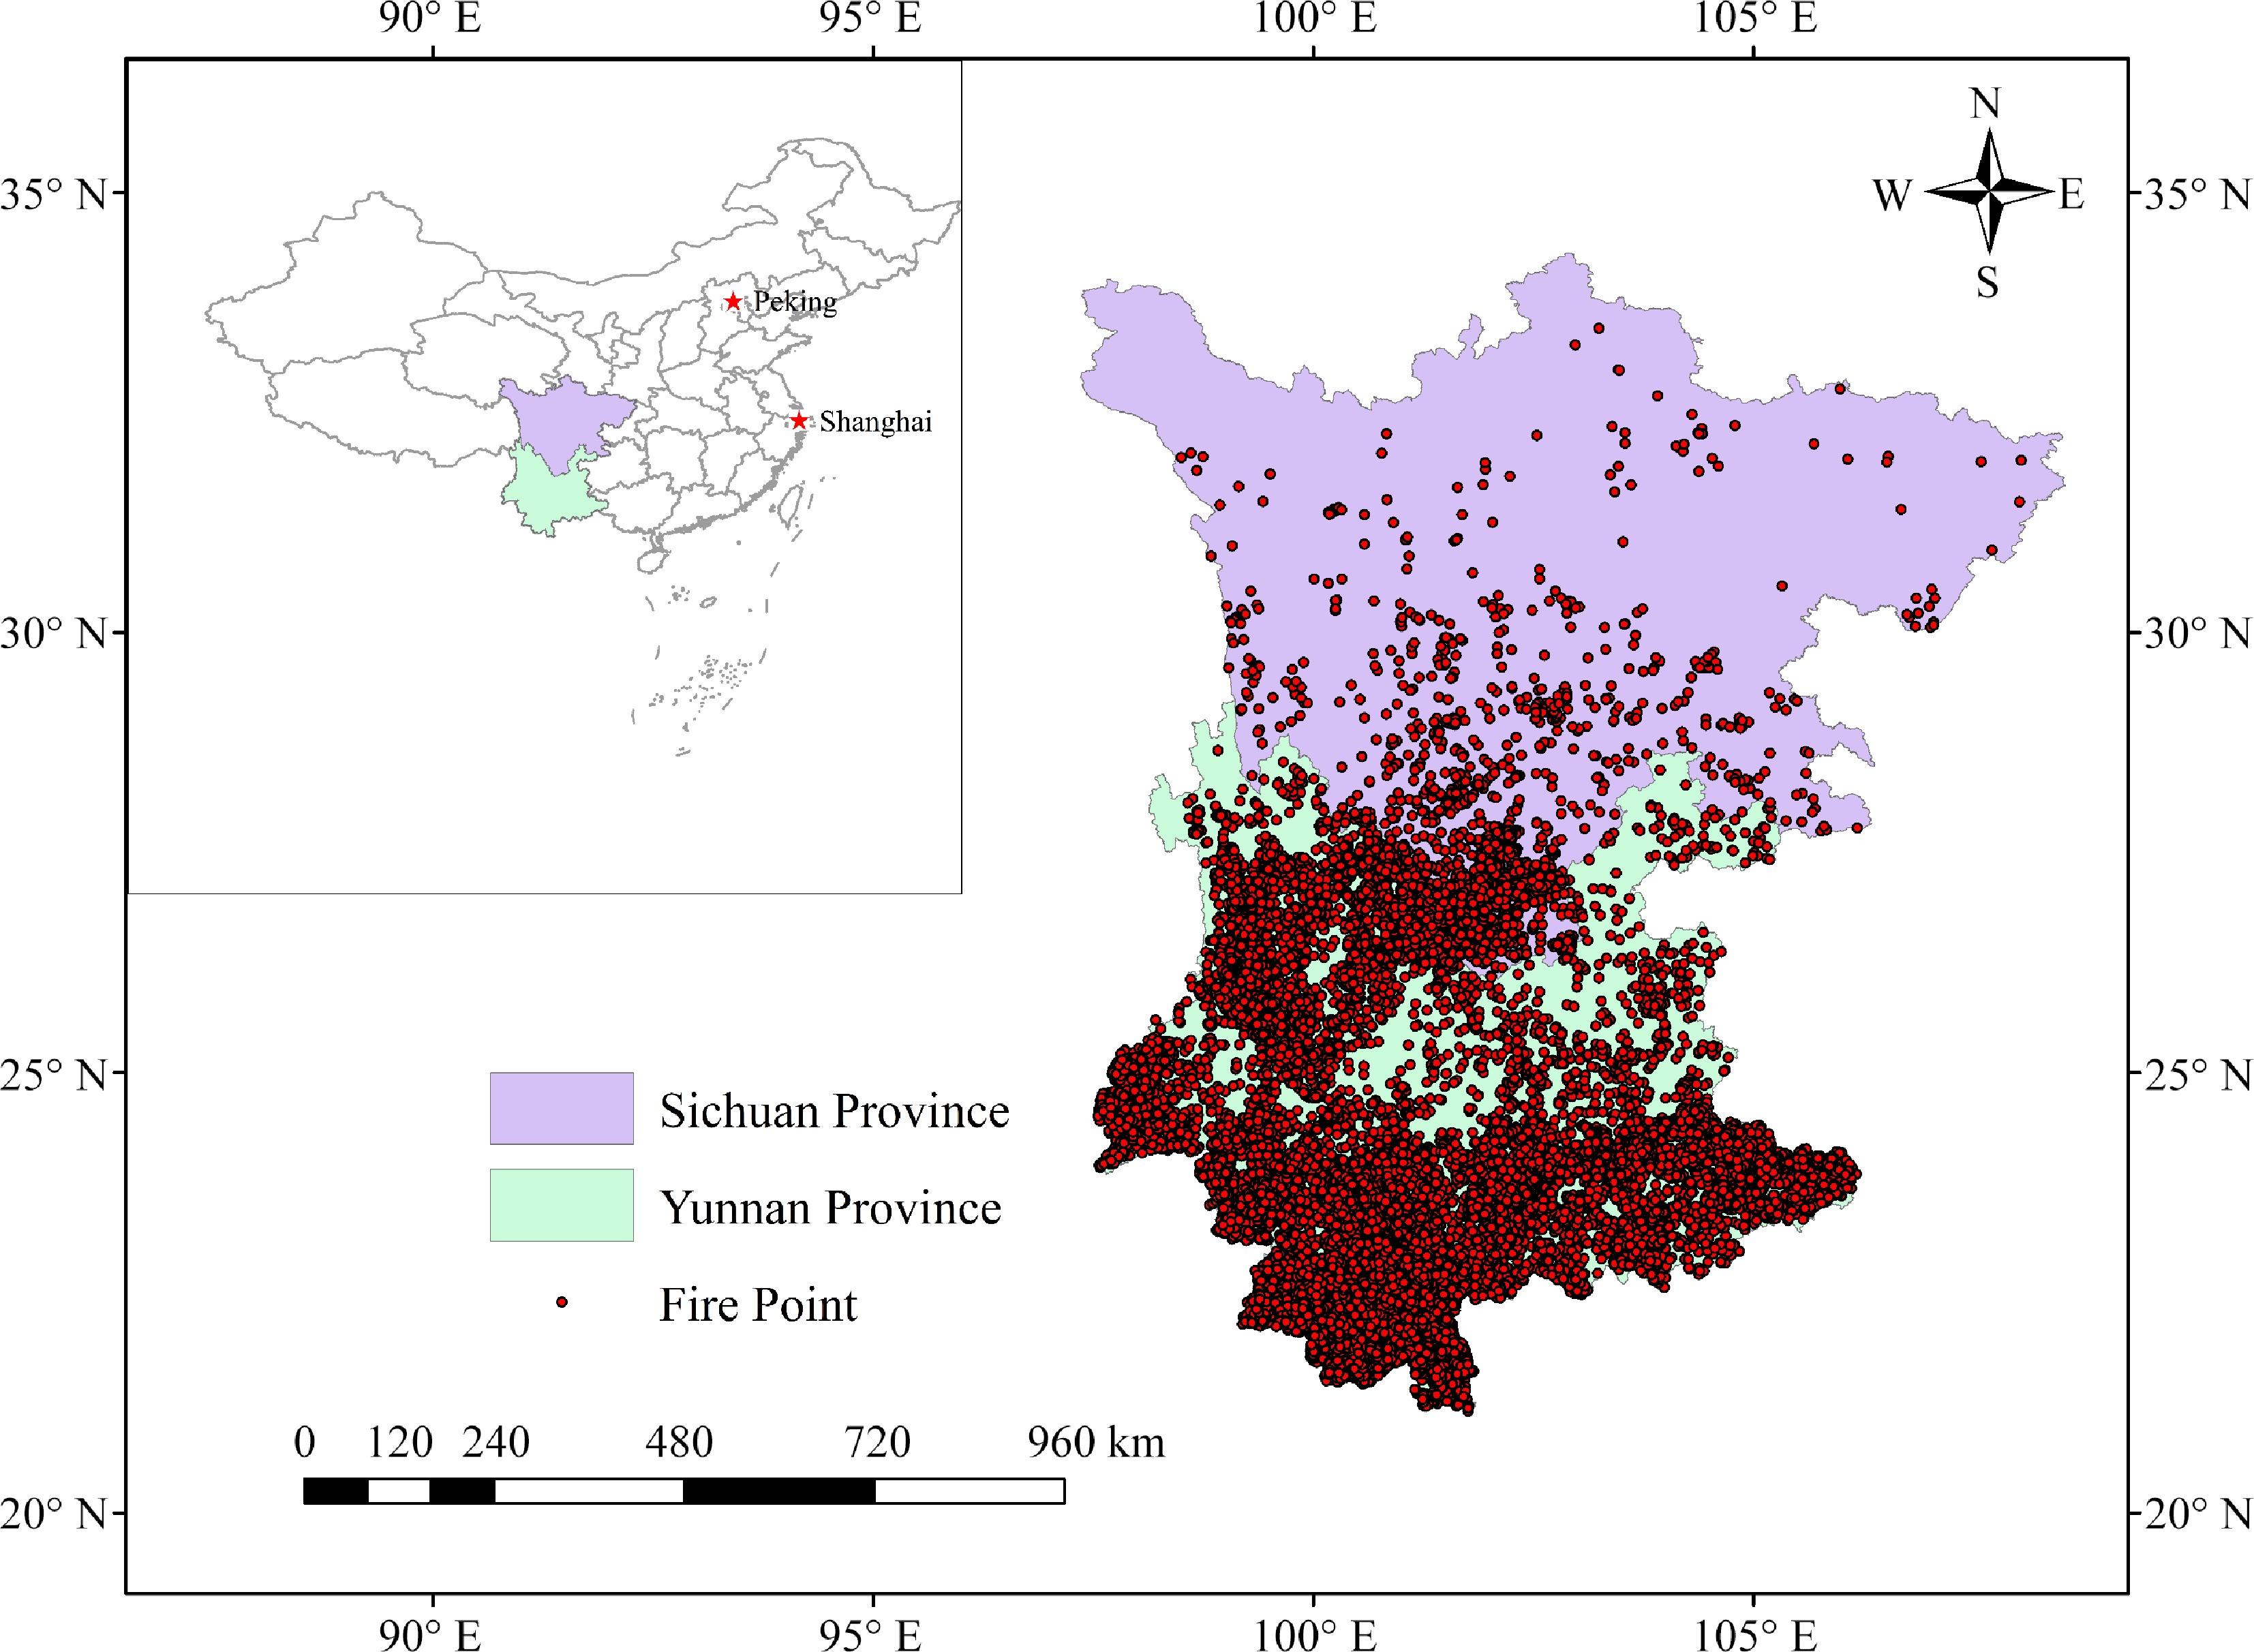
Figure 1.
Overview of the study region.
-
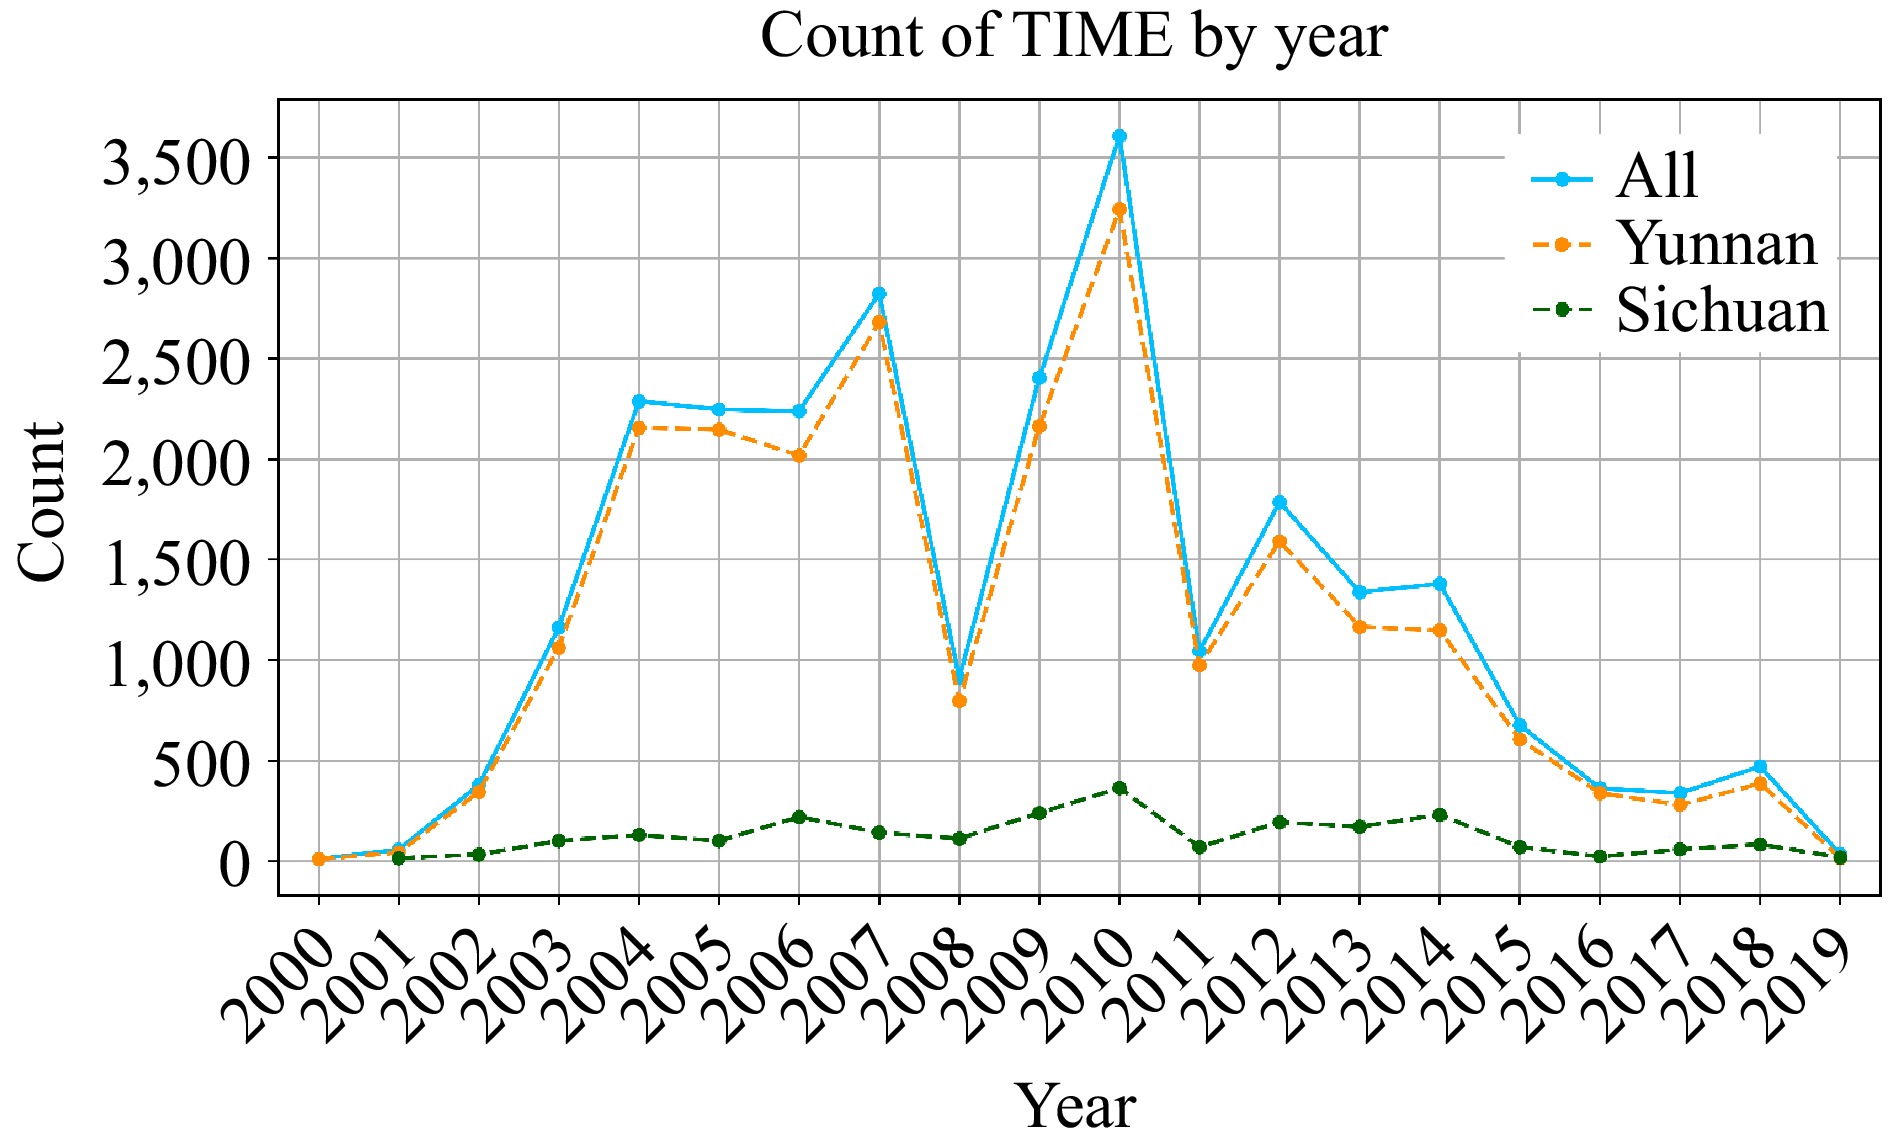
Figure 2.
Inter-annual variability of forest fires in Sichuan and Yunnan provinces.
-
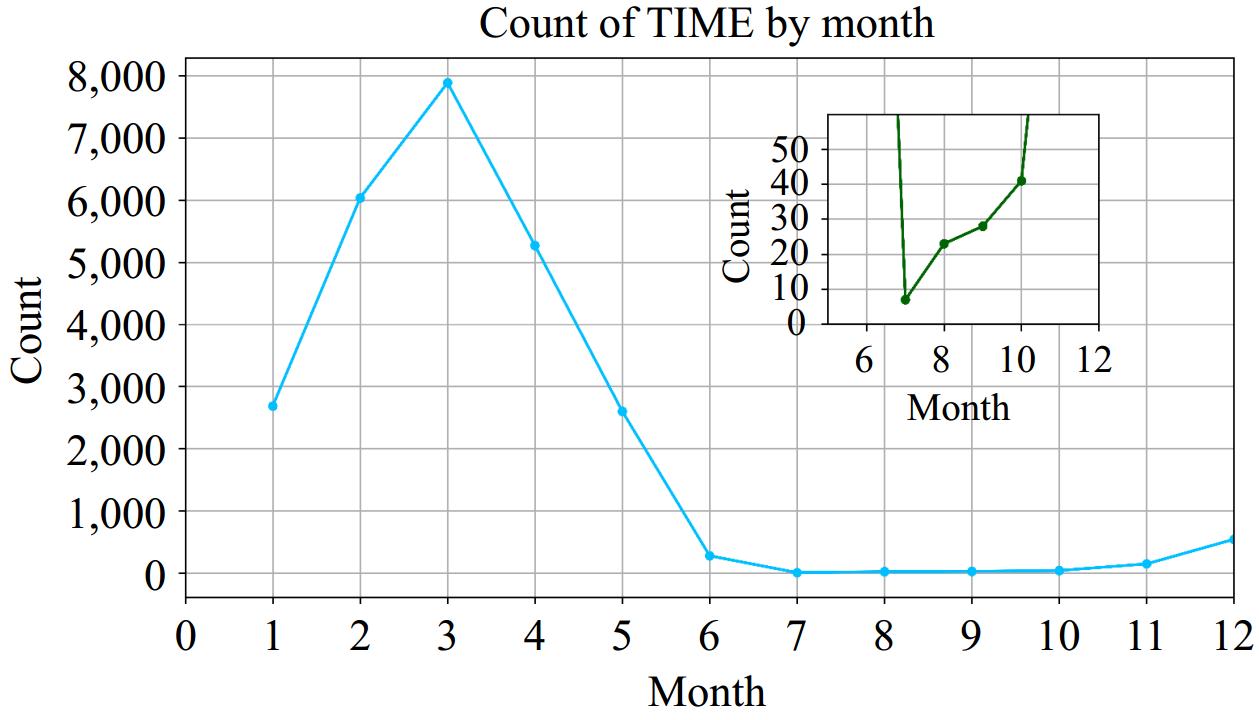
Figure 3.
Inter-monthly variation of forest fires in Sichuan and Yunnan provinces.
-
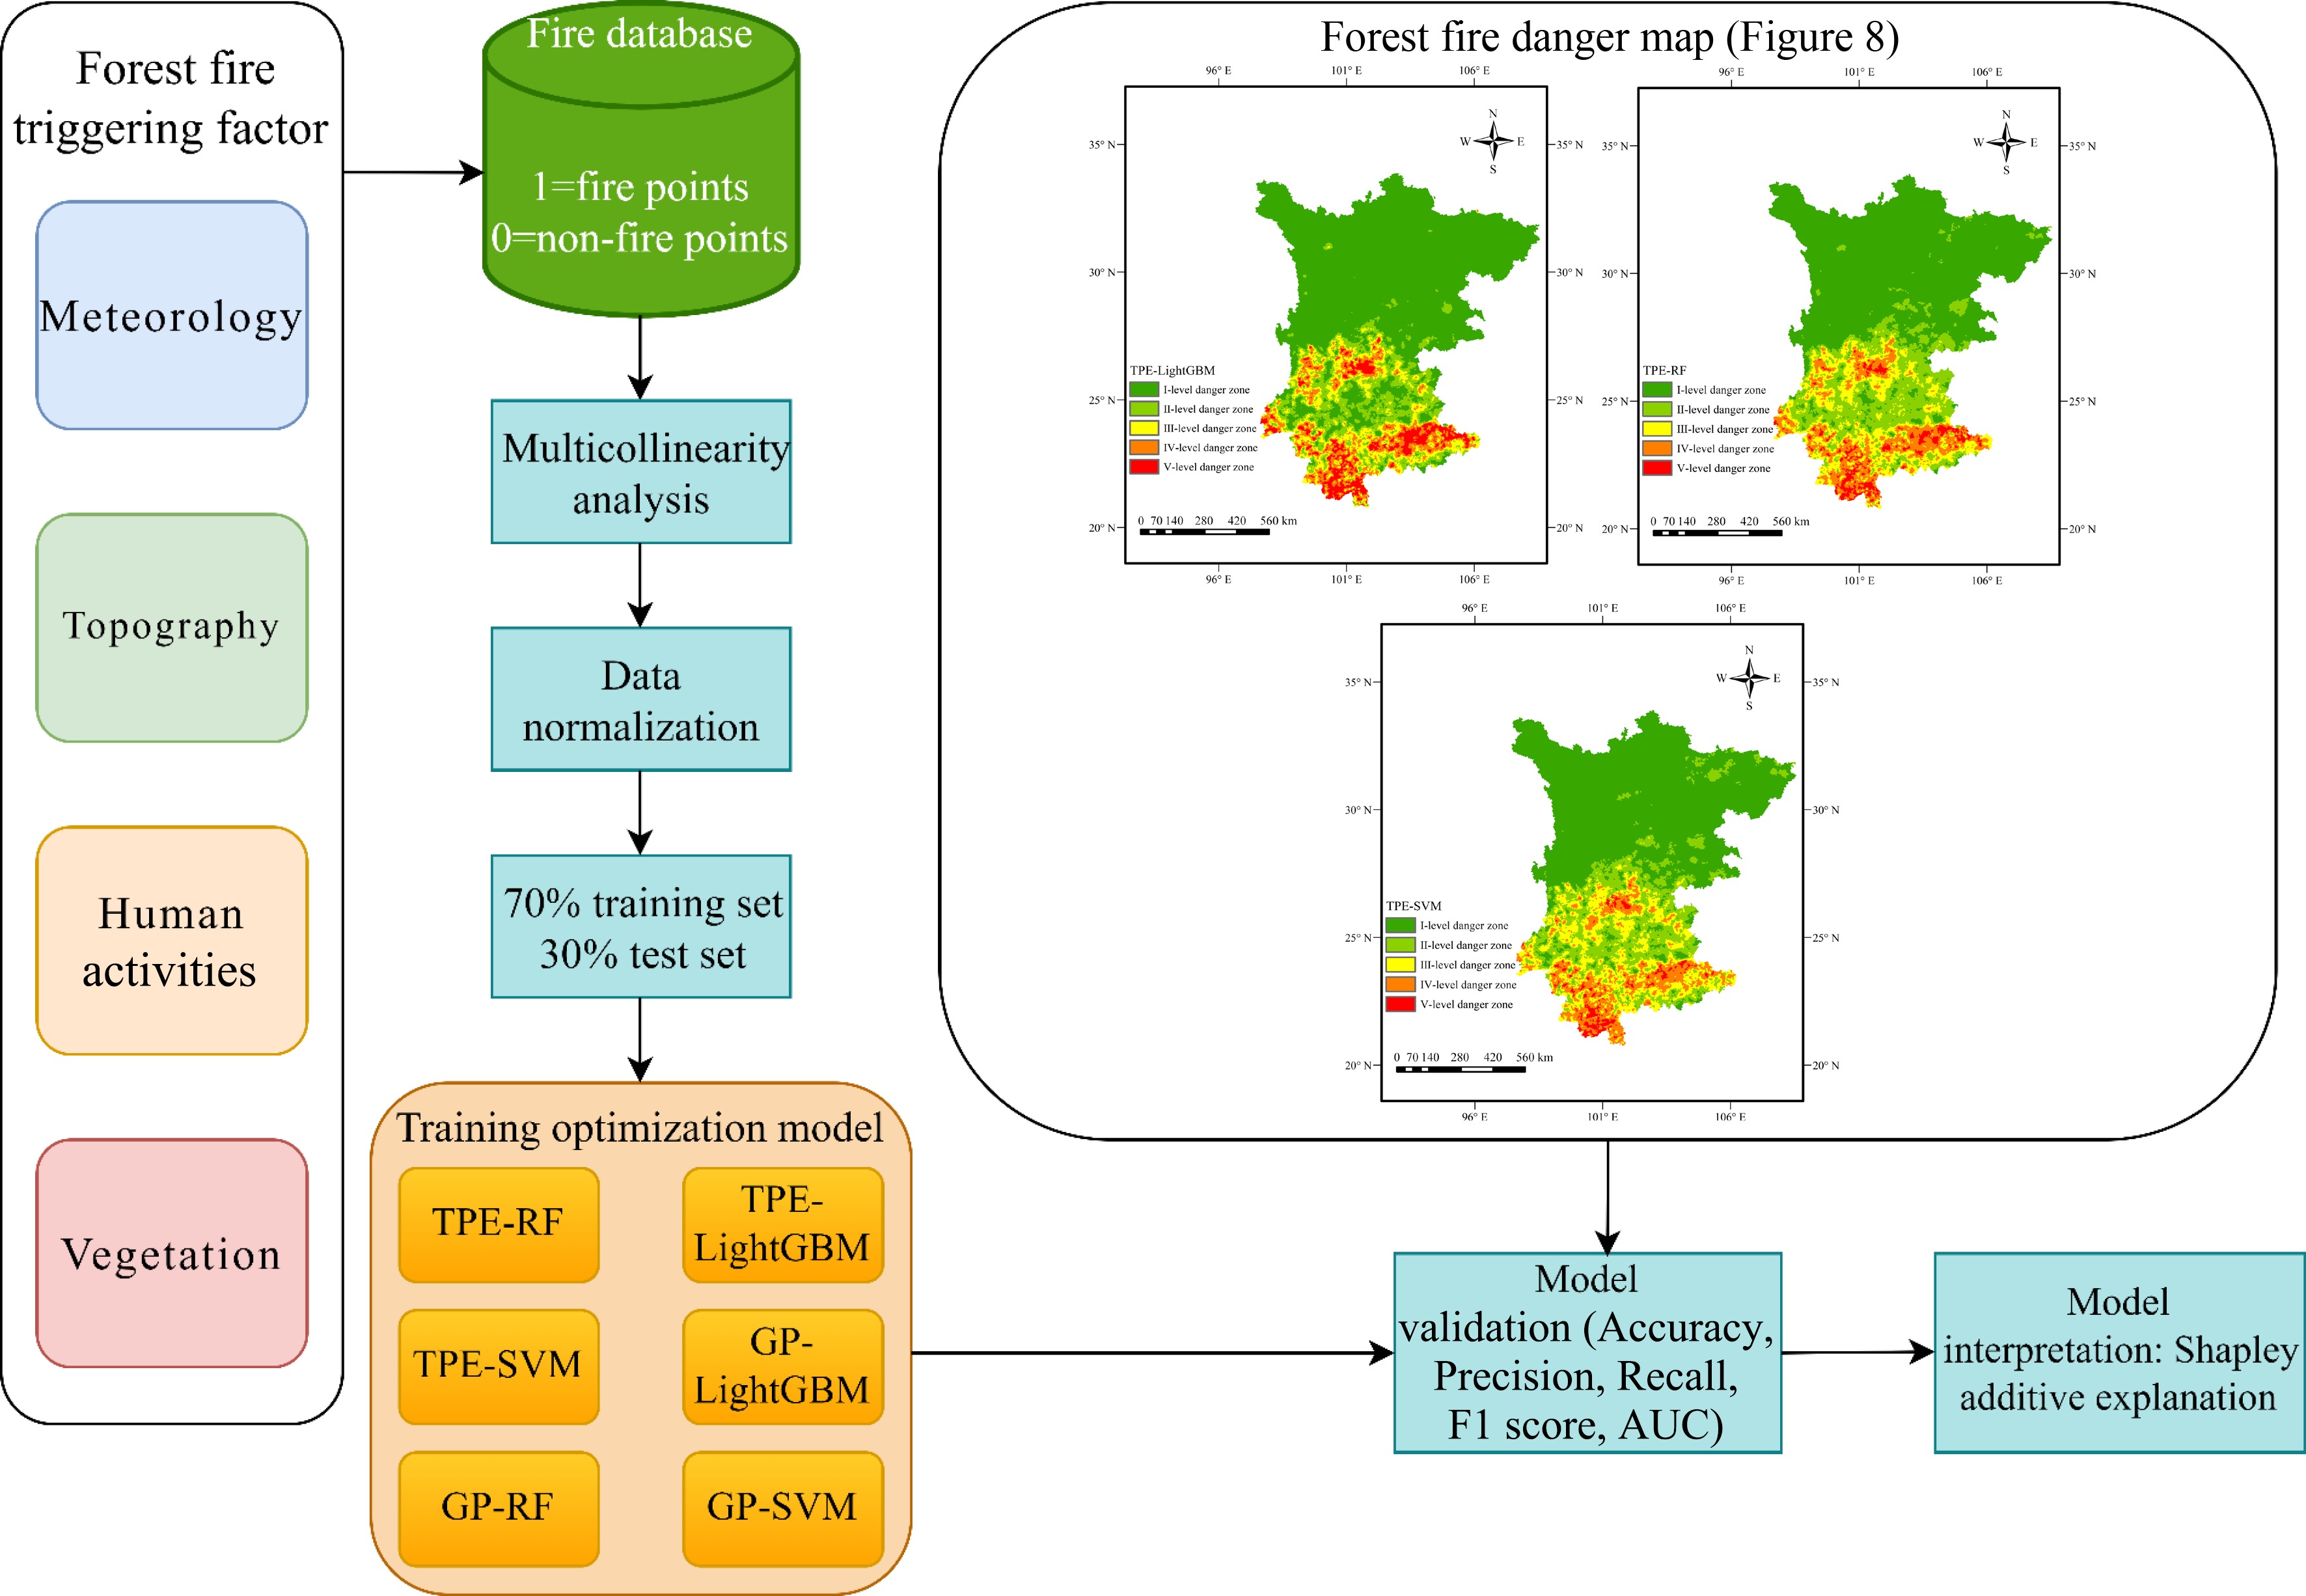
Figure 4.
Technology route.
-
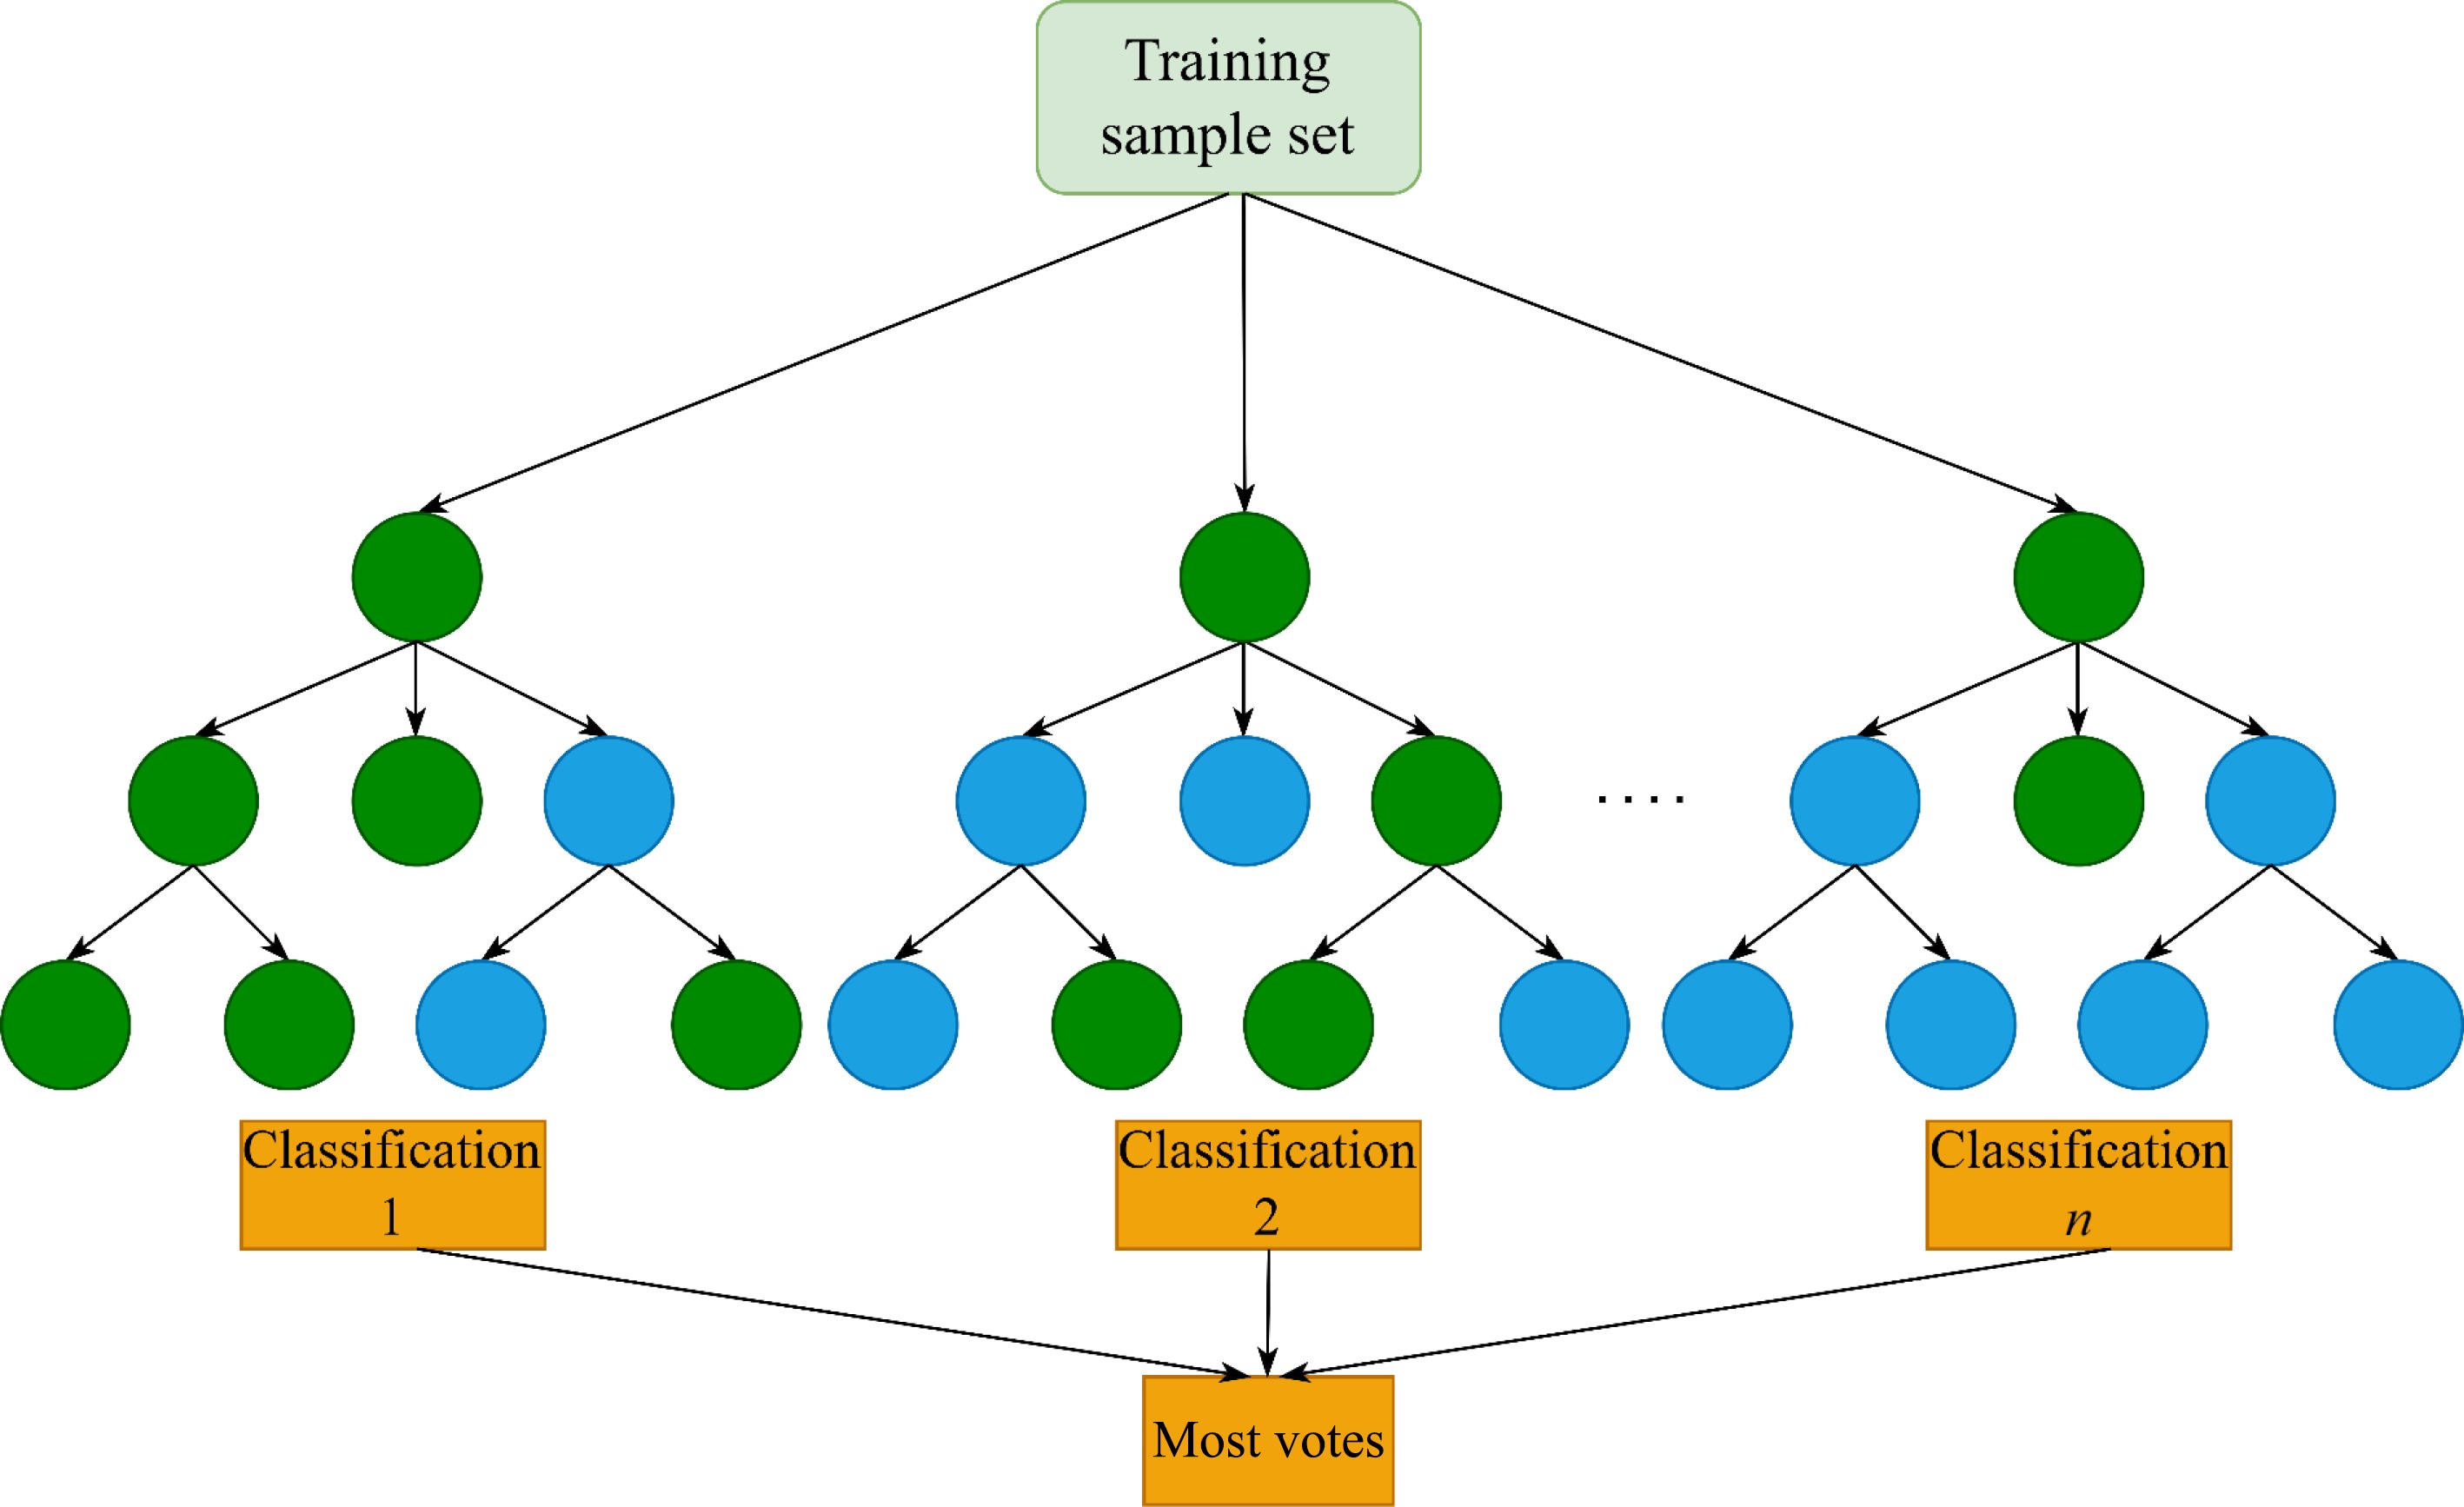
Figure 5.
Schematic diagram of the RF.
-

Figure 6.
Schematic diagram of the SVM.
-
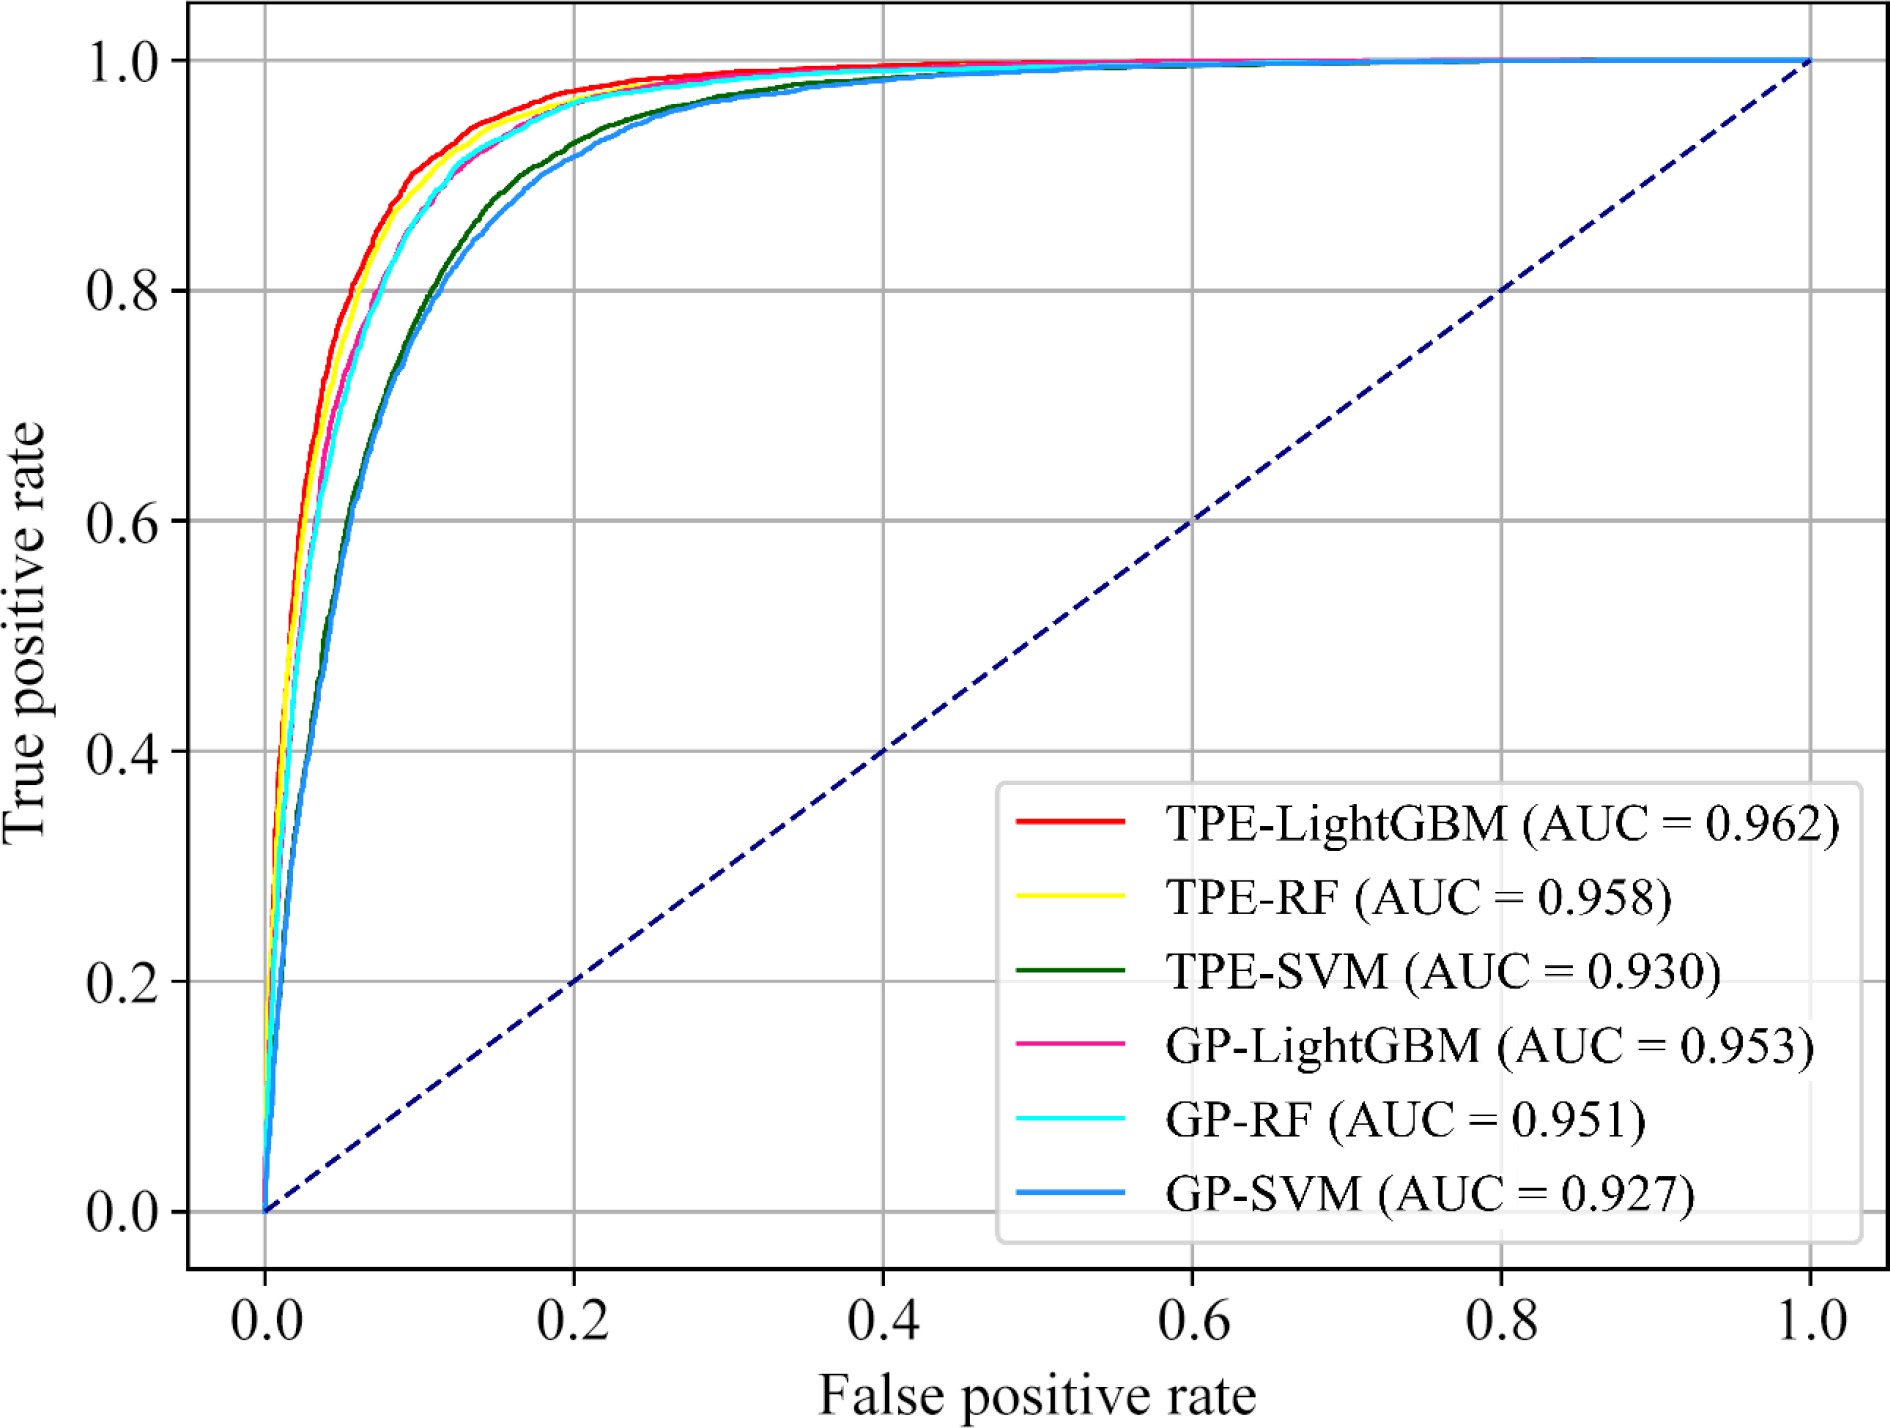
Figure 7.
ROC curve and AUC of LightGBM, RF, and SVM models, with parameter optimization performed using Bayesian optimization techniques: GP and TPE.
-

Figure 8.
Forest fire danger maps for the three models.
-
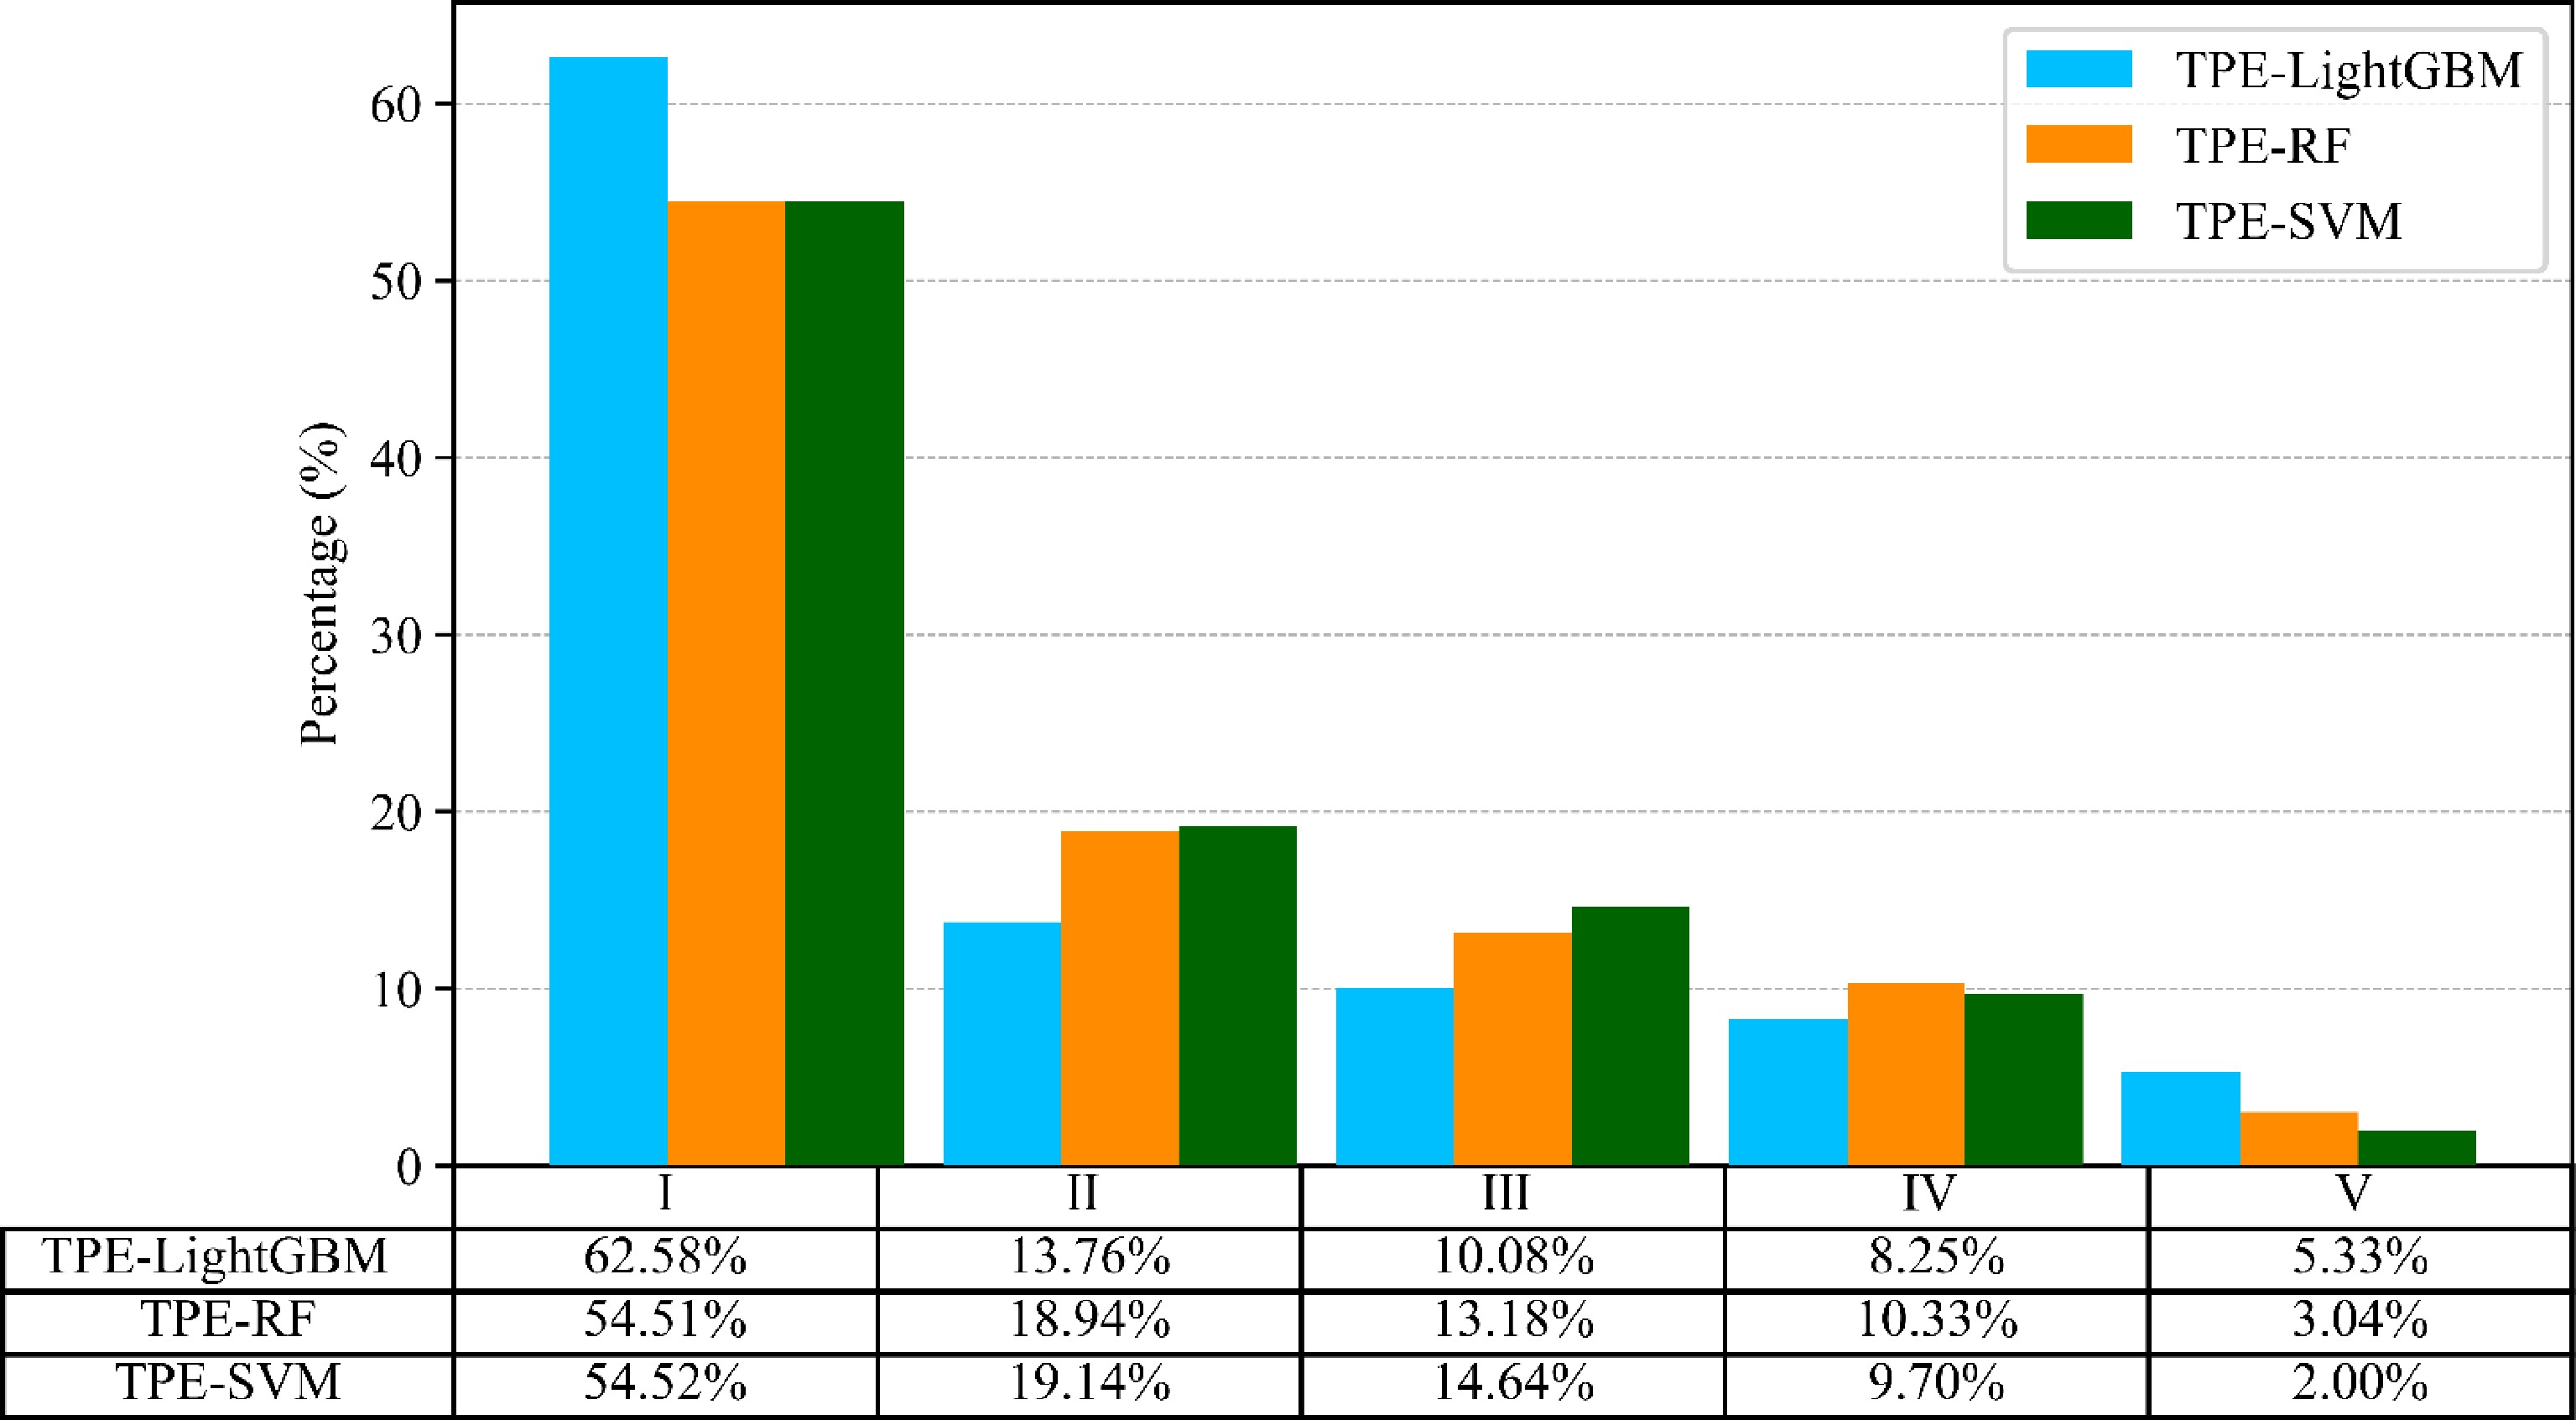
Figure 9.
Classification of forest fire danger levels.
-
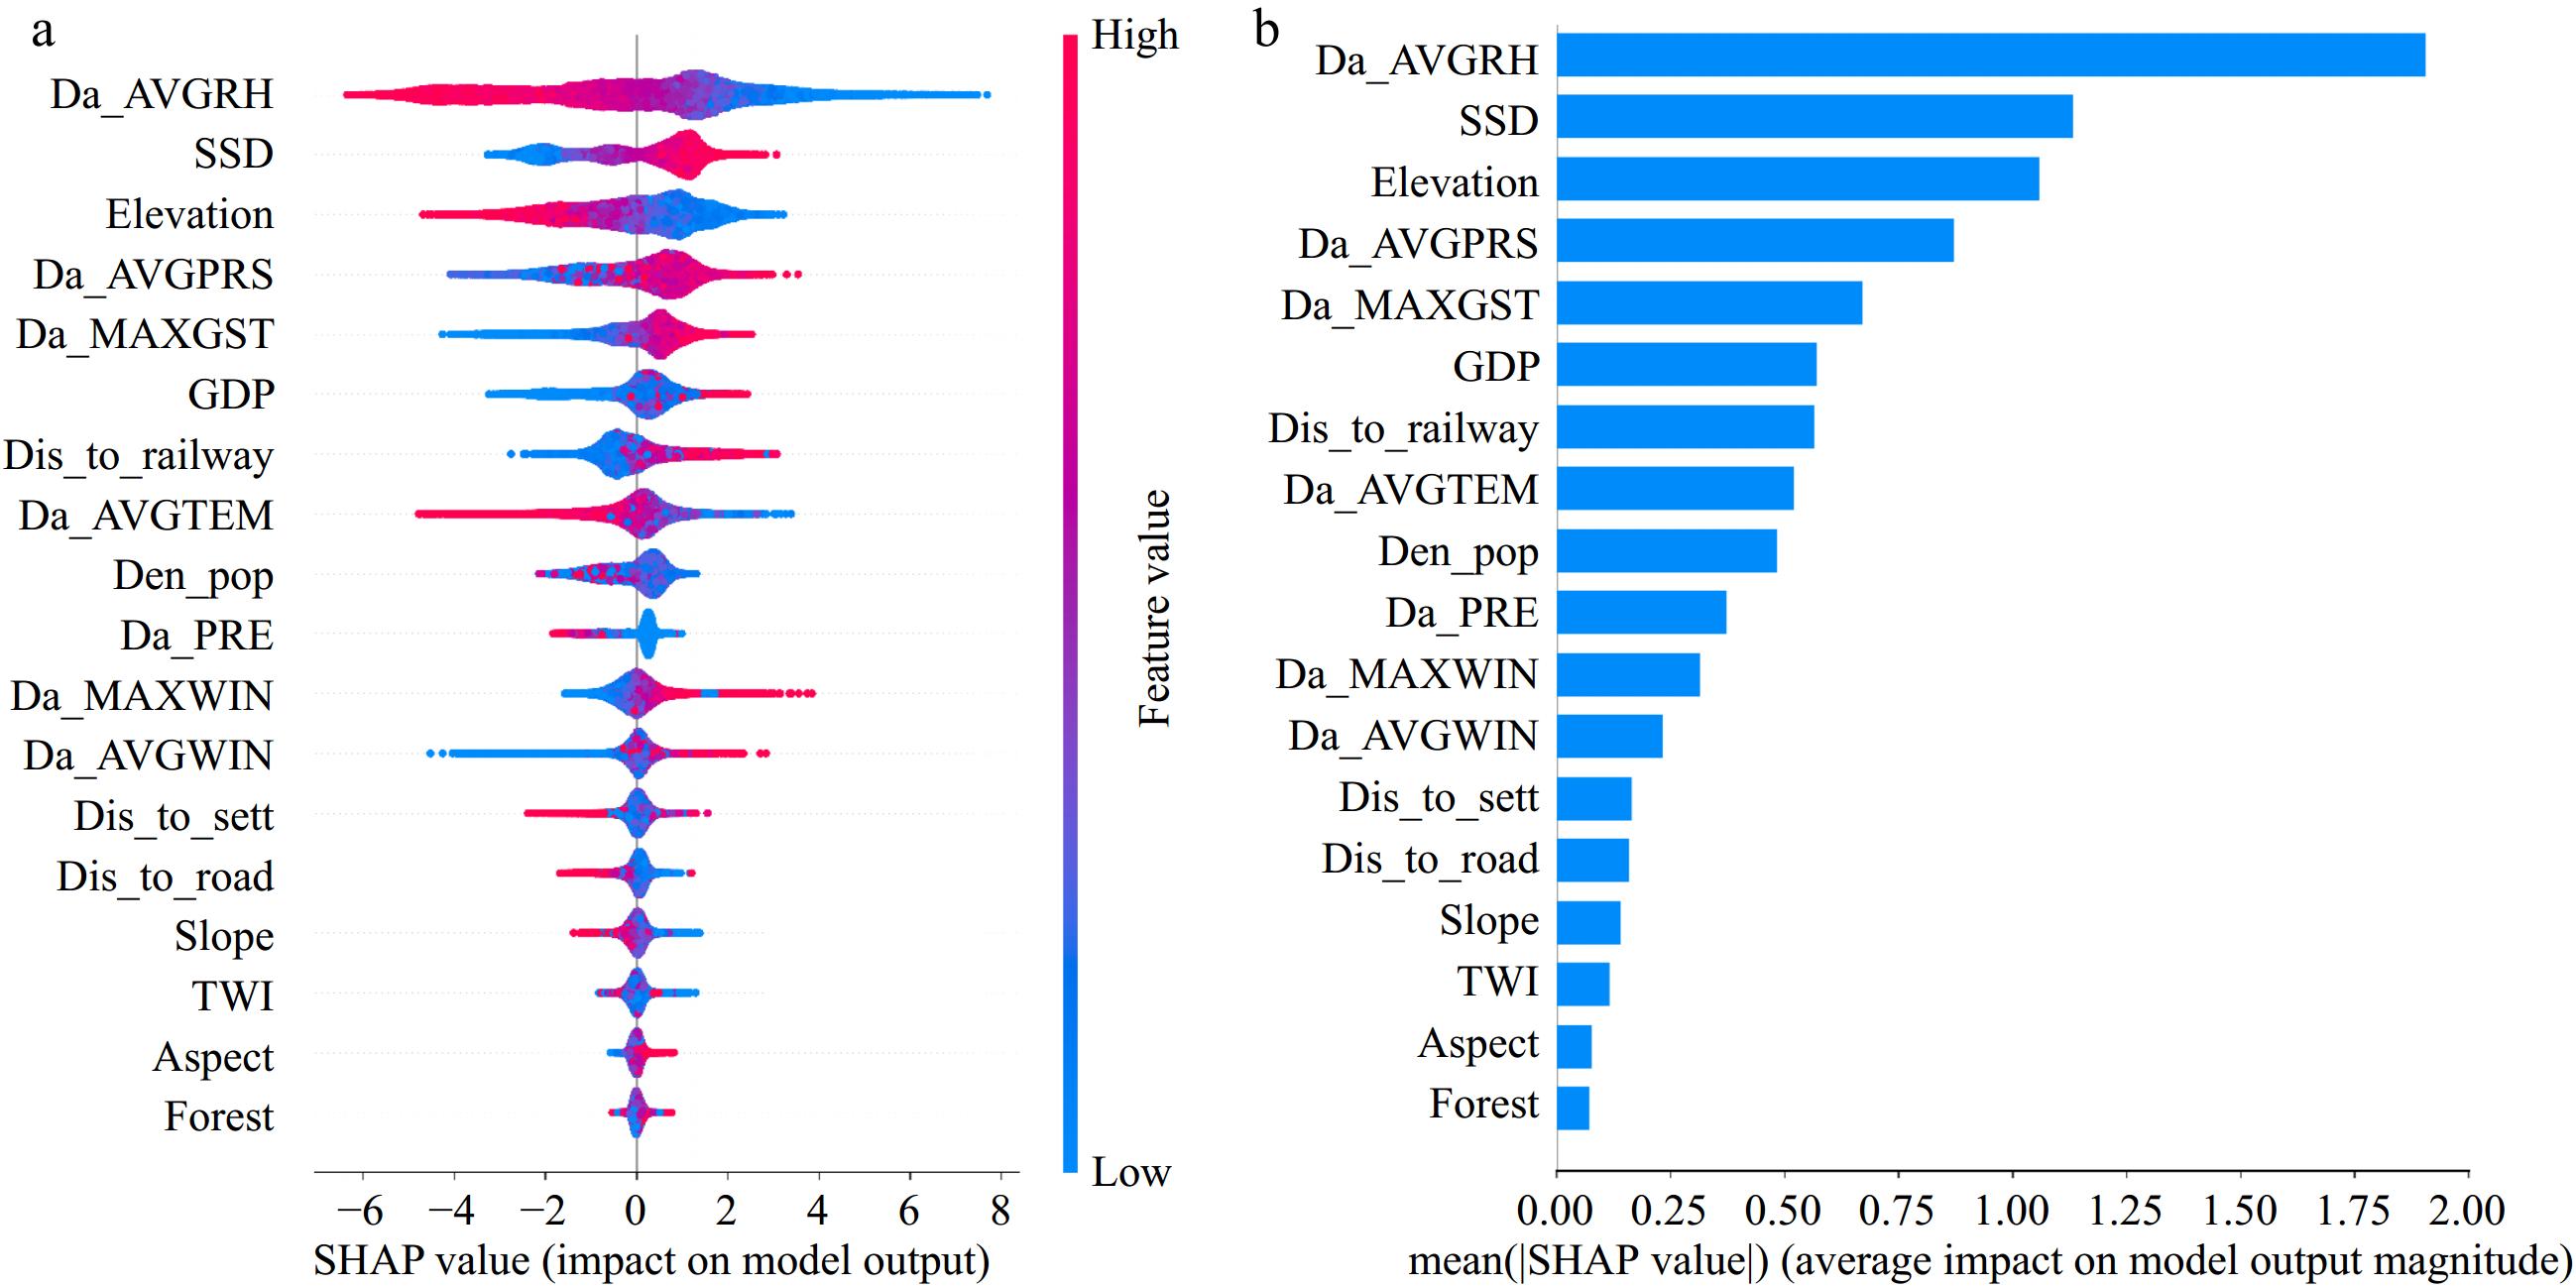
Figure 10.
Summary graphs of global factors: (a) SHAP scatter plot, (b) SHAP bar graph.
-
No. Factor VIF value before
eliminating factorVIF value after
eliminating factor1 Da_AVGTEM 142.109 3.859 2 Da_MINTEM 51.681 − 3 Da_MAXTEM 30.345 − 4 Da_PRE 1.245 1.242 5 Da_AVGRH 3.440 2.220 6 Da_AVGWIN 2.609 2.420 7 Da_MAXWIN 2.603 2.536 8 Da_AVGPRS 3.999 3.855 9 SSD 3.424 2.577 10 Da_AVGGST 40.164 − 11 Da_MAXGST 11.016 4.639 12 Elevation 3.902 3.876 13 Slope 1.000 1.304 14 Aspect 1.001 1.001 15 TWI 1.040 1.190 16 Dis_to_railway 1.450 1.400 17 Dis_to_road 1.382 1.390 18 Dis_to_sett 1.458 1.459 19 Den_pop 4.882 4.871 20 GDP 3.811 3.806 21 Forest 1.104 1.108 Table 1.
Results of the multicollinearity analysis.
-
Model
parametersTPE-
LightGBMTPE-
RFTPE-
SVMGP-
LightGBMGP-
RFGP-
SVMTP 5779 5727 5570 5705 5709 5505 TN 8695 8633 8254 8505 8511 8213 FP 917 979 1358 1105 1101 1399 FN 633 685 842 707 703 907 ACC (%) 90.3 89.6 86.3 88.7 88.7 85.6 Precision (%) 86.3 85.4 80.4 83.8 83.8 79.7 Recall (%) 90.1 89.3 86.8 88.9 89.0 85.9 F1 (%) 88.2 87.3 83.5 86.3 86.3 82.7 Table 2.
Performance metrics for model evaluation.
-
No. Forest fire occurrence probability Fire danger level Description of fire 1 0−0.2 I Virtually no fire 2 0.2−0.4 II Unlikely to occur 3 0.4−0.6 III Possible to occur 4 0.6−0.8 IV Prone to occur 5 0.8−1 V Highly likely to occur Table 3.
Criteria for the classification of forest fire danger levels.
Figures
(10)
Tables
(3)