-
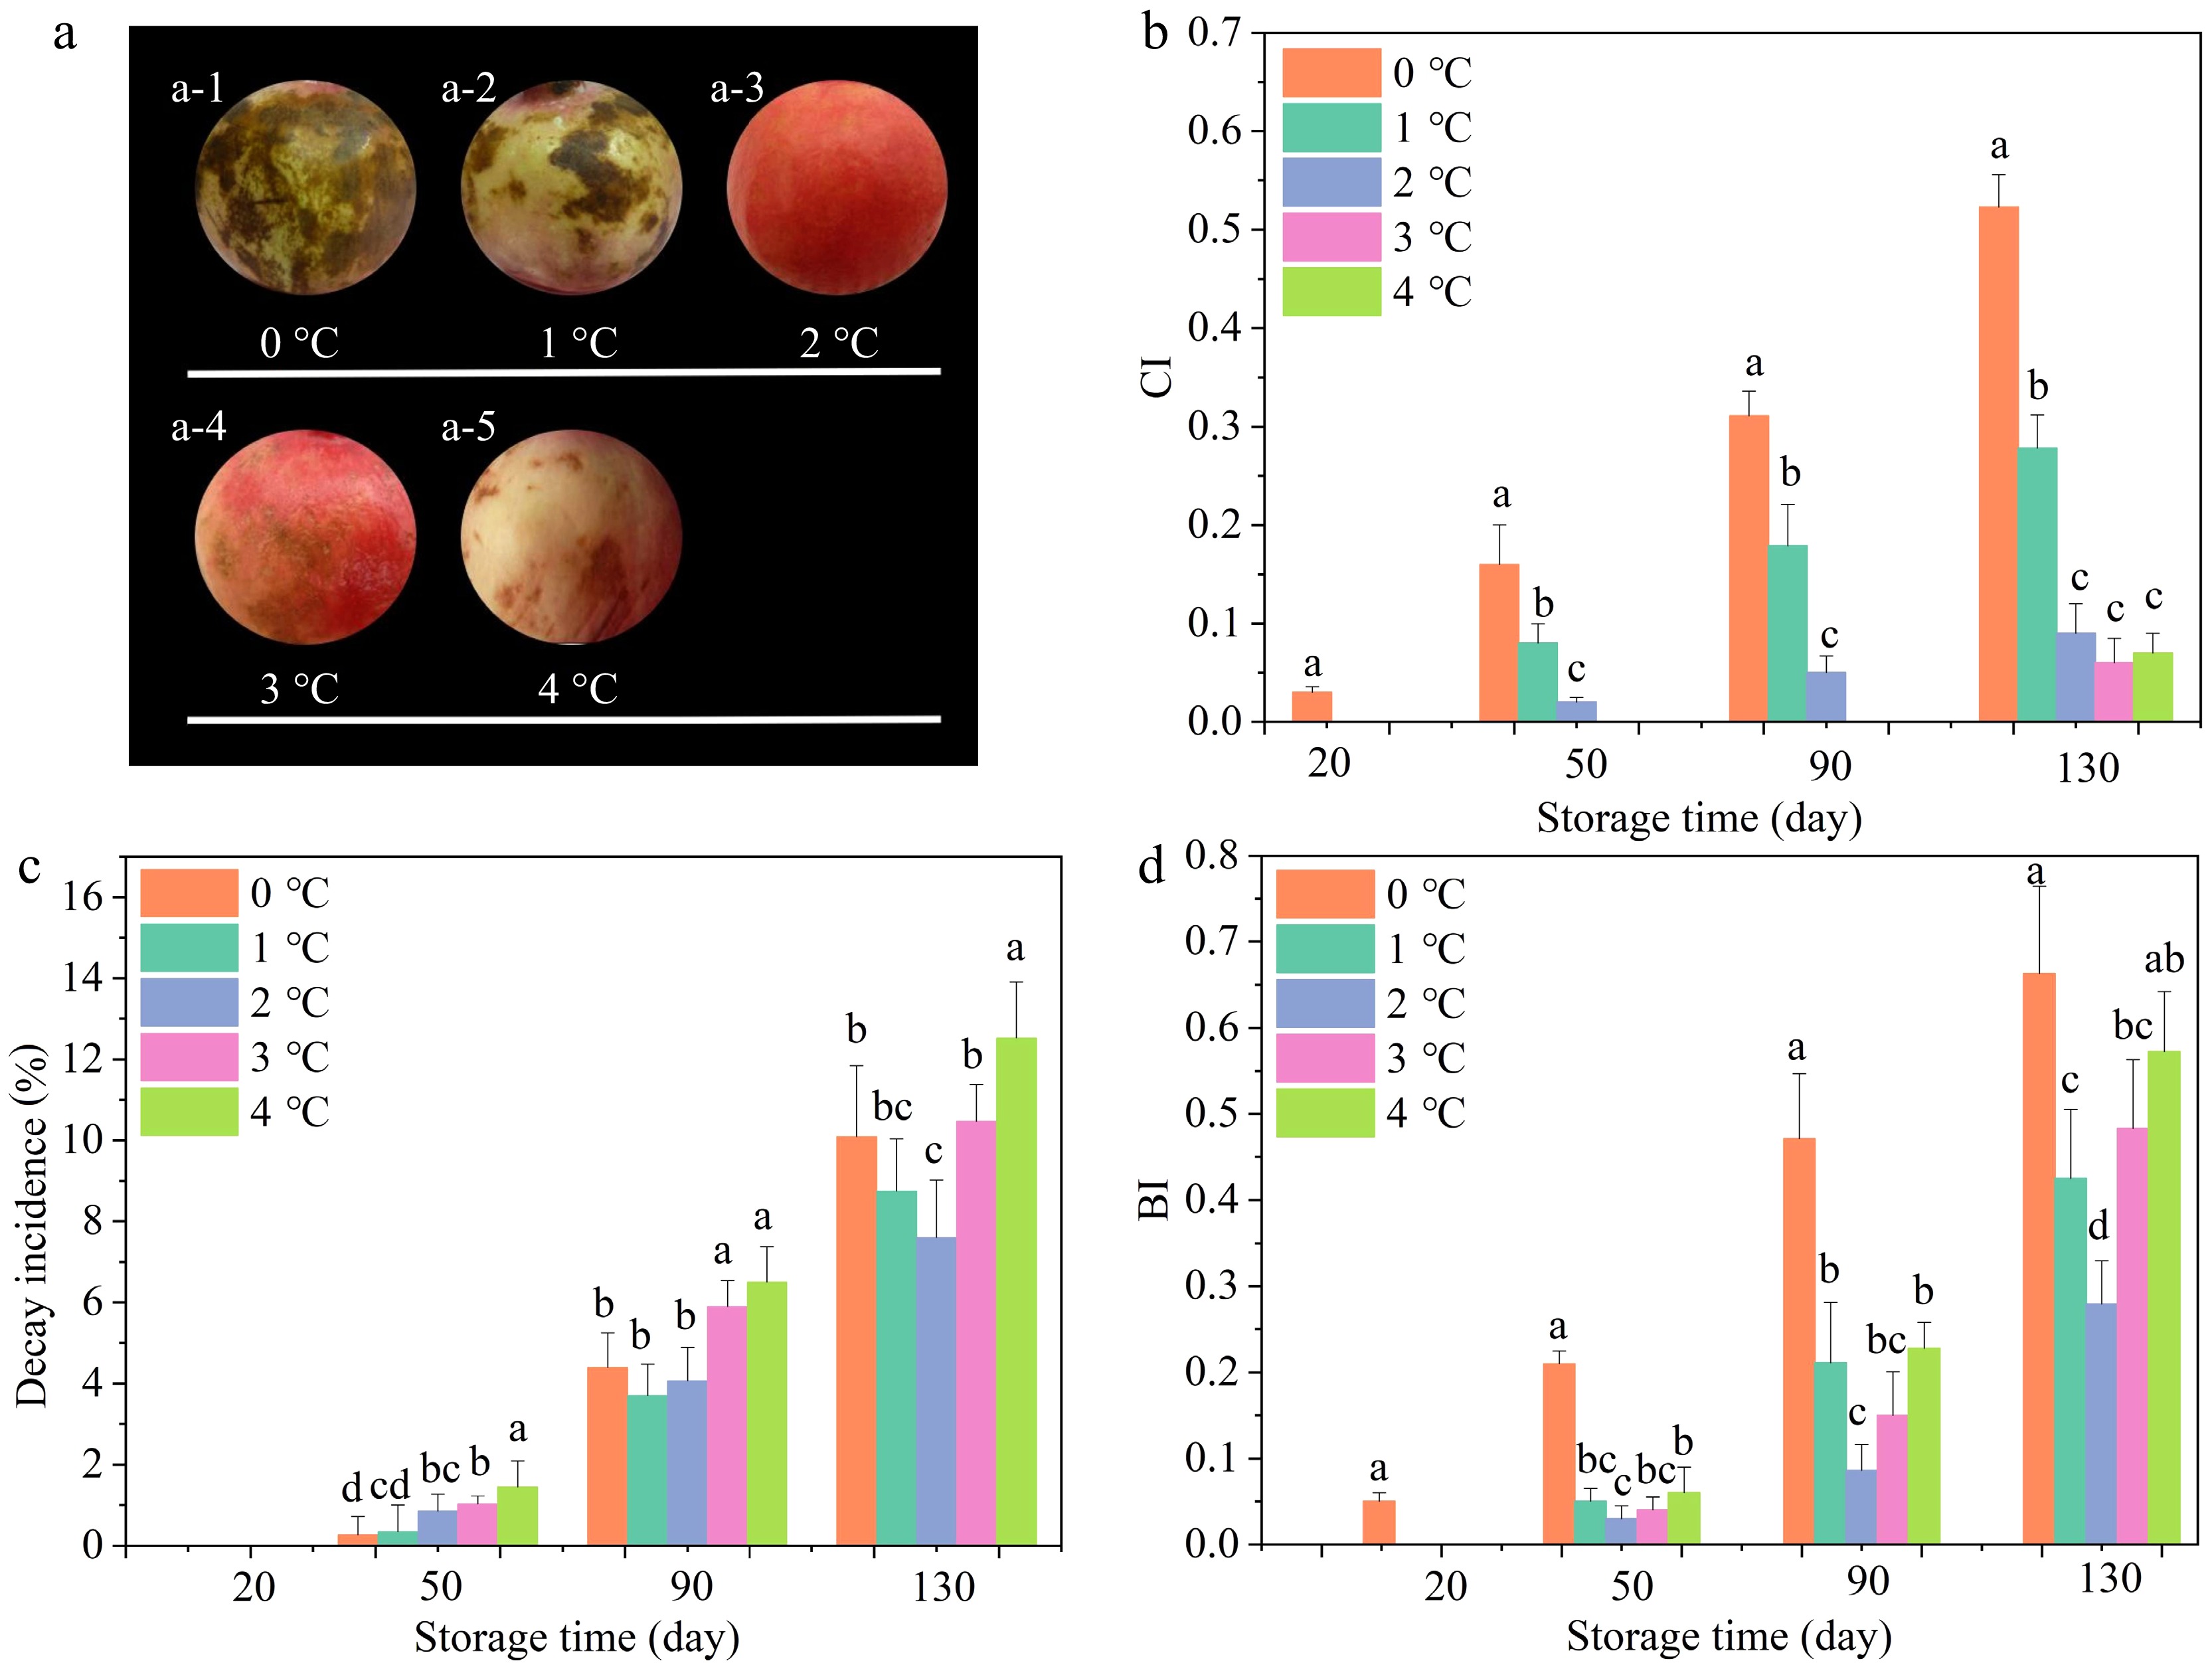
Figure 1.
Effects of storage temperatures on (a) appearance, (b) CI, (c) decay incidence, along with (d) BI. Values of the figures were exhibited as means ± standard error (n = 3). Vertical bars denoted the standard errors of the means. Disparate small letters denoted significant differences in the treatments for each sampling period at p ≤ 0.05.
-
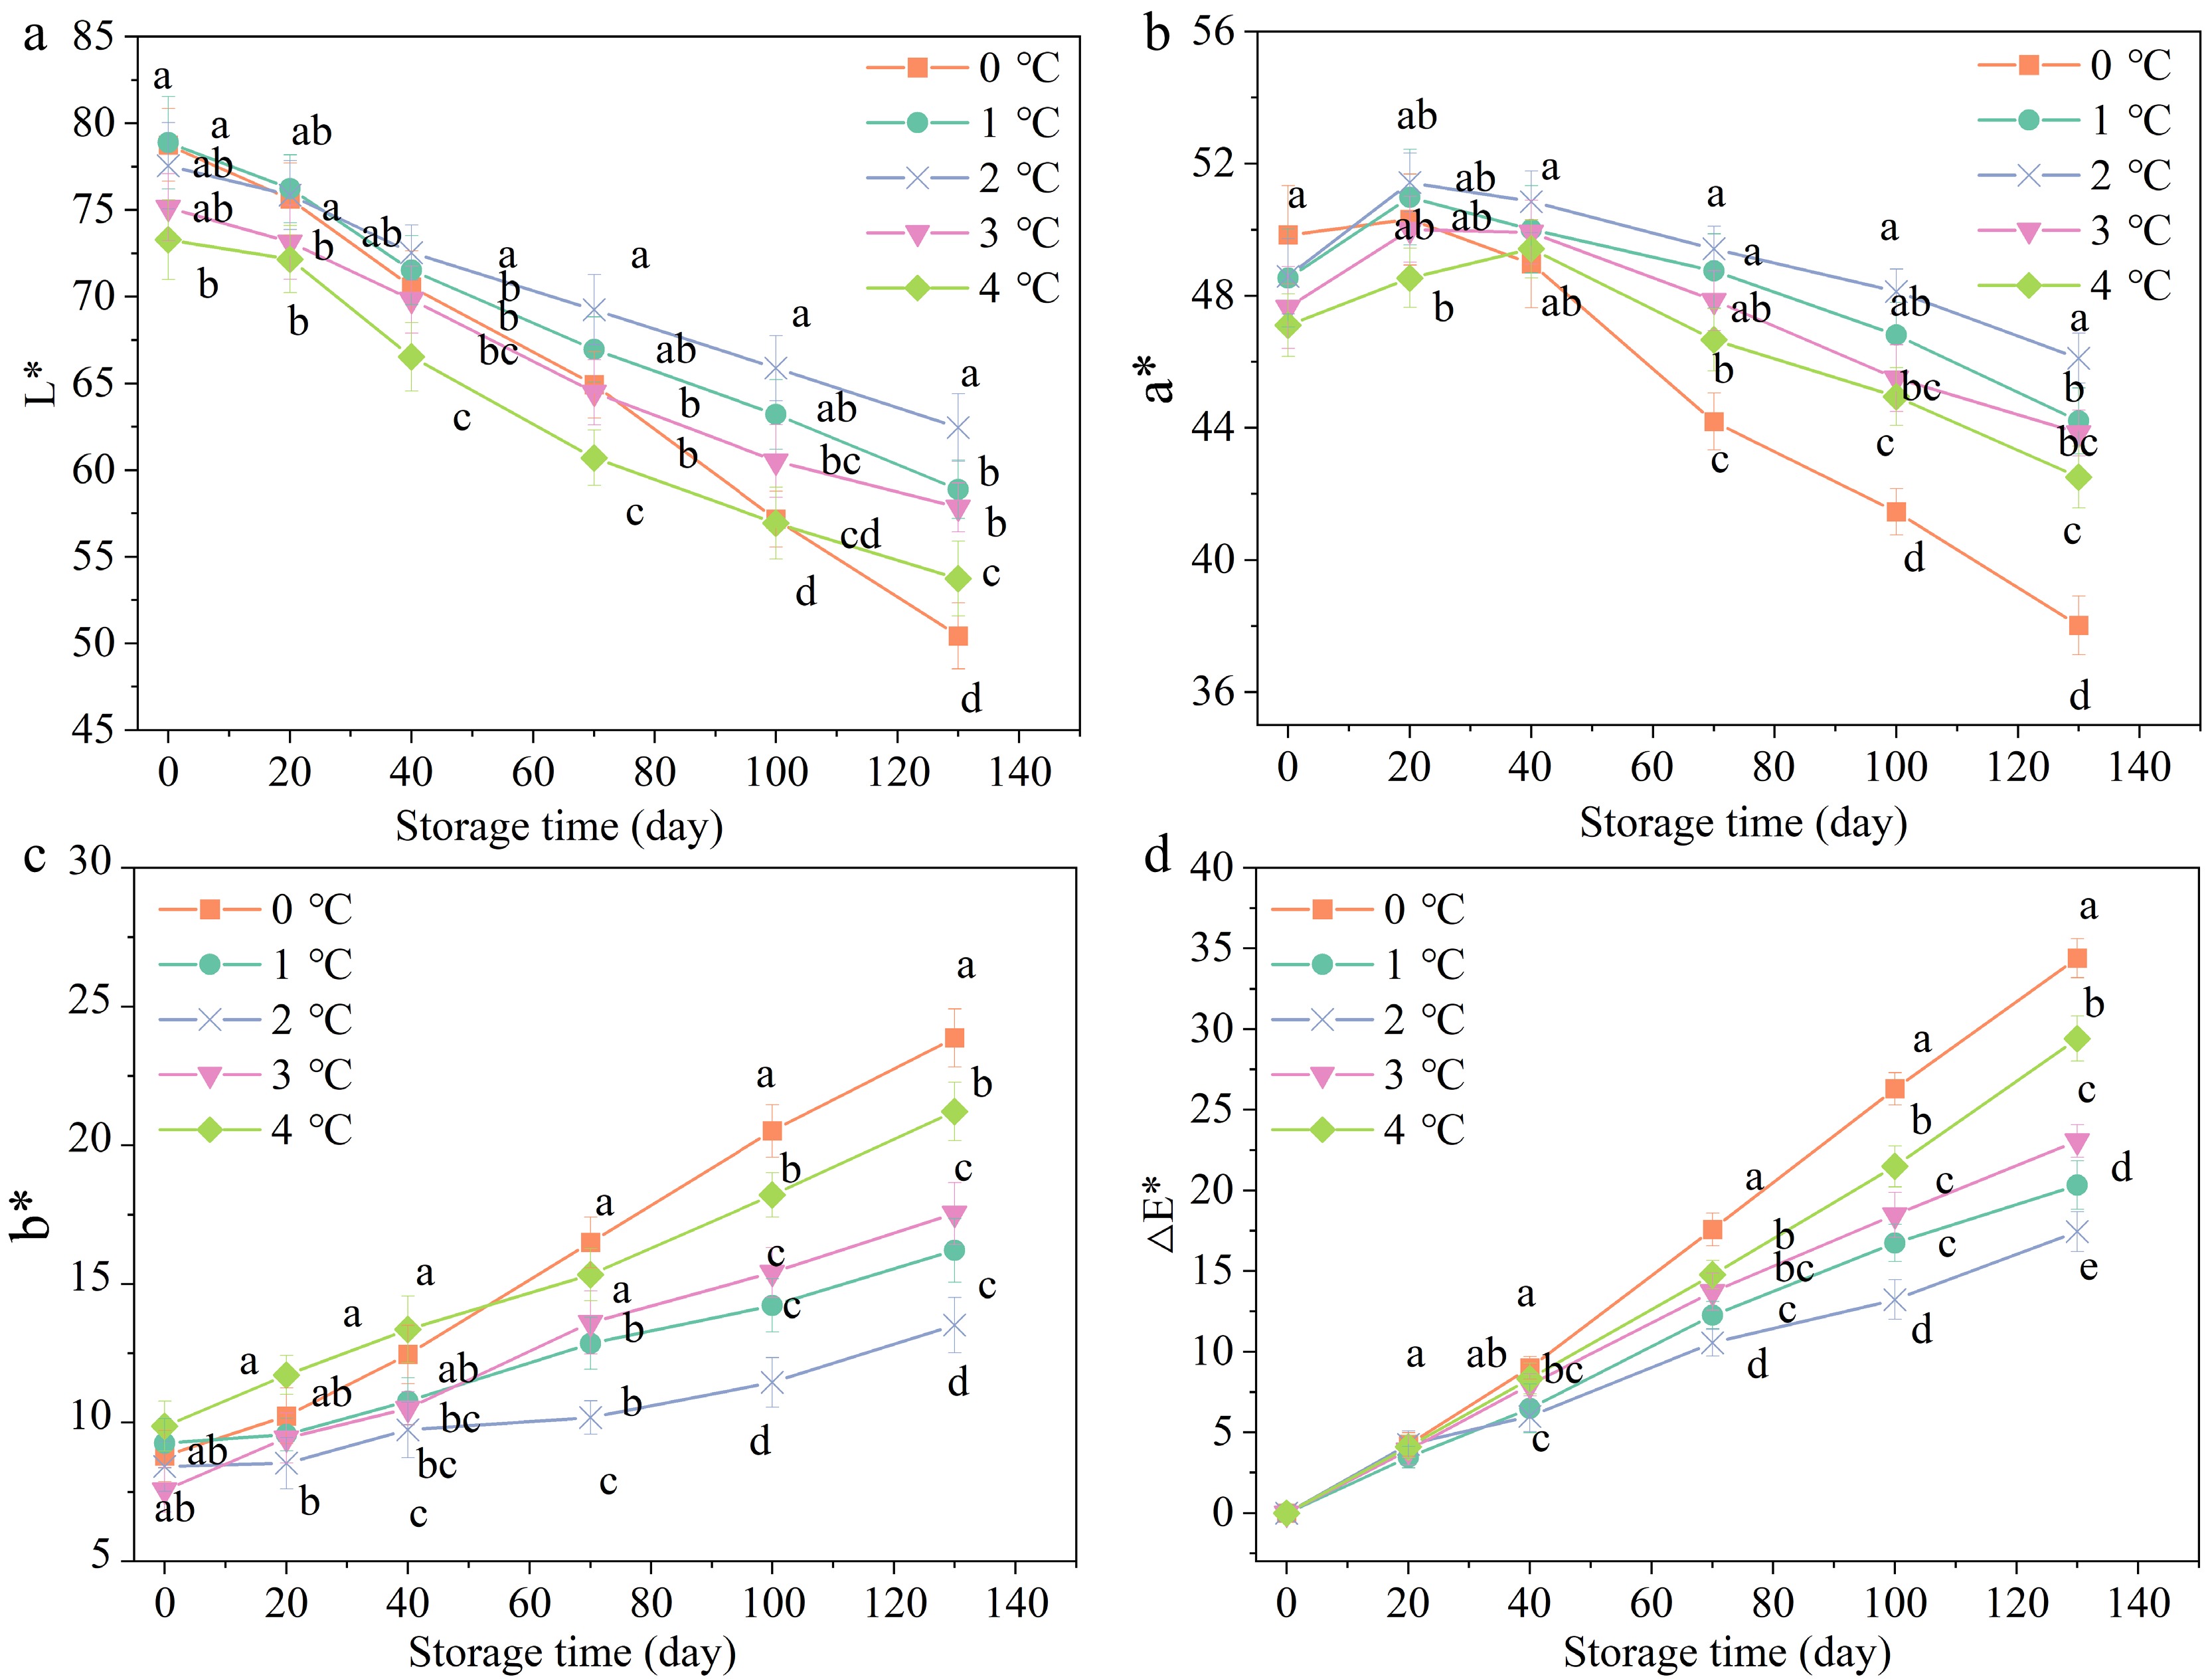
Figure 2.
Effects of storage temperatures on the (a) L* value, (b) a* value, (c) b* value, and (d) ∆E* value of pomegranates appearance. Values of the figures were displayed as means ± standard error (n = 3). Vertical bars denoted the standard errors of the means. Disparate letters denoted prominent differences in the treatments for each sampling period at p ≤ 0.05.
-
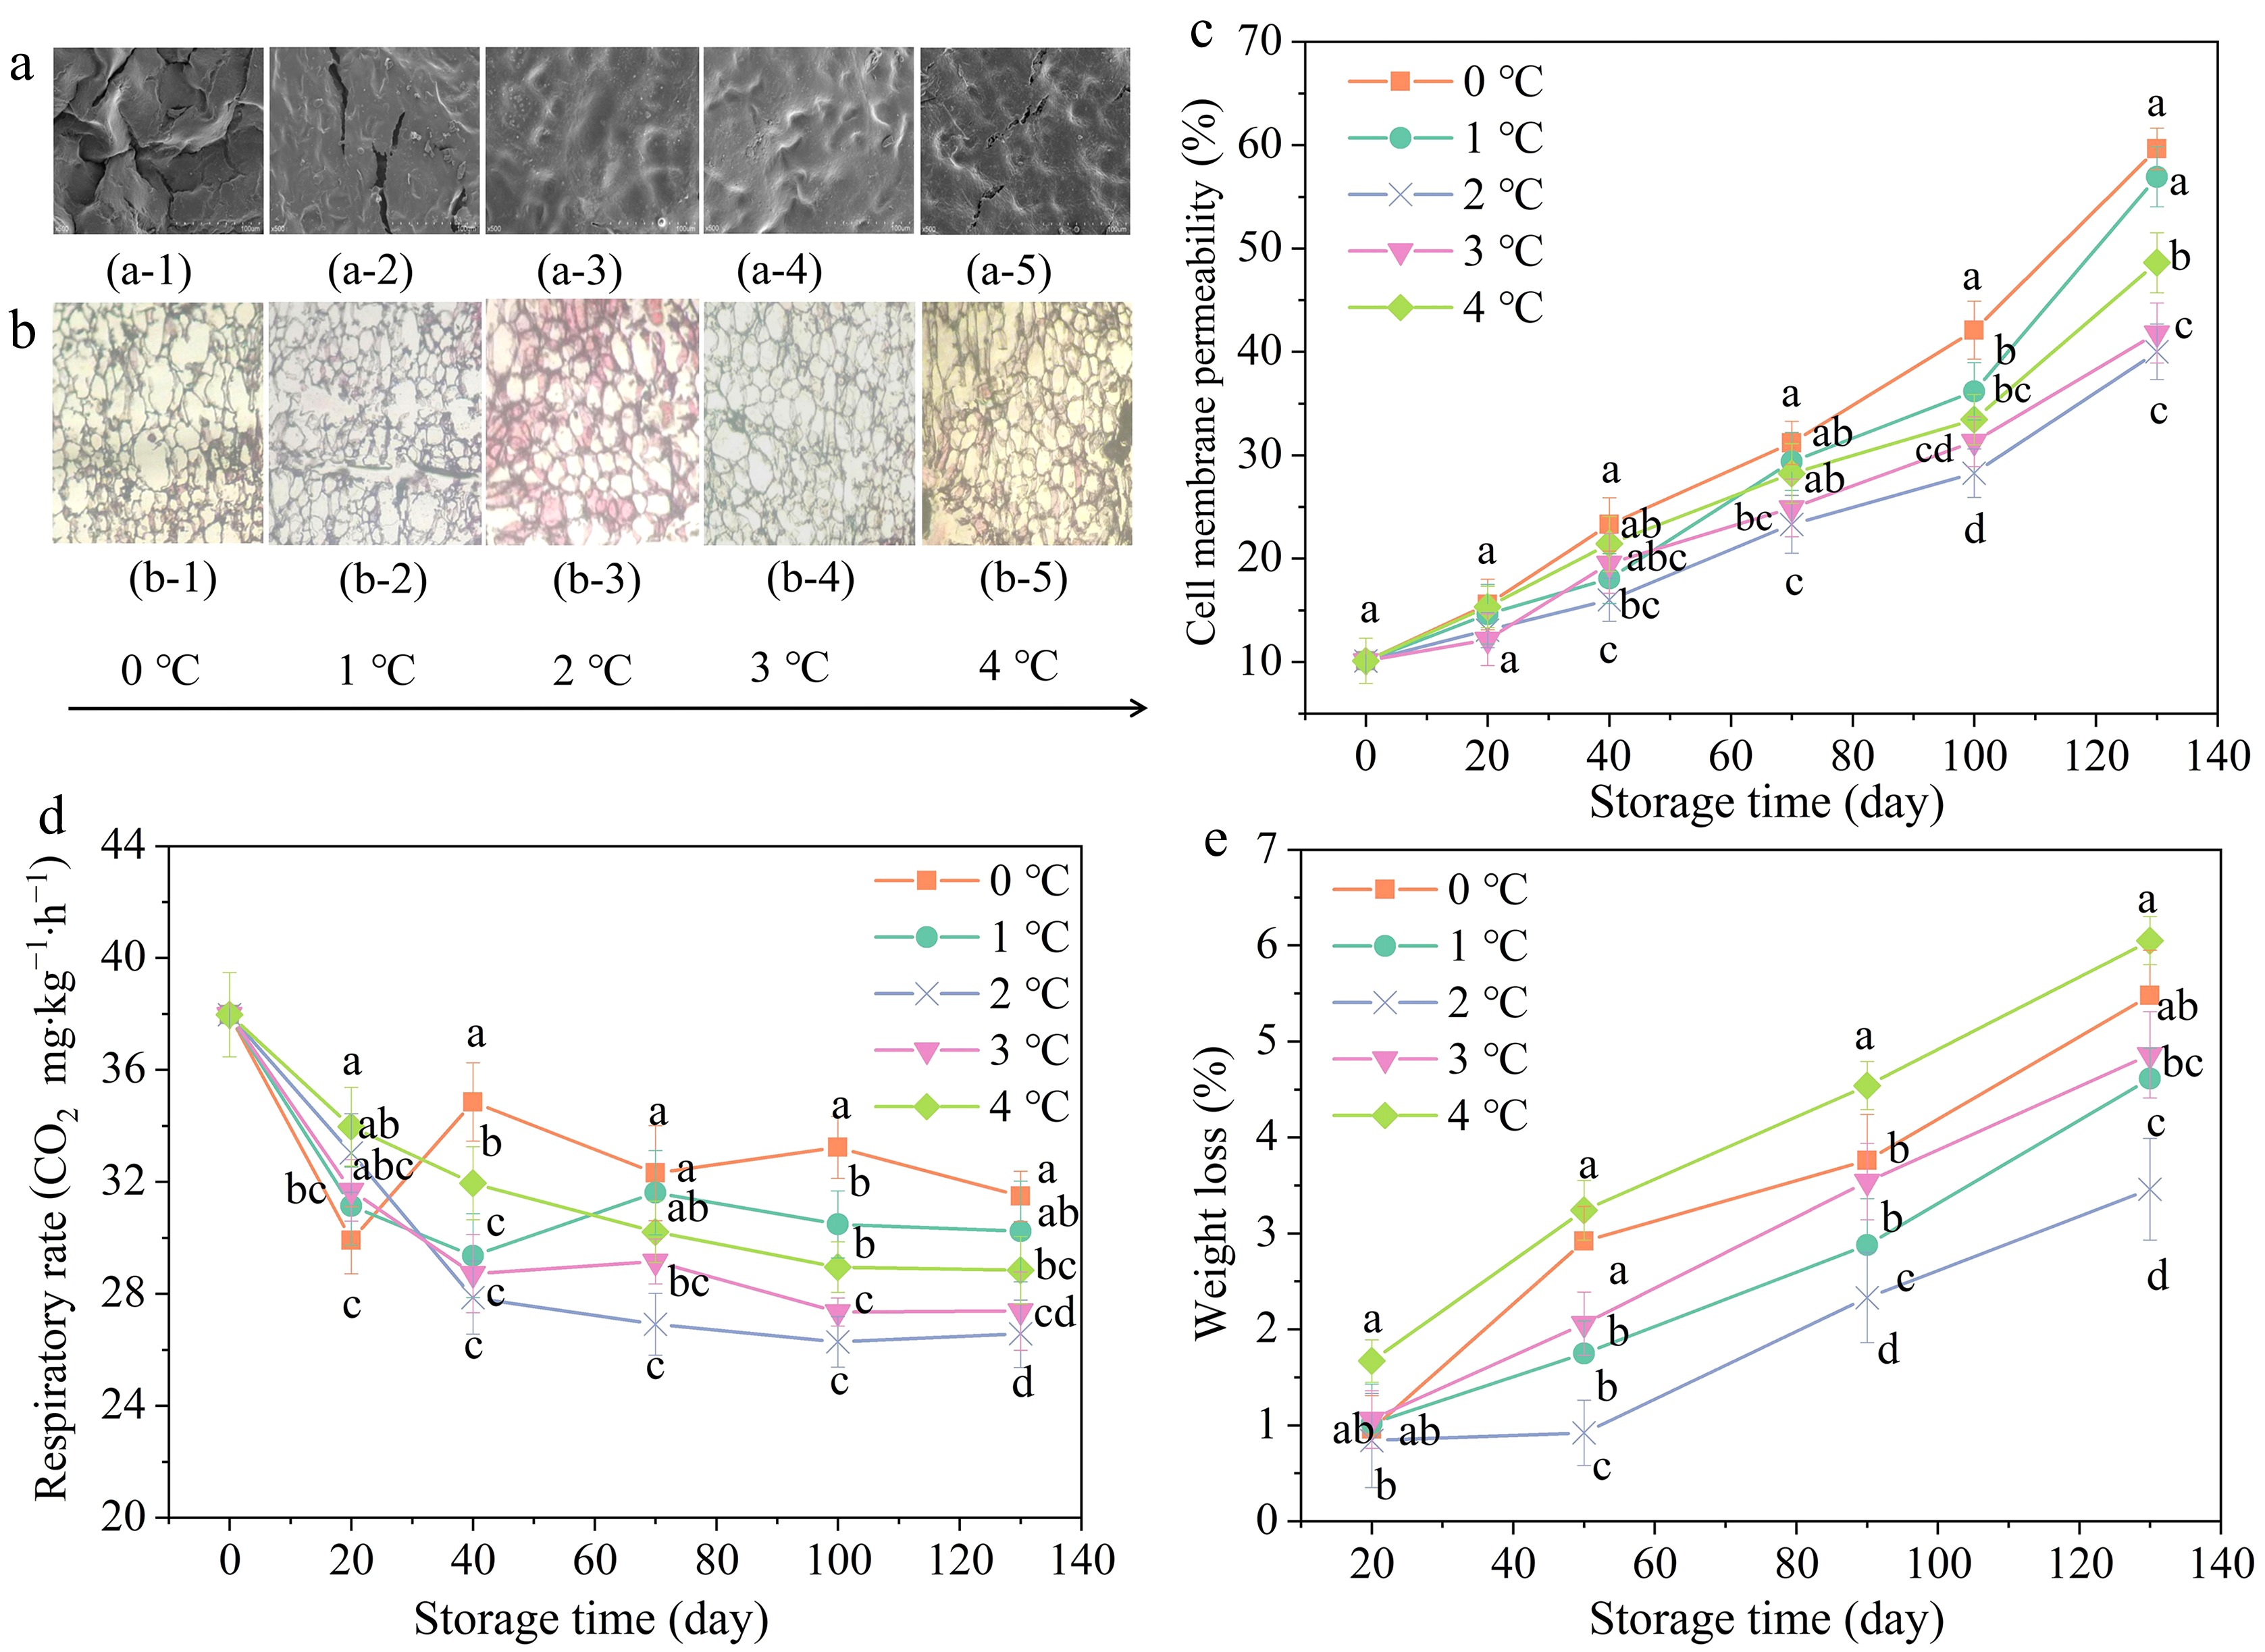
Figure 3.
Effects of storage temperatures on micro-structure ((a) SEM images, (b) paraffin section images), (c) cell membrane permeability, (d) respiratory rate, and (e) weight loss. Values in the figures were exhibited as means ± standard error (n = 3). Vertical bars stood for the standard errors of the means. Disparate letters denoted prominent differences in treatments for per sampling period at p ≤ 0.05.
-
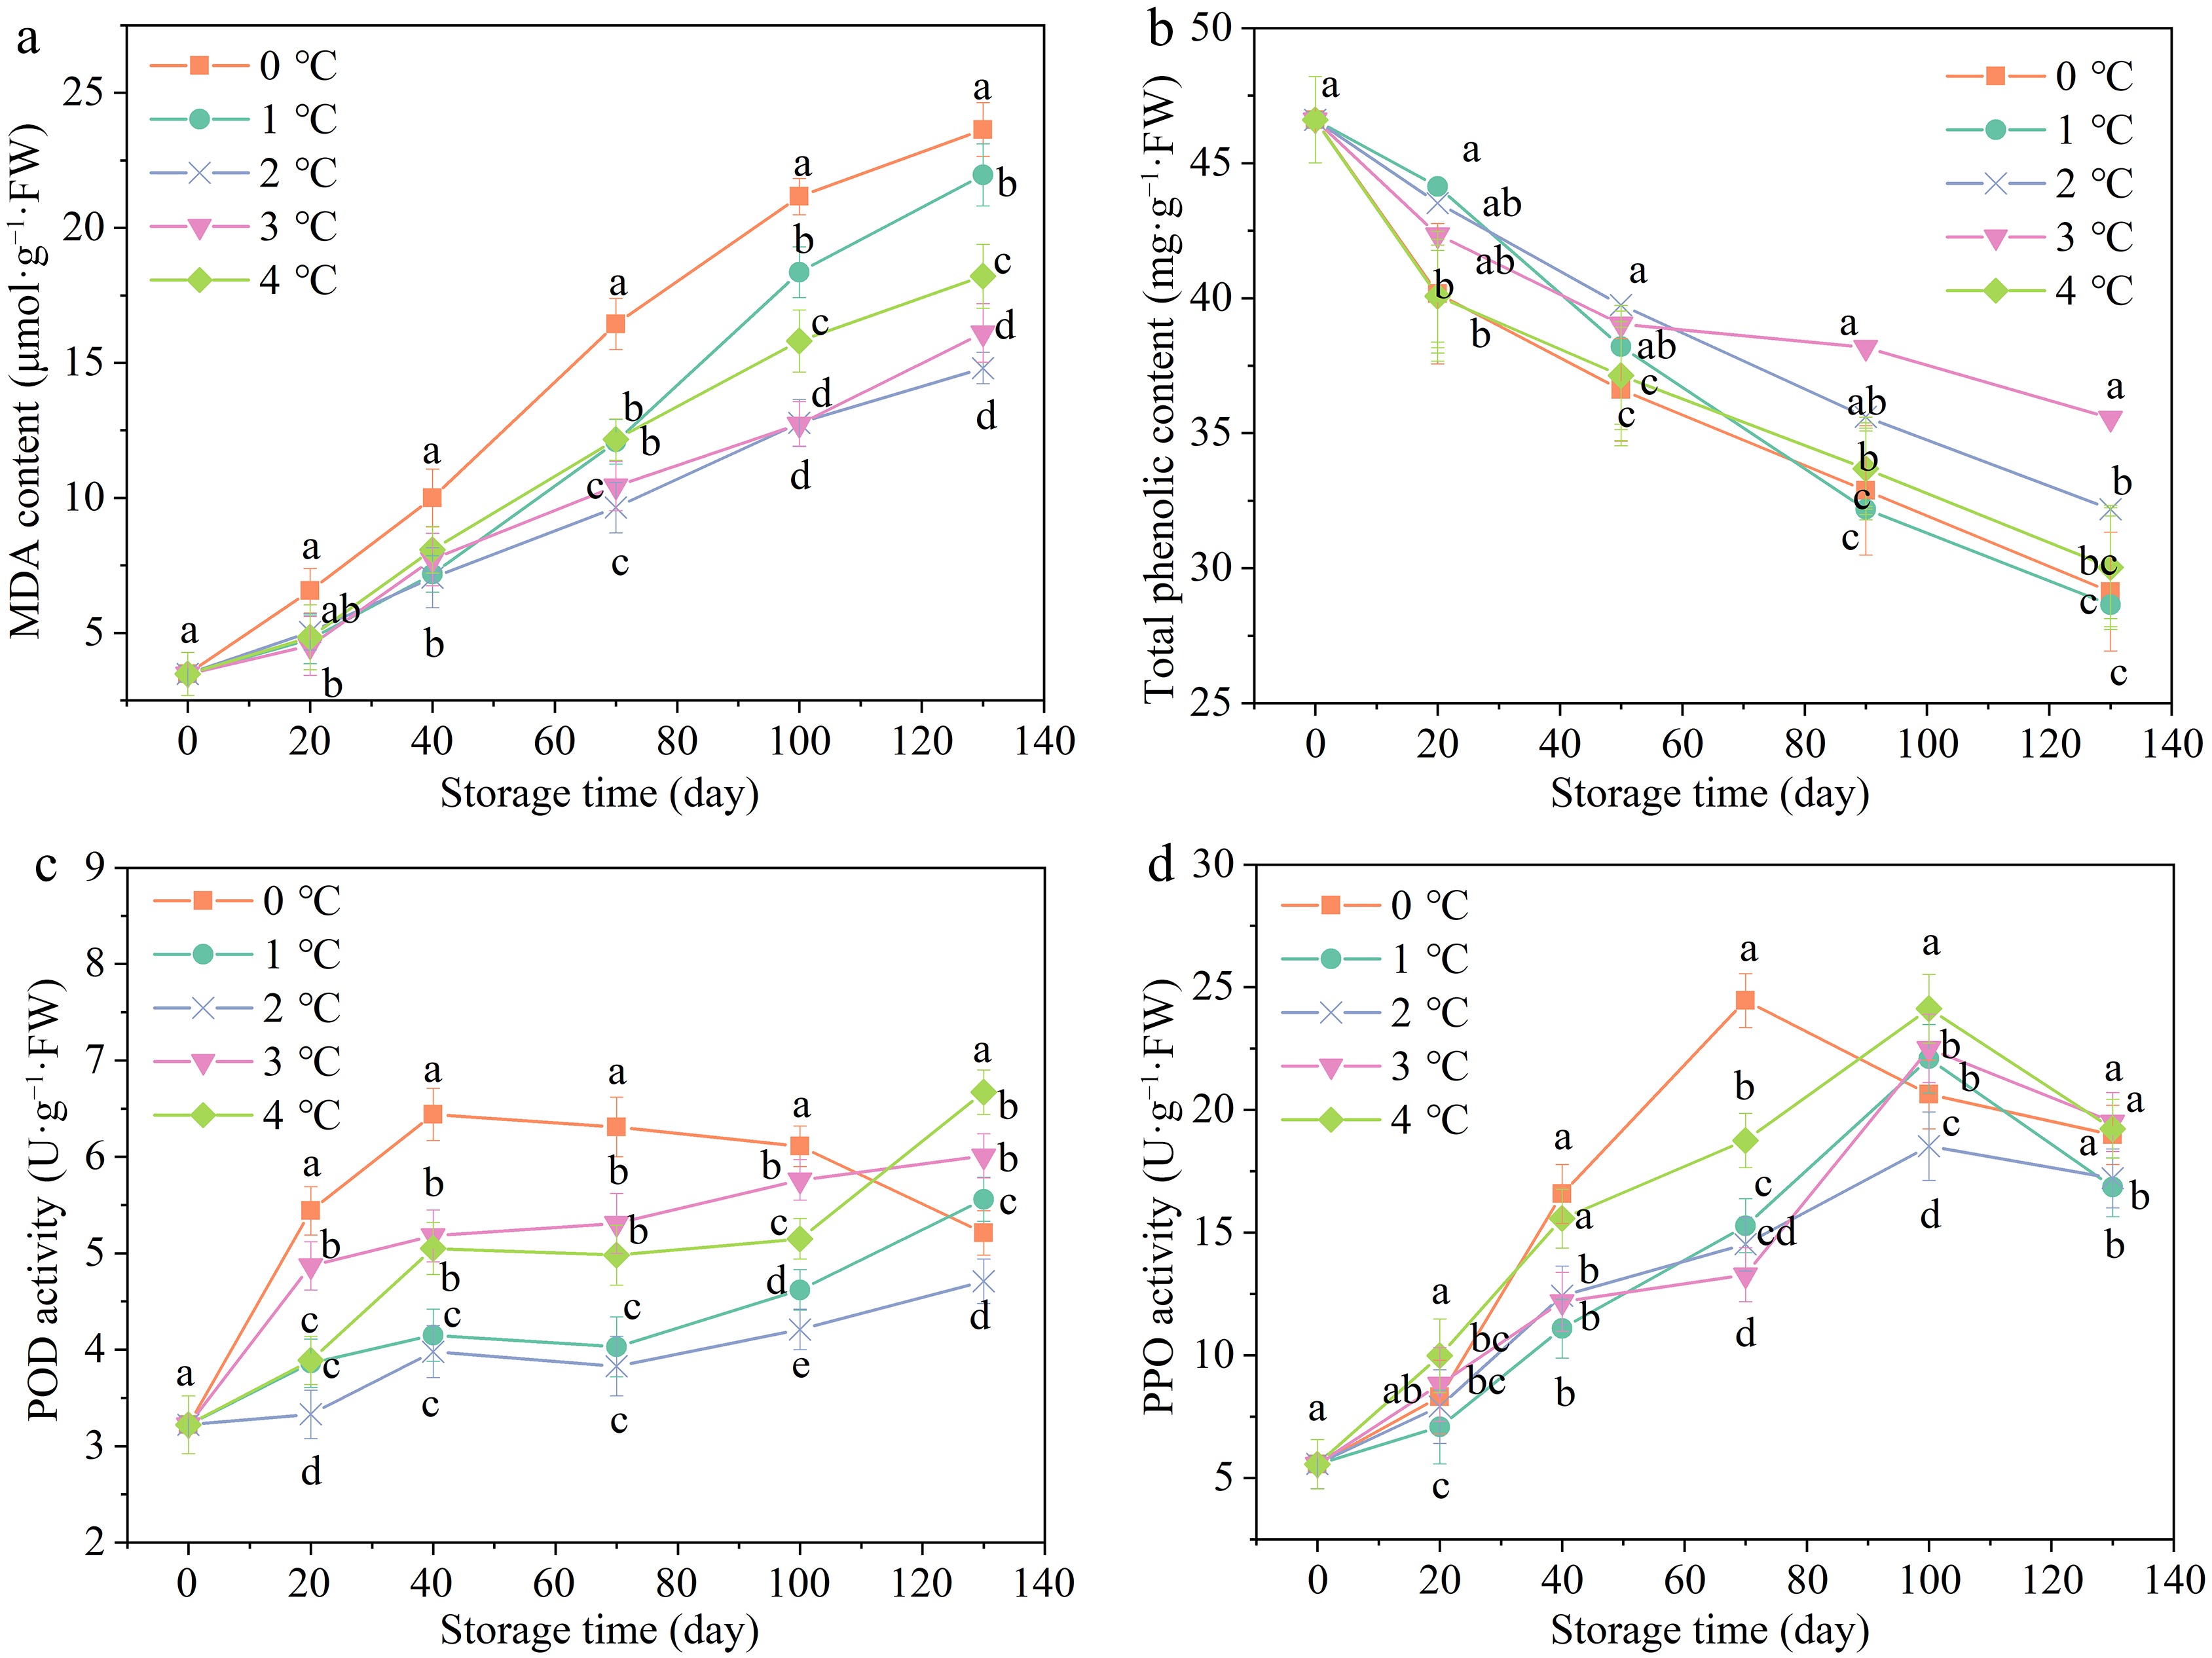
Figure 4.
Effects of storage temperatures on (a) MDA, (b) total phenolic content, (c) POD, and (d) PPO. Values of the figures were displayed as means ± standard error (n = 3). Vertical bars denoted the standard errors of the means. Disparate letters represented remarkable differences in the treatments for each sampling period at p ≤ 0.05.
-
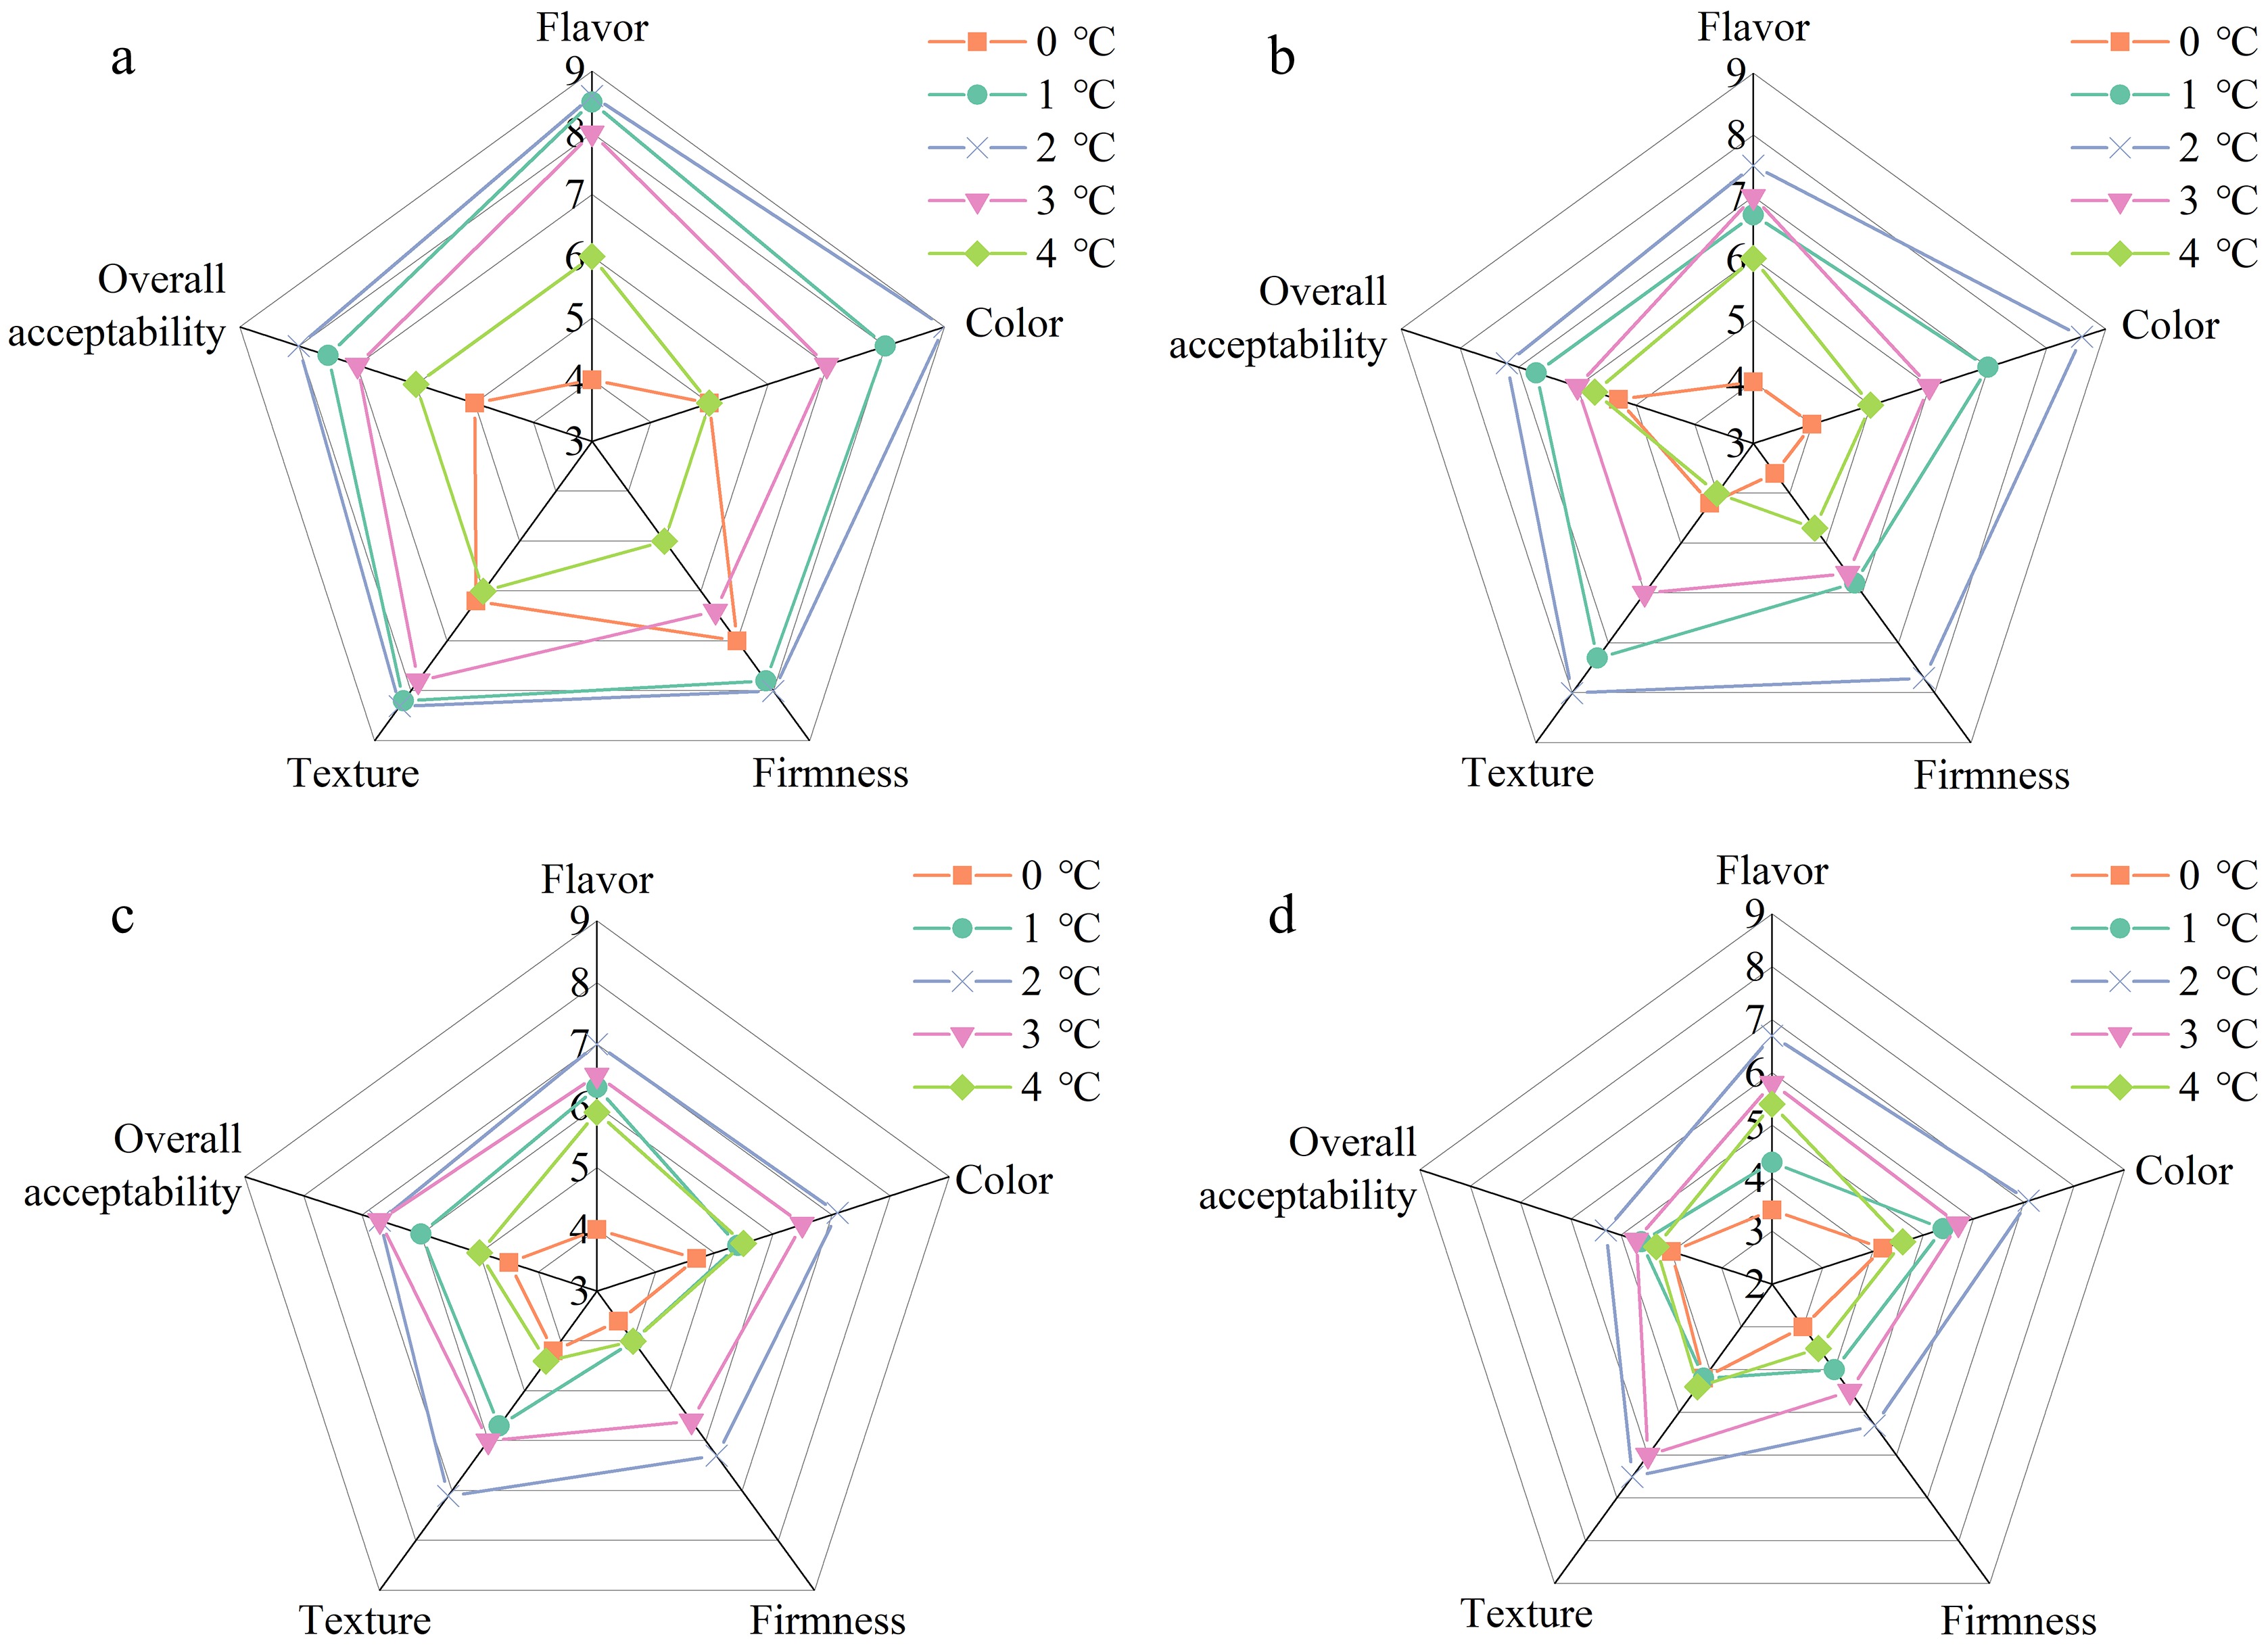
Figure 5.
Pomegranates were stored at low temperatures for 130 d and further stored at 25 °C for 10 d. The pomegranates sensory scores were performed on (a) day 1, (b) day 4, (c) day 7, and (d) day 10 when stored at 25 °C.
-
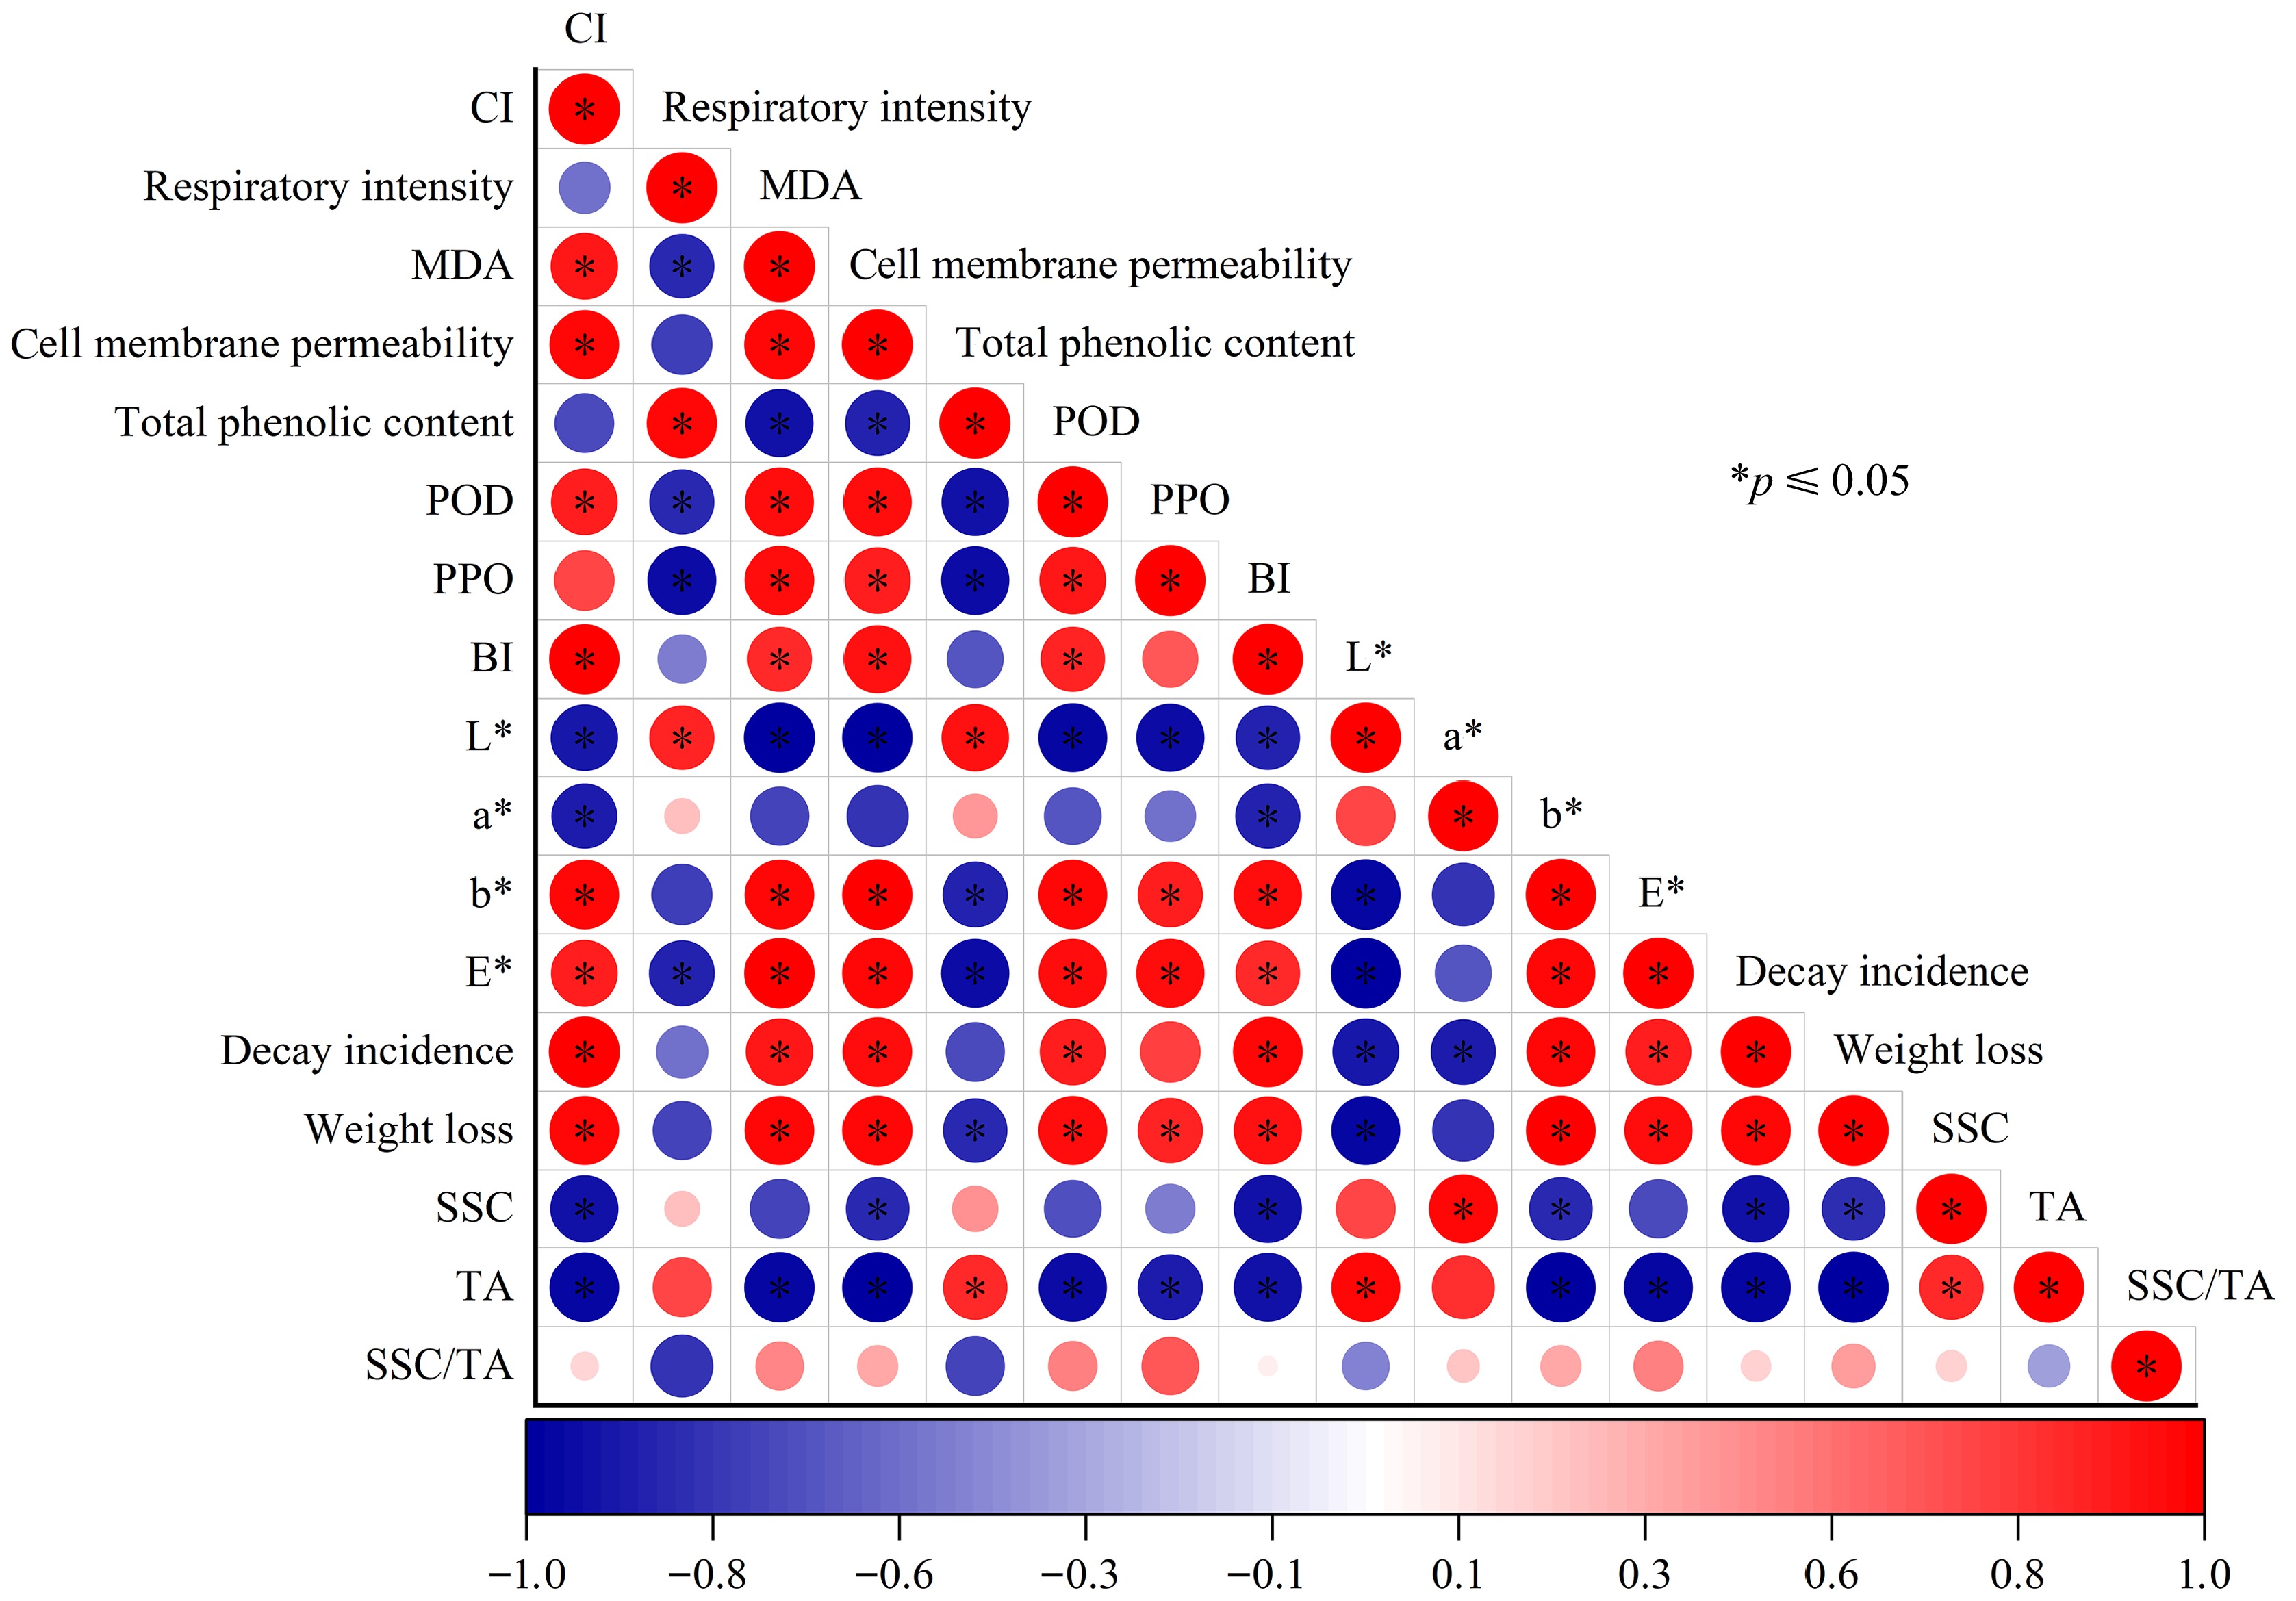
Figure 6.
Pearson's correlation coefficients on the quality attributes of pomegranates stored at 2 °C. The red dots stood for positive correlation; and the blue dots stood for negative correlation. The mark * on dots represented a significant correlation at the level of p ≤ 0.05.
-
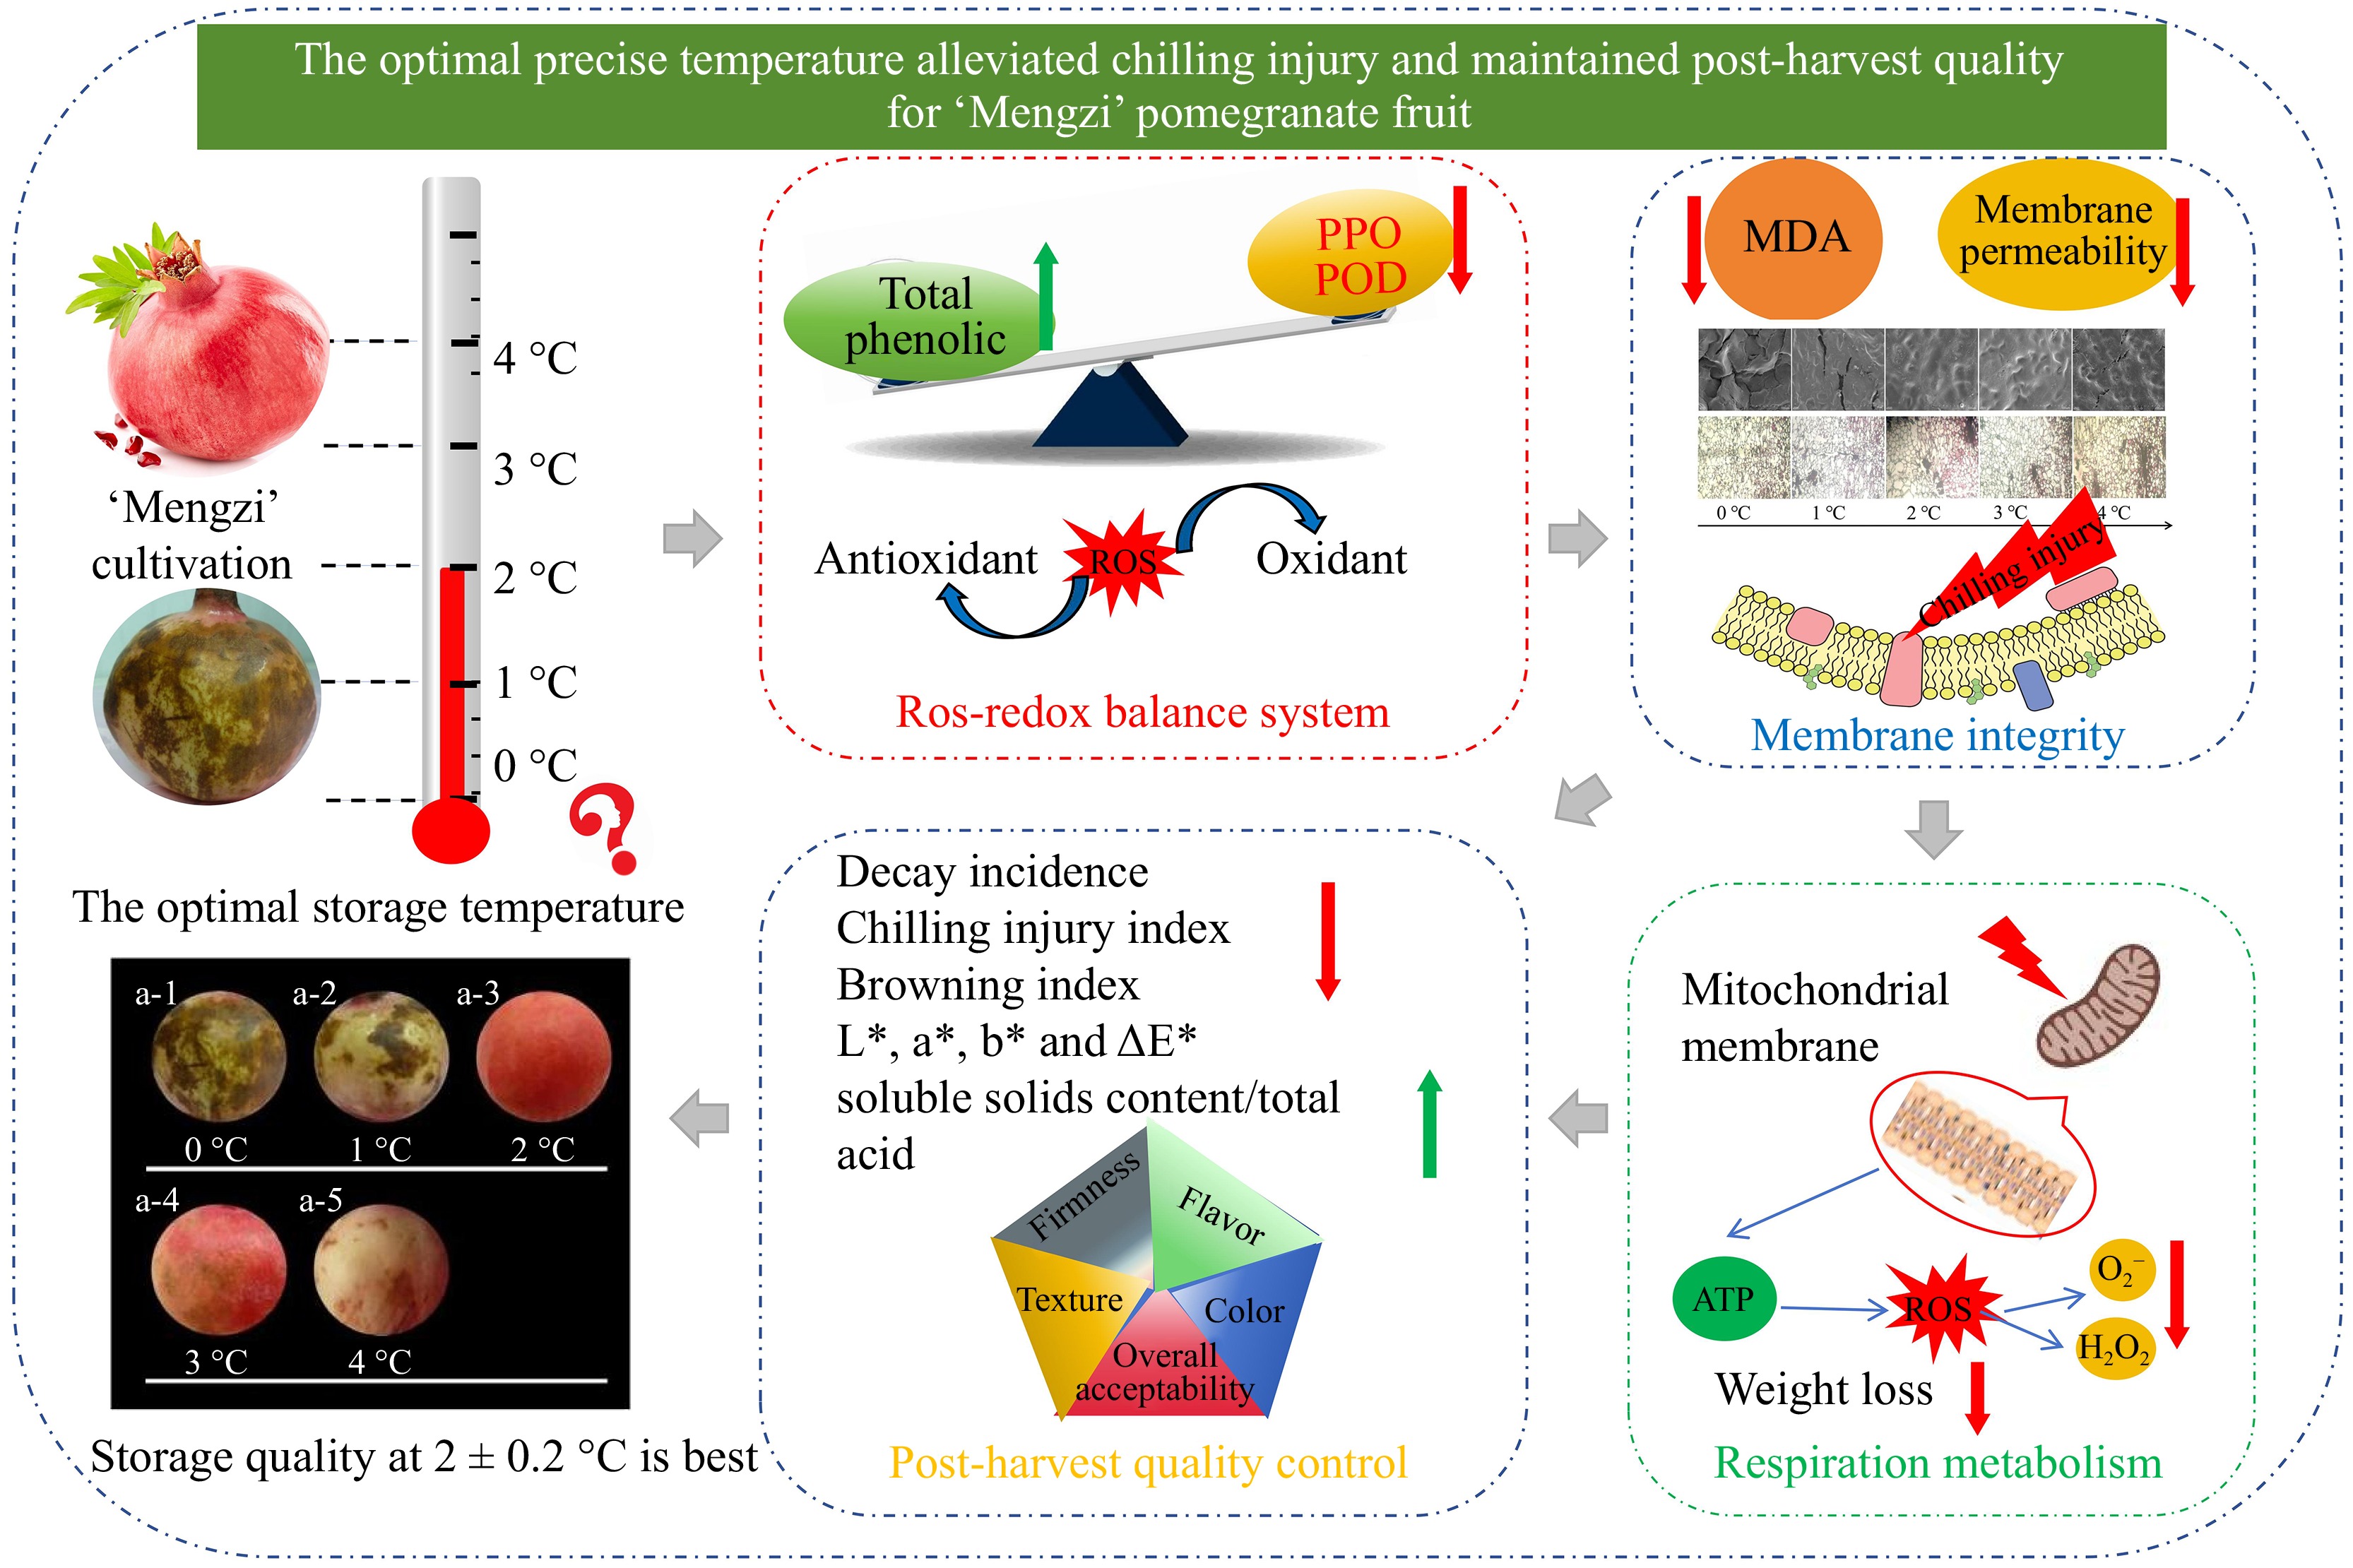
Figure 7.
The possible mechanism of precise storage temperature (2 °C) alleviated CI occurrence in 'Mengzi' pomegranate fruit through moderating the antioxidant-oxidant balance and respiration metabolism, which contributed to maintaining membrane integrity and pomegranate quality.
-
Parameter Time (d) Storage temperature 0 °C 1 °C 2 °C 3 °C 4 °C SSC content (%) 0 16.80 ± 0.32 20 17.31 ± 0.48a 17.43 ± 0.40a 17.97 ± 0.40a 17.65 ± 0.47a 17.01 ± 0.54a 40 17.54 ± 0.70ab 17.74 ± 0.27ab 18.32 ± 0.31b 17.89 ± 0.44ab 17.34 ± 0.31a 70 16.01 ± 0.30c 16.31 ± 0.50bc 17.21 ± 0.49a 17.11 ± 0.40ab 15.67 ± 0.56c 100 14.89 ± 0.40c 15.26 ± 0.40bc 16.46 ± 0.50a 15.66 ± 0.30b 13.57 ± 0.40d 130 12.50 ± 0.36c 12.75 ± 0.26c 14.34 ± 0.29a 13.40 ± 0.33b 11.83 ± 0.41d TA content (%) 0 2.01 ± 0.23 20 1.66 ± 0.05b 1.75 ± 0.12ab 1.97 ± 0.28a 1.85 ± 0.04ab 1.83 ± 0.04ab 40 1.54 ± 0.15b 1.64 ± 0.08b 1.93 ± 0.06a 1.71 ± 0.15b 1.67 ± 0.07b 70 1.43 ± 0.07c 1.55 ± 0.06bc 1.87 ± 0.09a 1.62 ± 0.11b 1.57 ± 0.09b 100 1.26 ± 0.07d 1.38 ± 0.06c 1.71 ± 0.04a 1.51 ± 0.08b 1.48 ± 0.05bc 130 1.16 ± 0.04c 1.24 ± 0.05c 1.57 ± 0.07a 1.45 ± 0.05ab 1.39 ± 0.04b SSC/TA ratio (%) 0 8.46 ± 1.32 20 10.44 ± 0.60a 10.02 ± 0.89a 9.28 ± 1.52a 9.55 ± 0.46a 9.30 ± 0.50a 40 11.43 ± 0.66a 10.86 ± 0.67ab 9.49 ± 0.14ab 10.55 ± 1.16ab 10.39 ± 0.25b 70 11.23 ± 0.30a 10.55 ± 0.16ab 9.19 ± 0.16c 10.60 ± 0.44ab 9.99 ± 0.90bc 100 11.85 ± 0.98a 11.06 ± 0.19ab 9.61 ± 0.10cd 10.37 ± 0.71bc 9.17 ± 0.04d 130 10.81 ± 0.05a 10.32 ± 0.53a 9.13 ± 0.54b 9.25 ± 0.11b 8.54 ± 0.51b The results denoted mean ± standard deviations, n = 3. Different letters denoted prominent differences in the treatments for each sampling period at p ≤ 0.05. Table 1.
Effects of storage temperatures on soluble solids content (SSC), titratable acids (TA), and SSC/TA of pomegranates.
Figures
(7)
Tables
(1)