-
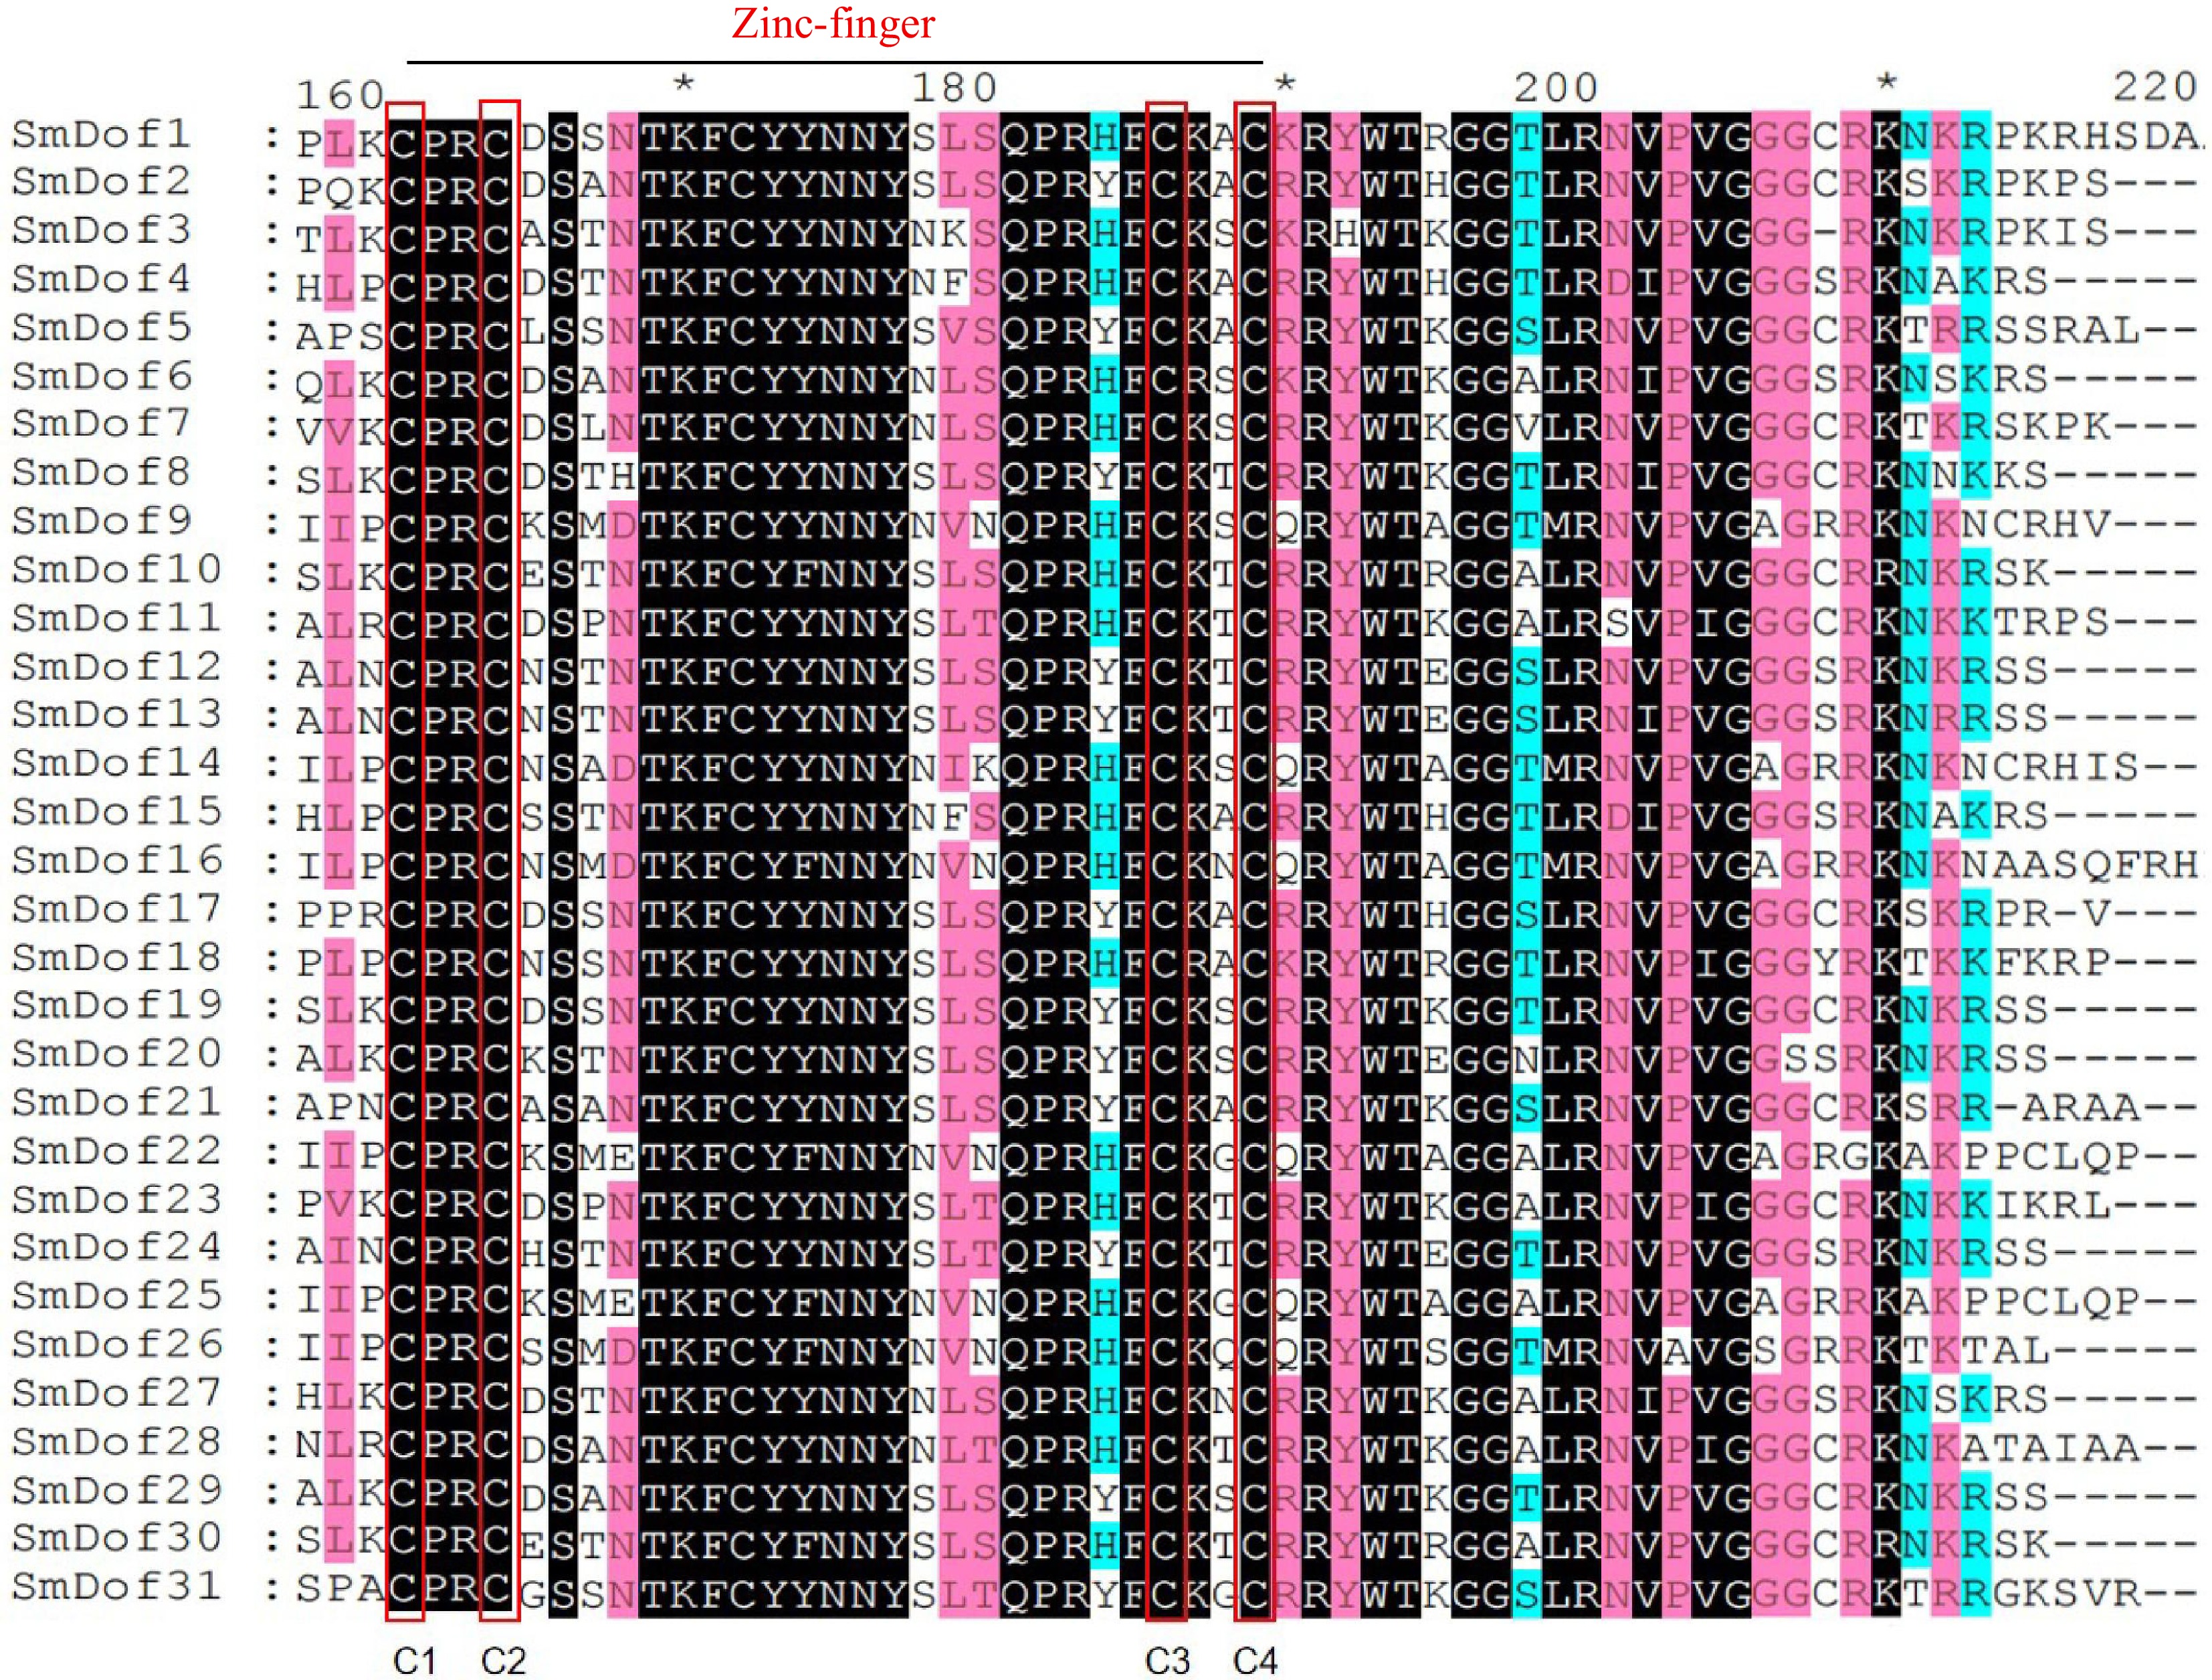
Figure 1.
Multiple sequence alignment of the 31 SmDof proteins. Different colors represent identical and conserved amino acid residues, and the red box shows the conserved zinc-finger domain.
-
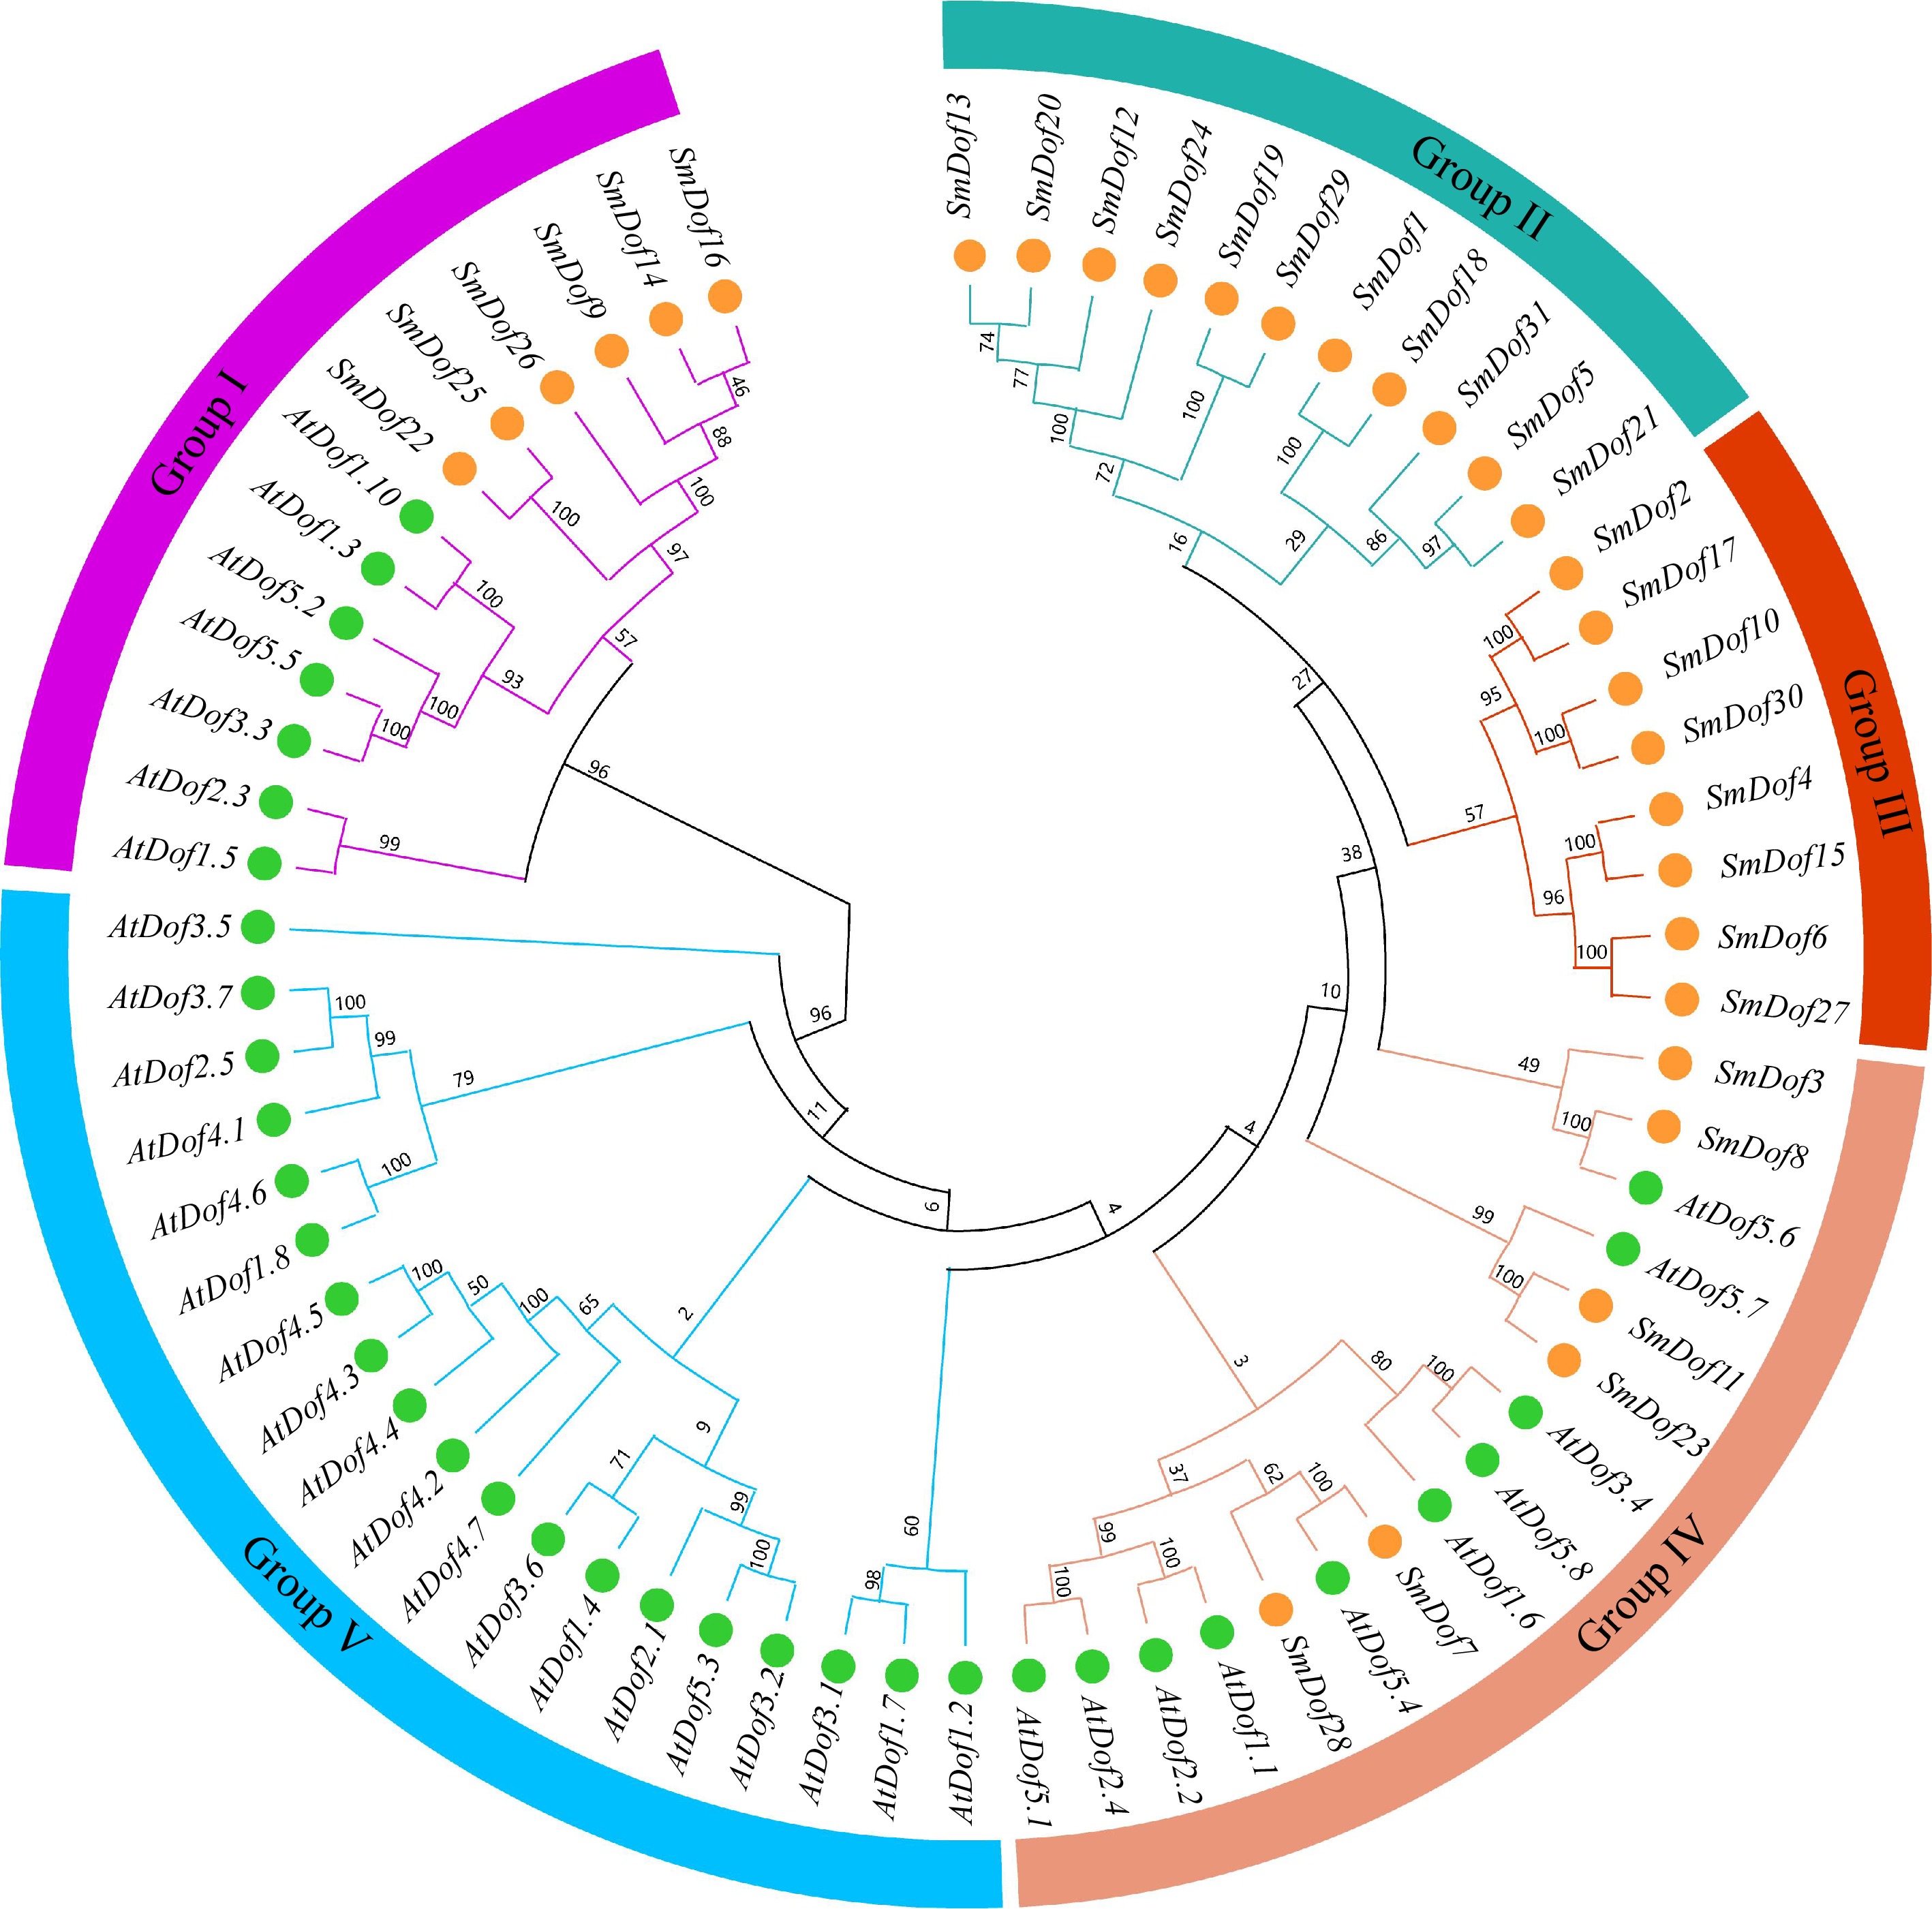
Figure 2.
Evolutionary relationship of SmDof proteins in S. miltiorrhiza and Arabidopsis. Varied colors represent different groups. There were five groups, Groups I−V, with the green circles representing the SmDof proteins of Arabidopsis and the orange circles representing the Dof proteins of S. miltiorrhiza.
-
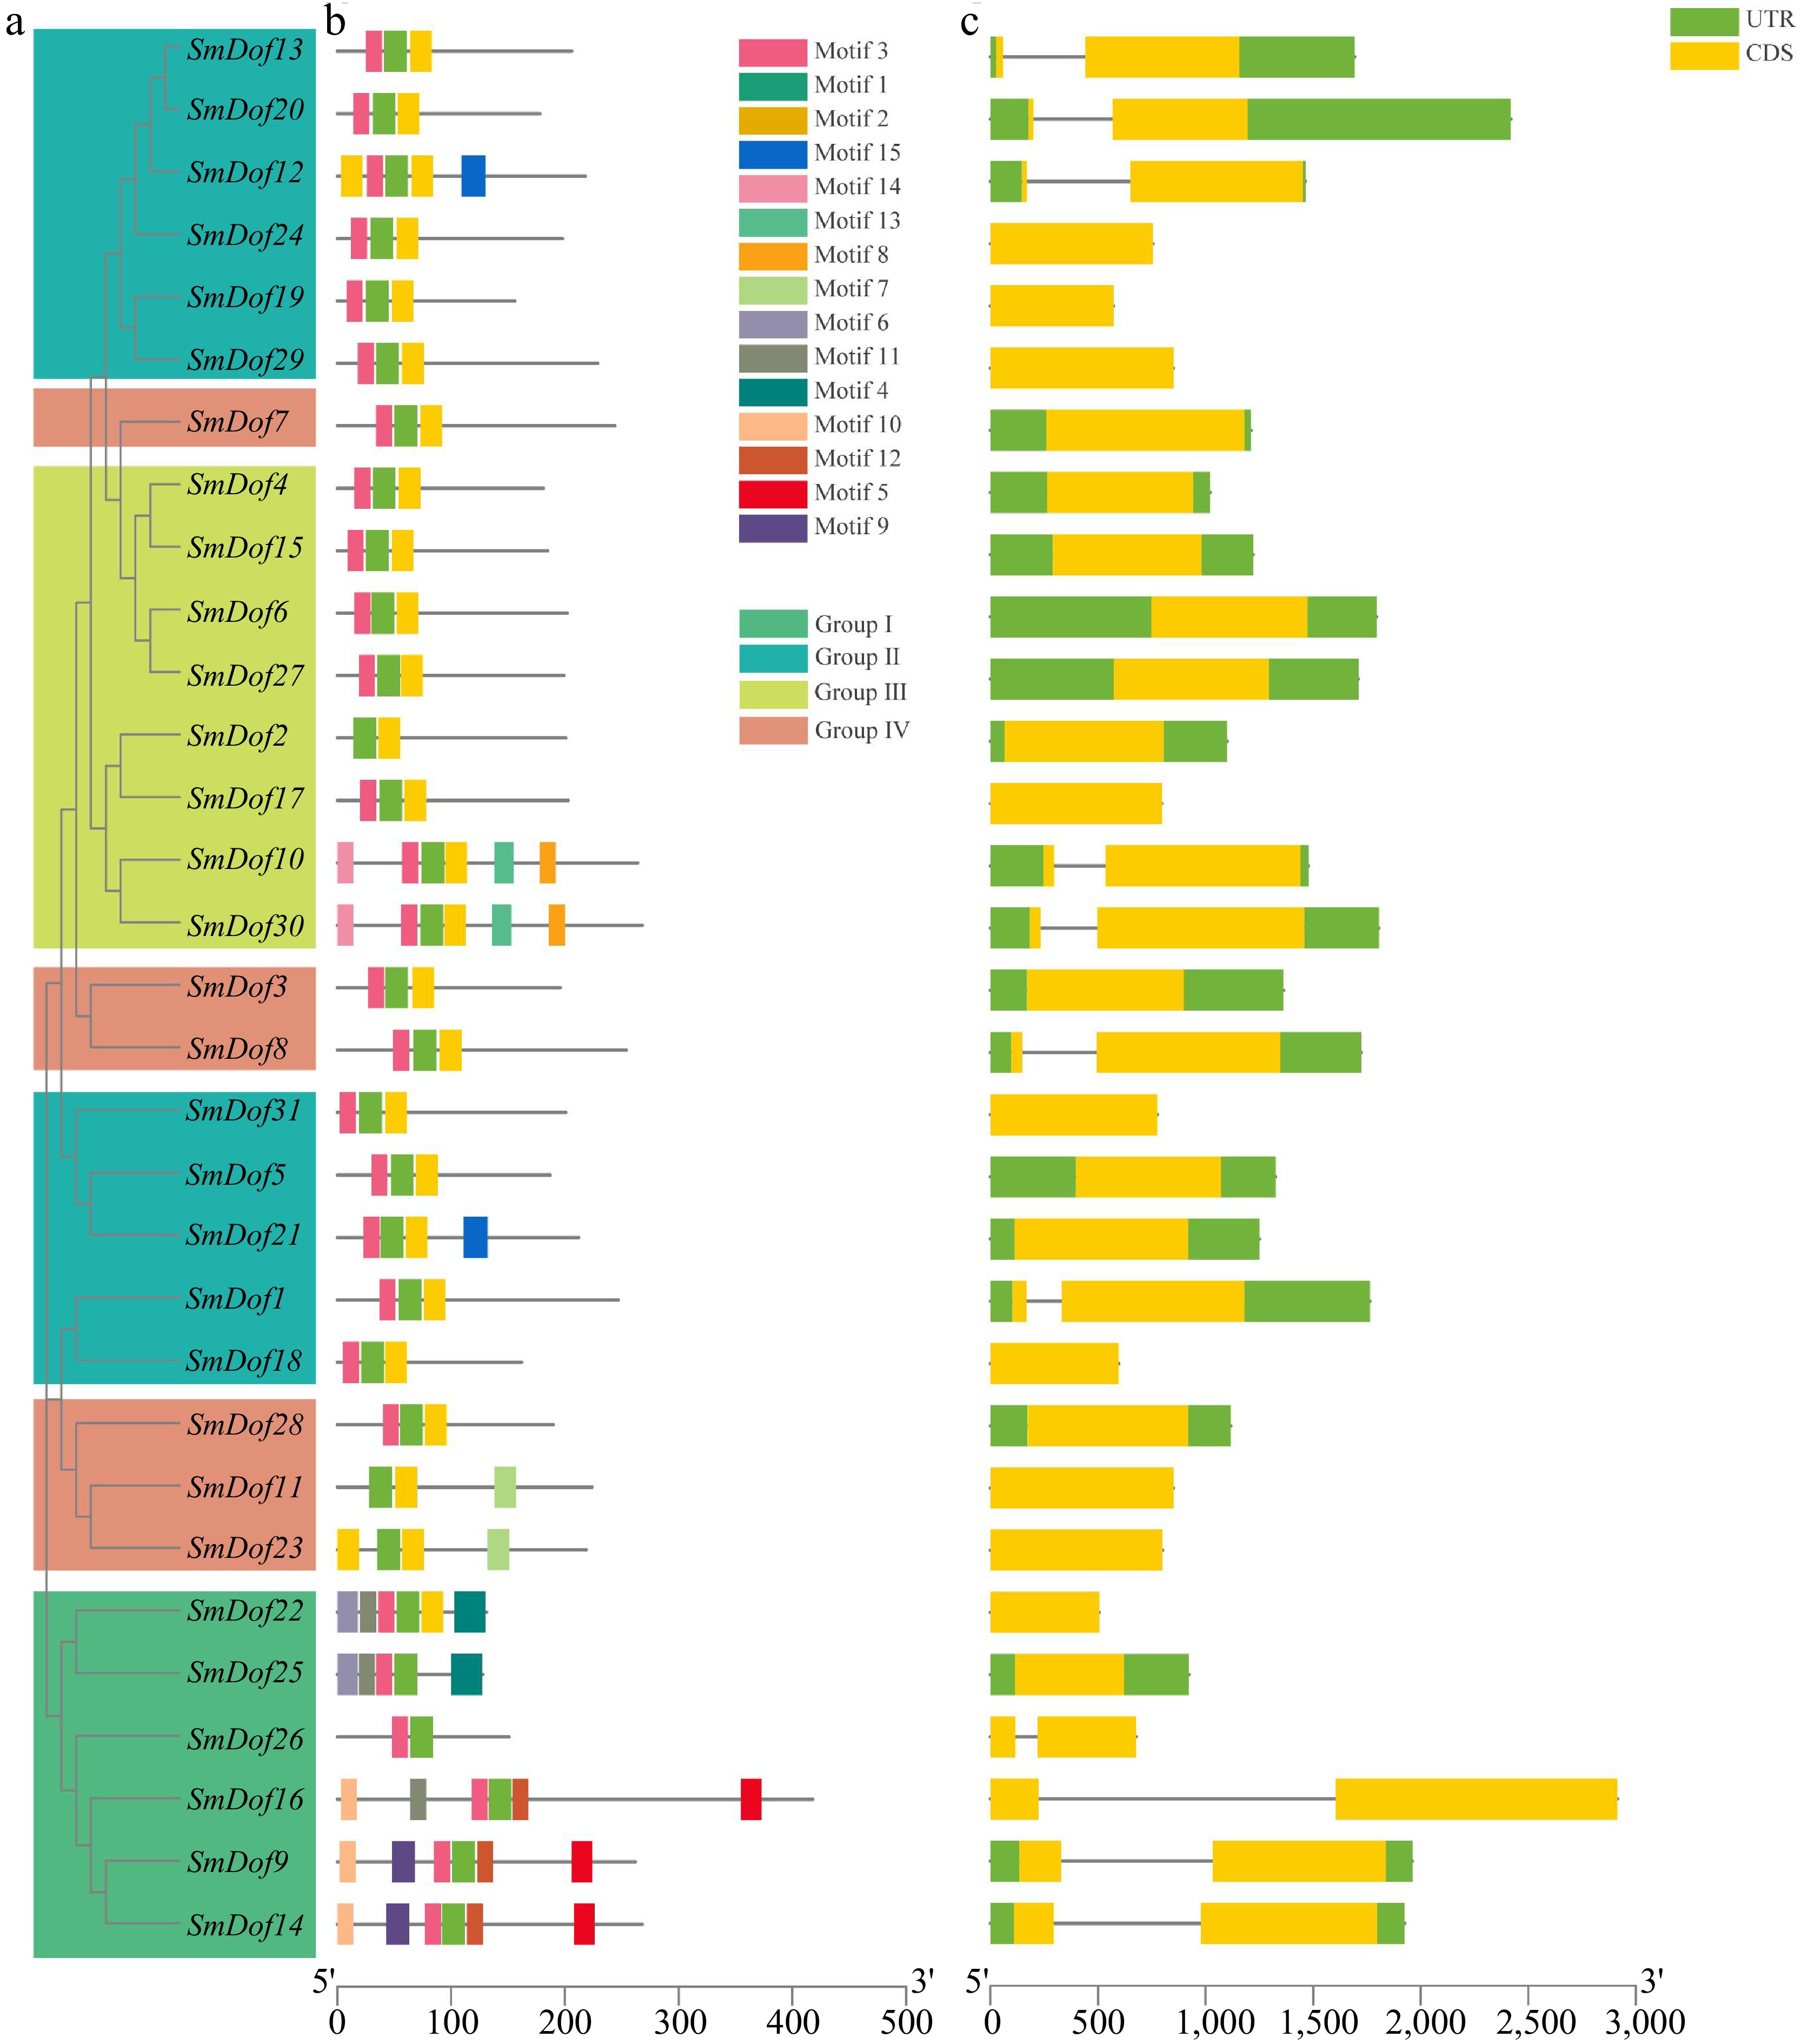
Figure 3.
Phylogeny, conserved motifs and gene structure of SmDof proteins in S. miltiorrhiza. (a) SmDof proteins evolutionary tree. (b) Conserved motifs of the 31 SmDof proteins. Different colors represent 15 different motifs, and the bottom line represents the length of the sequence. (c) Exon/intron structures of SmDofs. Green represents UTRs and yellow represents CDS.
-
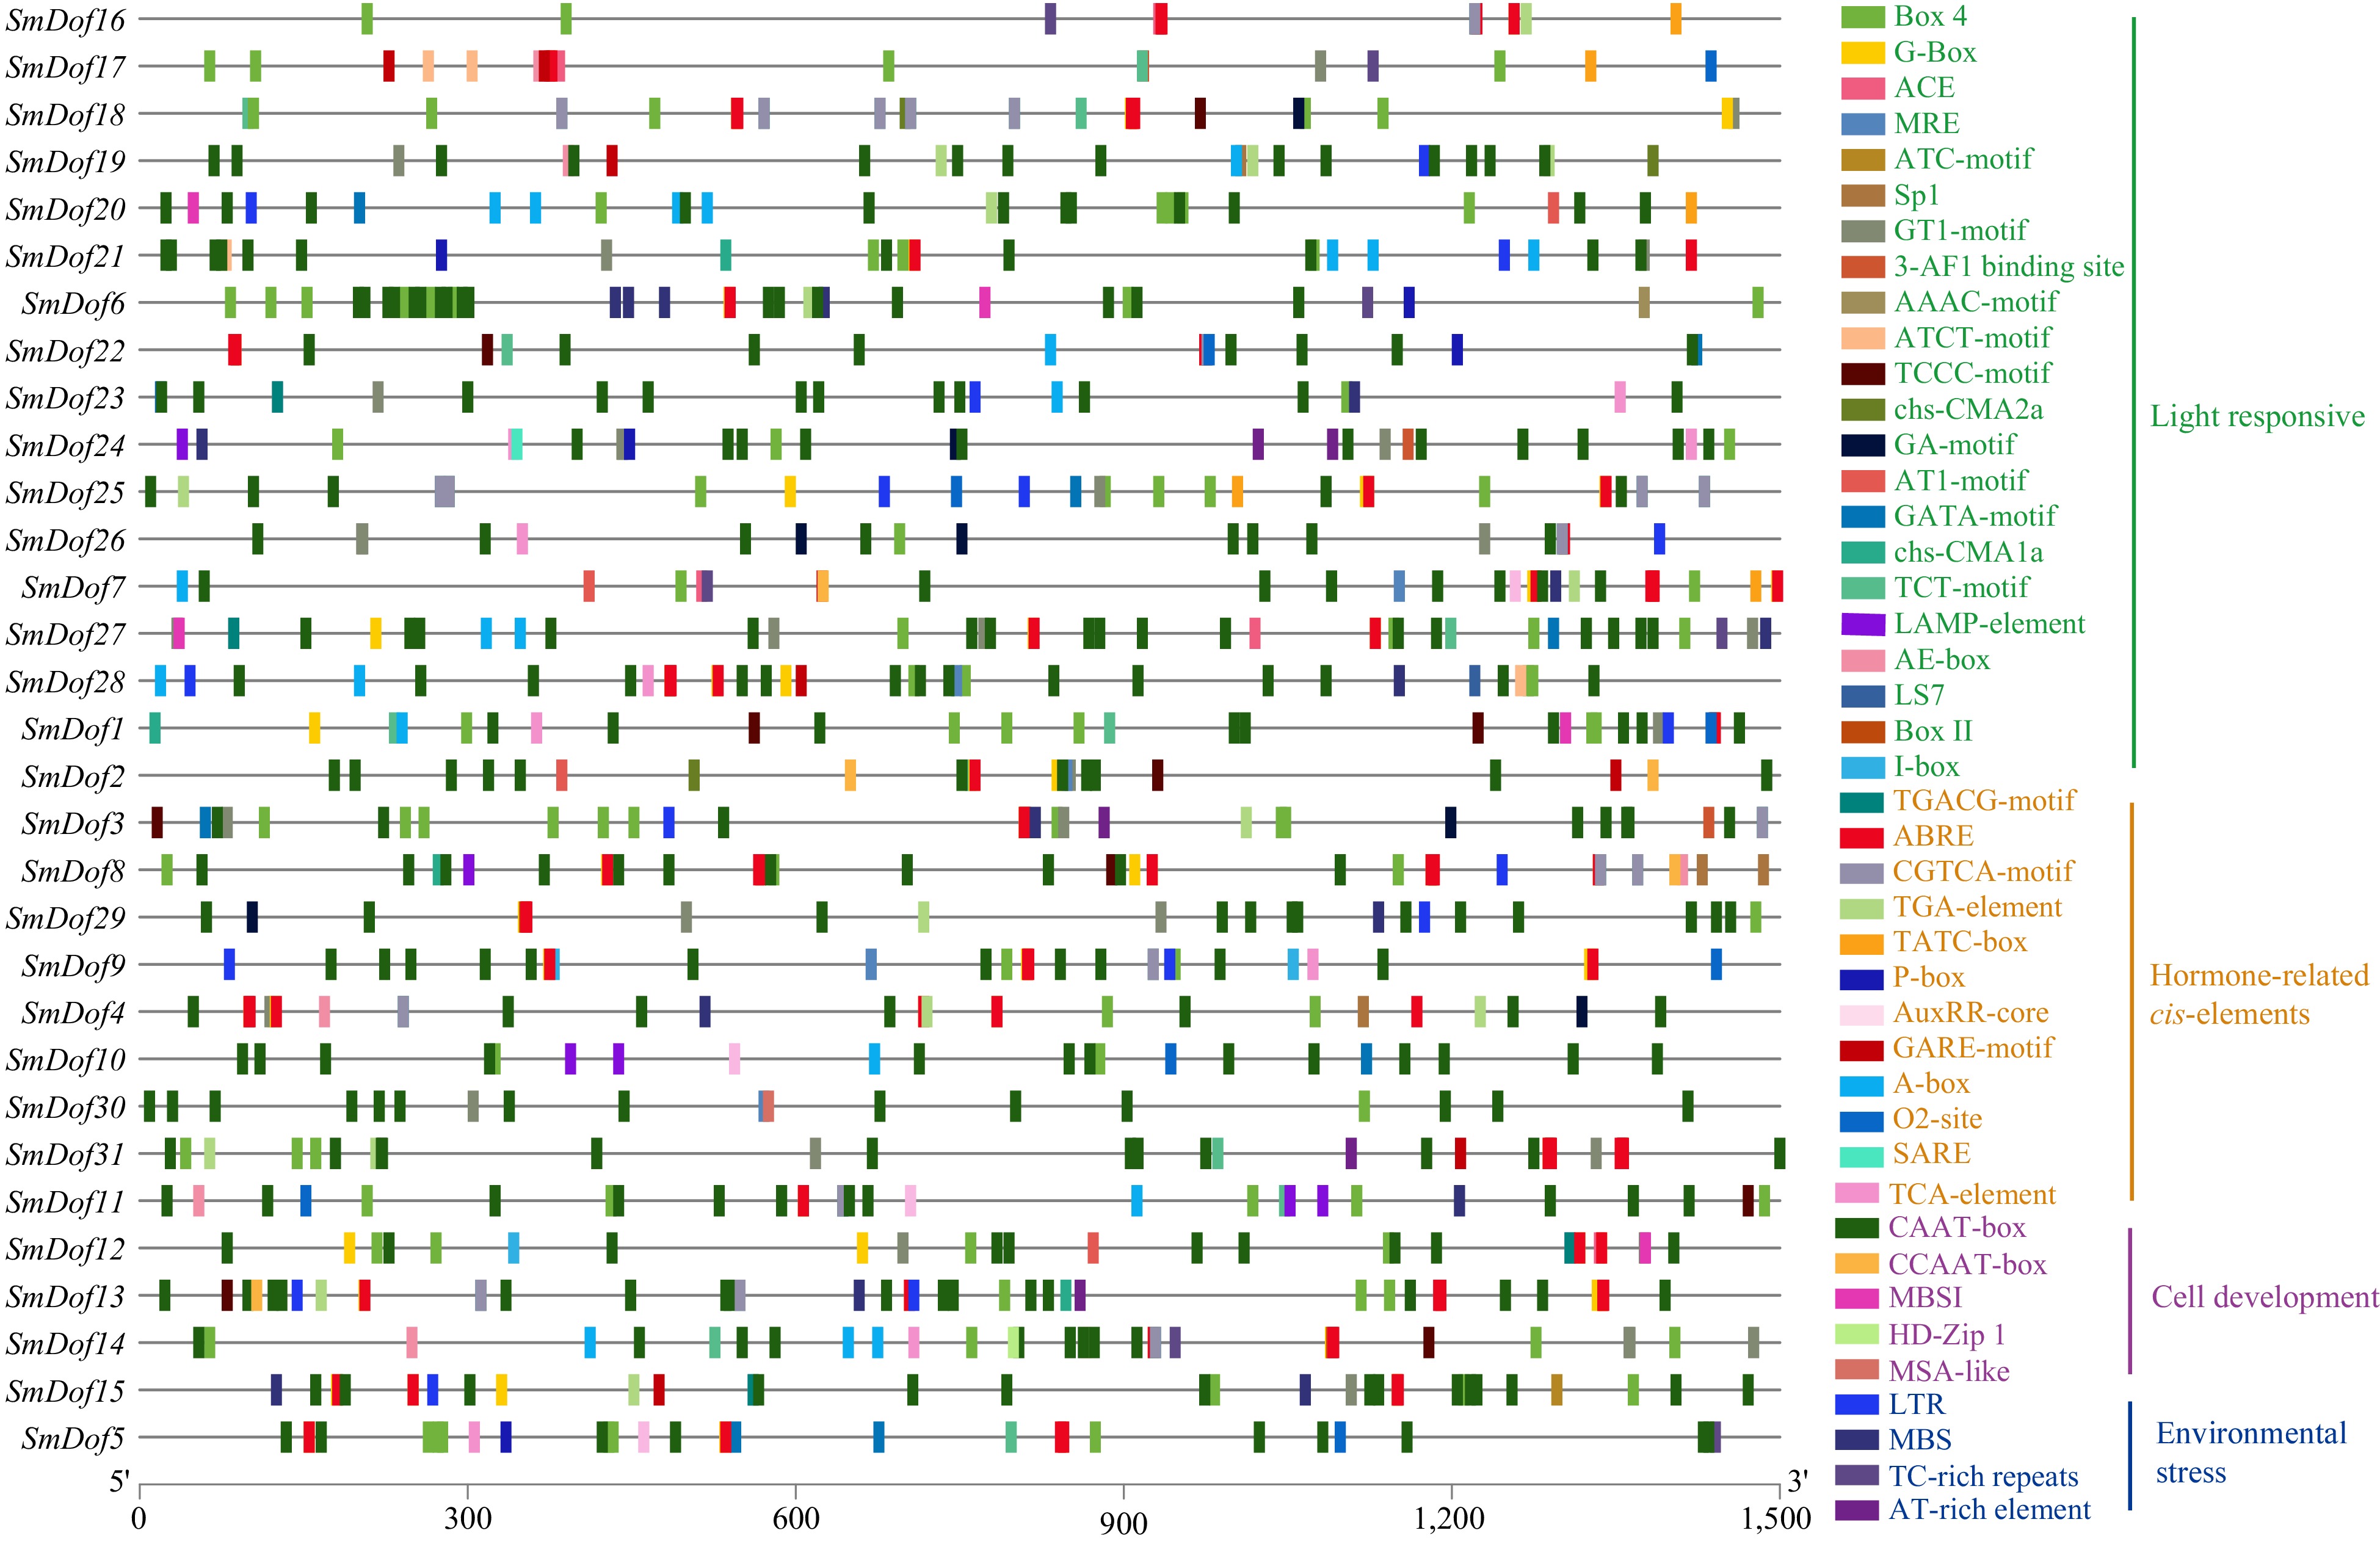
Figure 4.
Cis-acting elements of SmDof promoters in S. miltiorrhiza. Dof family cis-acting element of S. miltiorrhiza. Different colors represent different classes of cis-acting elements and motifs. Green represents cis-acting elements associated with light, yellow represents cis-acting elements associated with plant hormones, purple represents cis-acting elements associated with cell development, and blue represents environmental stress.
-
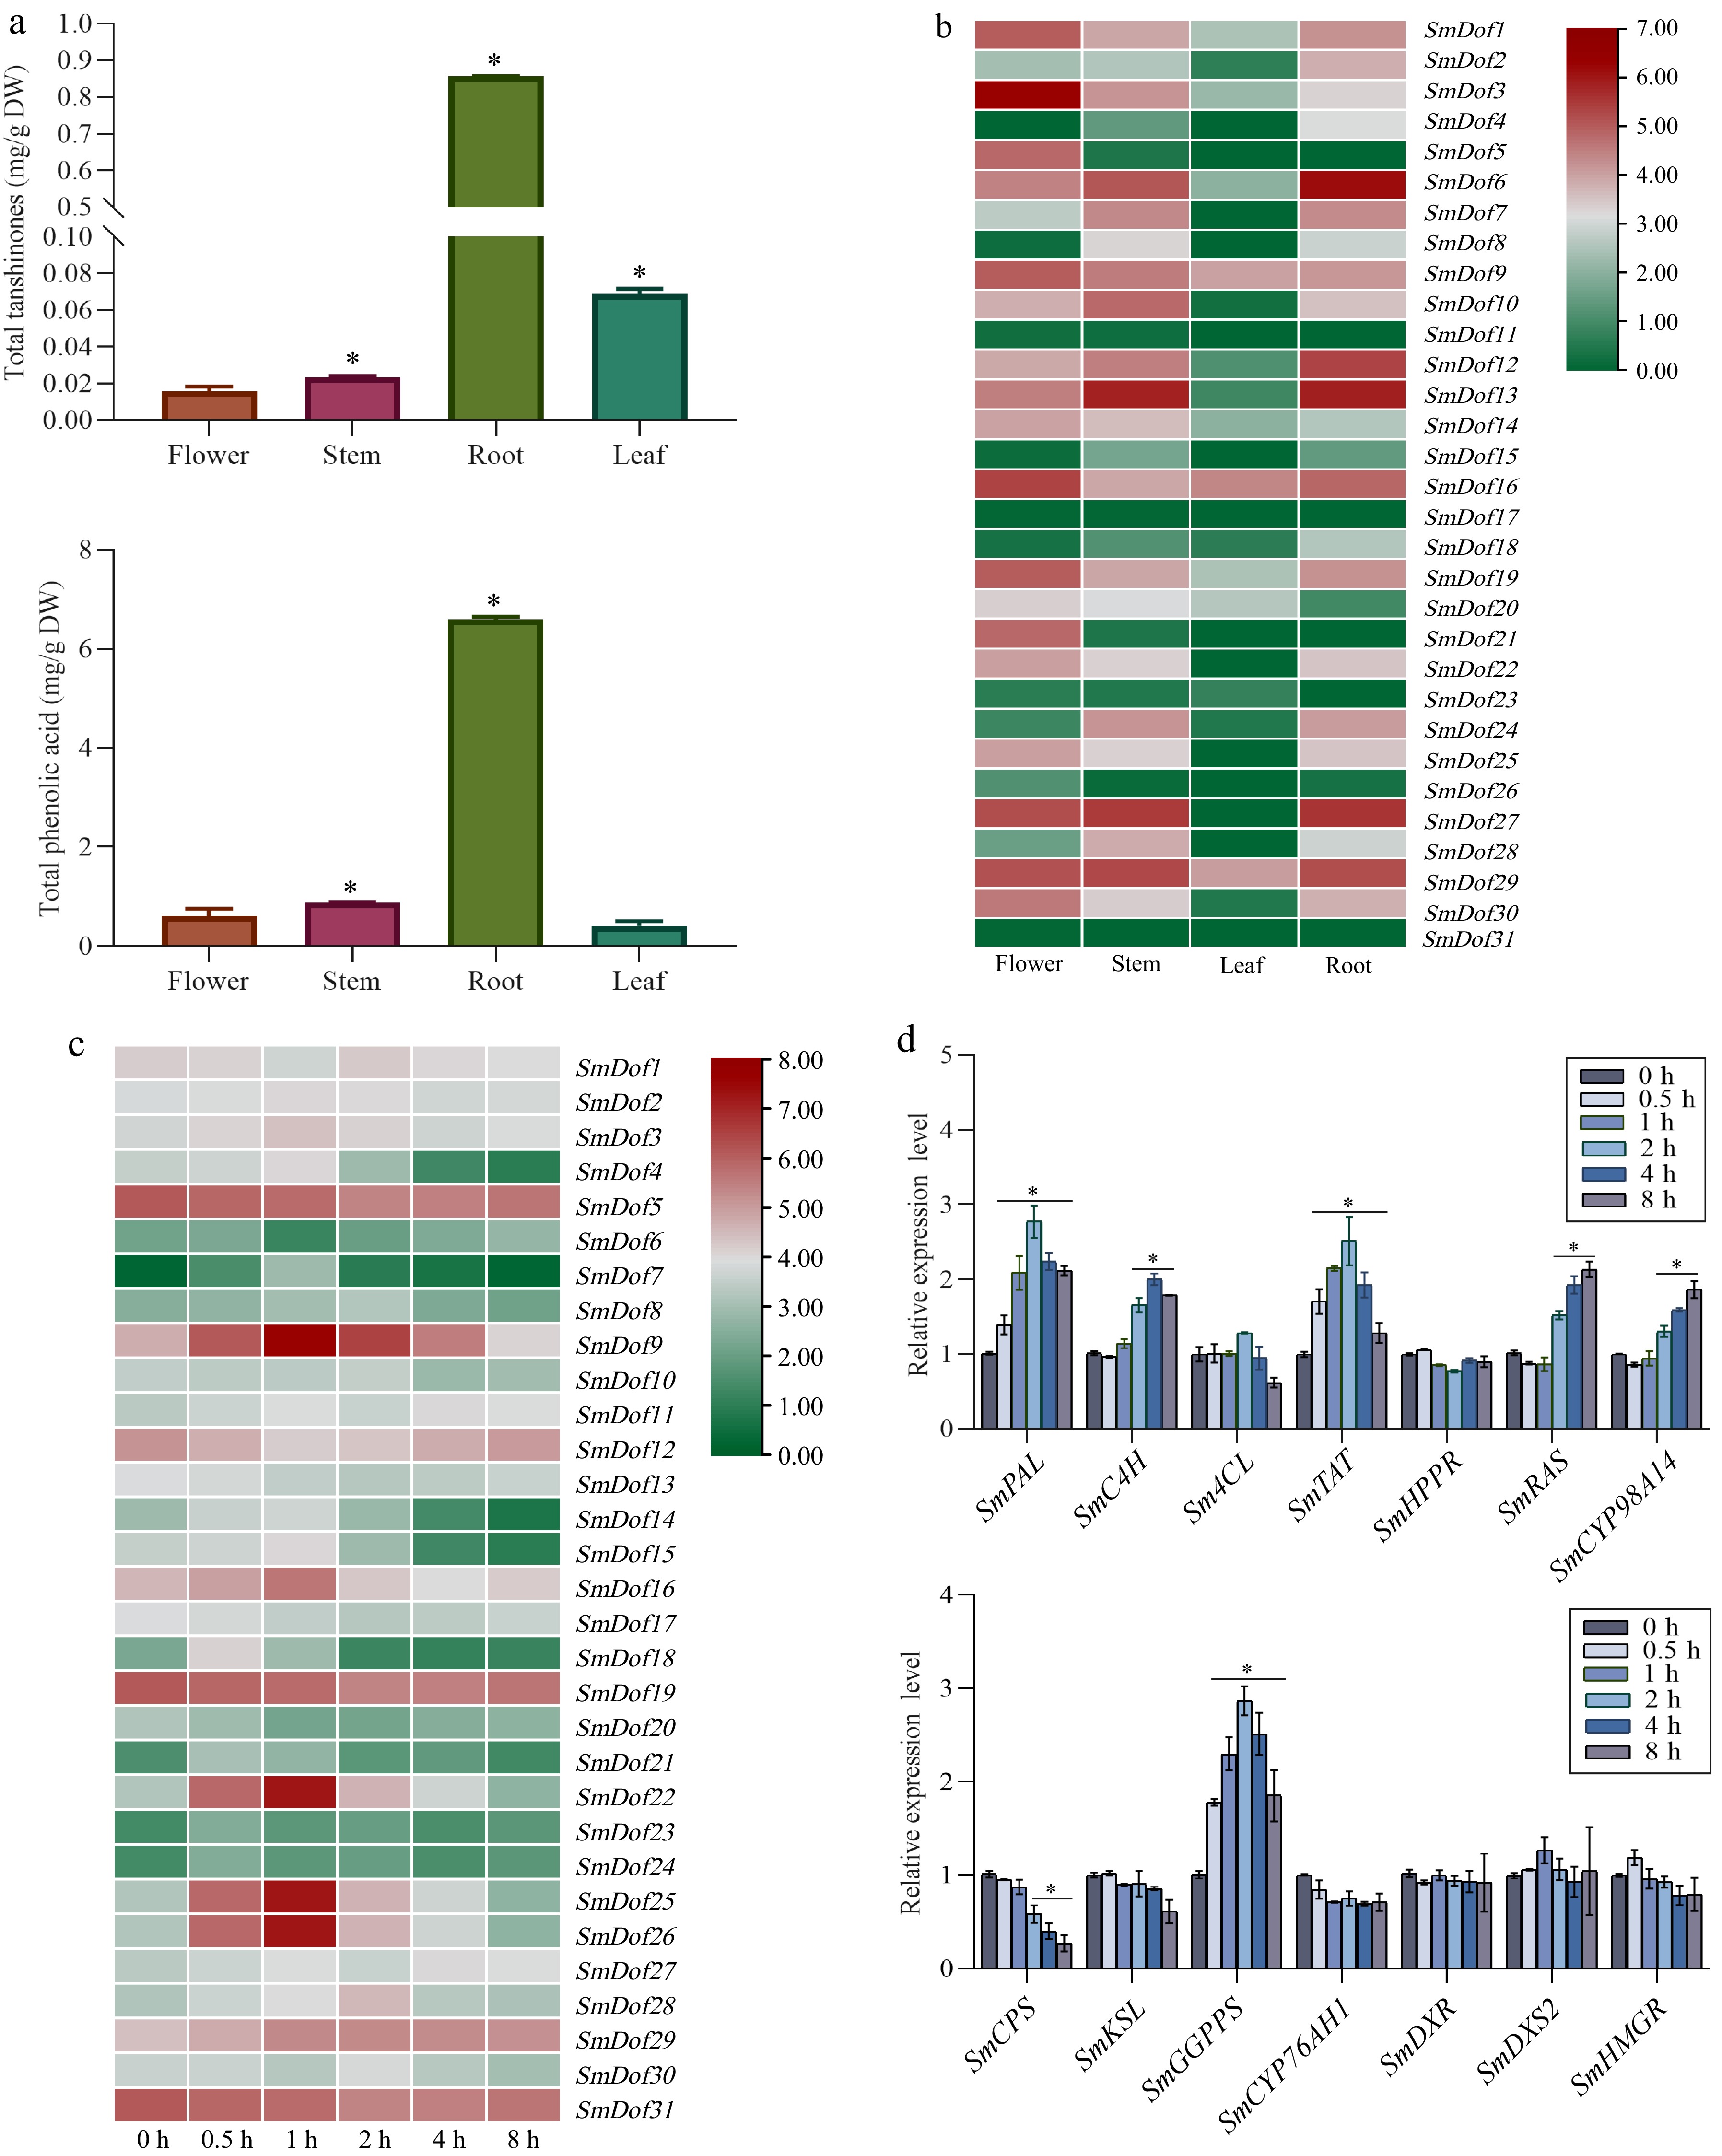
Figure 5.
Expression profiles of SmDof genes and synthetase genes involved in tanshinones and phenolic acids biosynthesis pathway. (a) Contents of tanshinones and phenolic acids in different tissues of S. miltiorrhiza. (b) Expression profiles of SmDof gene in various tissues of S. miltiorrhiza. (c) Expression profile of SmDof genes under the treatment of ABA induction based on the transcriptome dataset. Red and blue boxes indicate high and low expression levels of SmDofs, respectively. (d) Expression profiles of synthetase genes involved in tanshinones and phenolic acids biosynthesis pathway under the induction of exogenous ABA detected by qRT-PCR. Three biological replicates were performed and the mean ± SD was taken, SD was represented by the error line. * indicates significant difference in t-test (*p < 0.05).
-
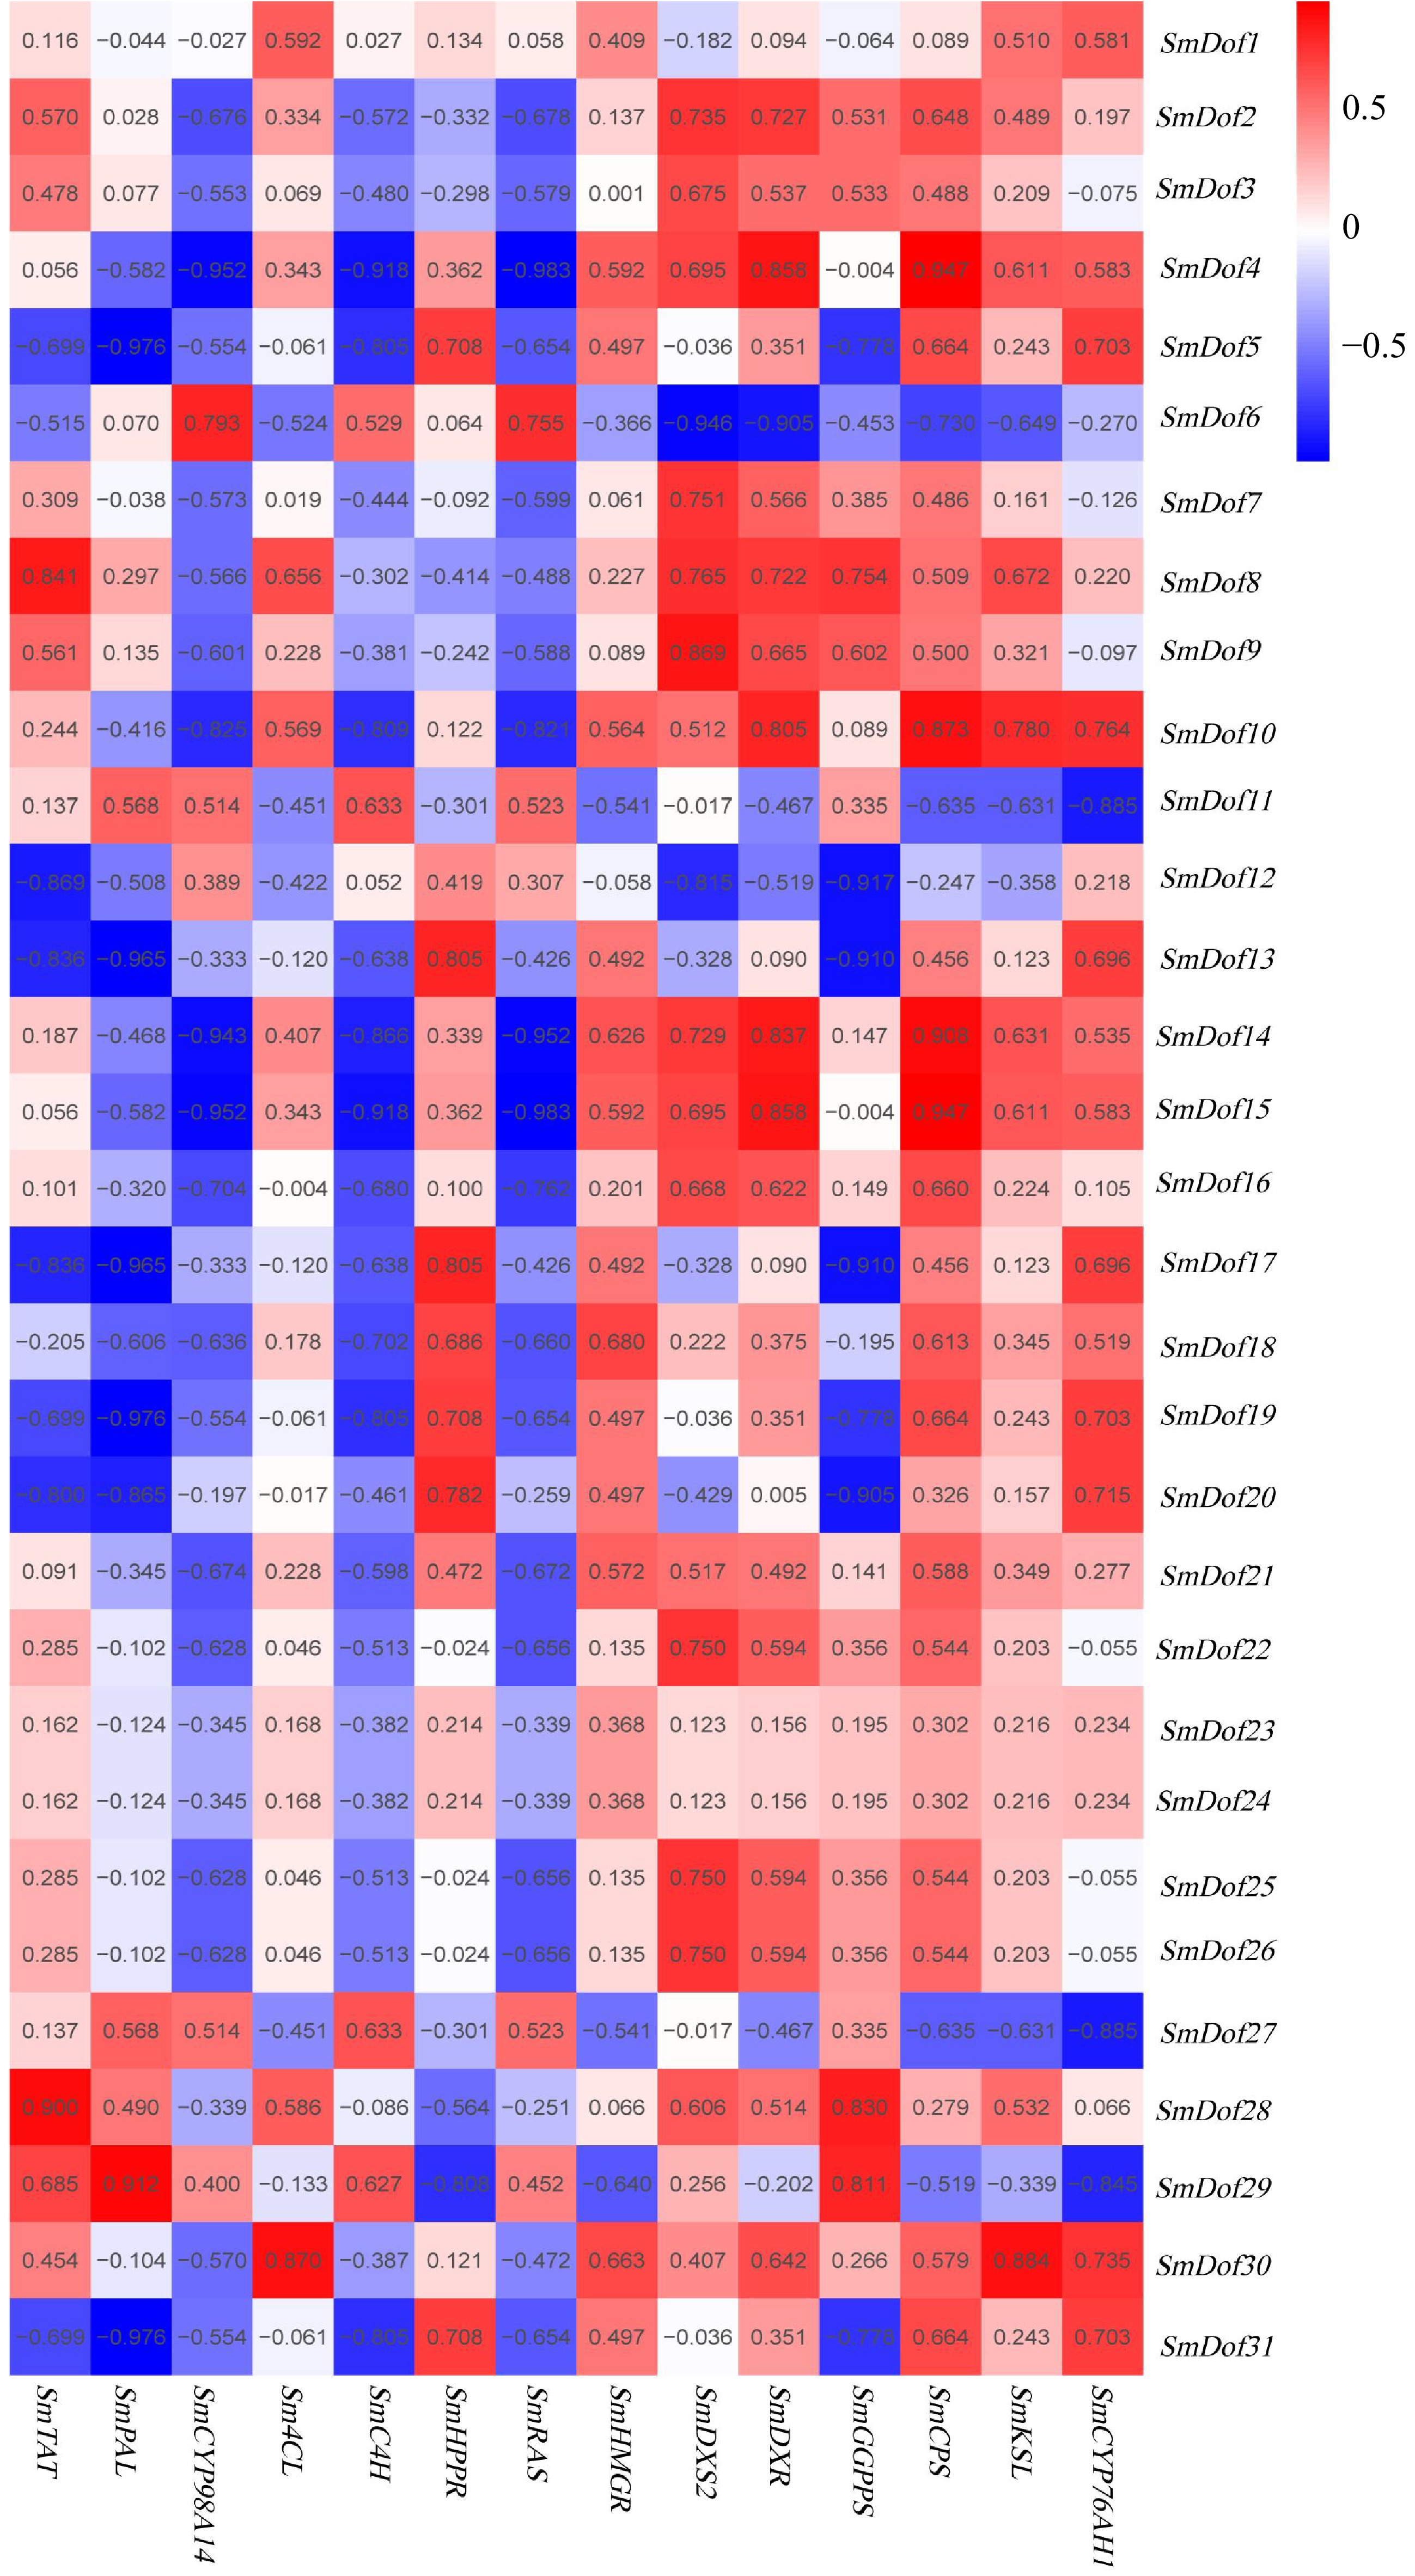
Figure 6.
Co-expression analysis of SmDof genes and the genes involved in the biosynthetic pathway of phenolic acids and tanshinones. R > 0.5 indicates a positive correlation; R < –0.5 indicates a negative correlation. The data were obtained from the ABA transcriptome dataset.
-
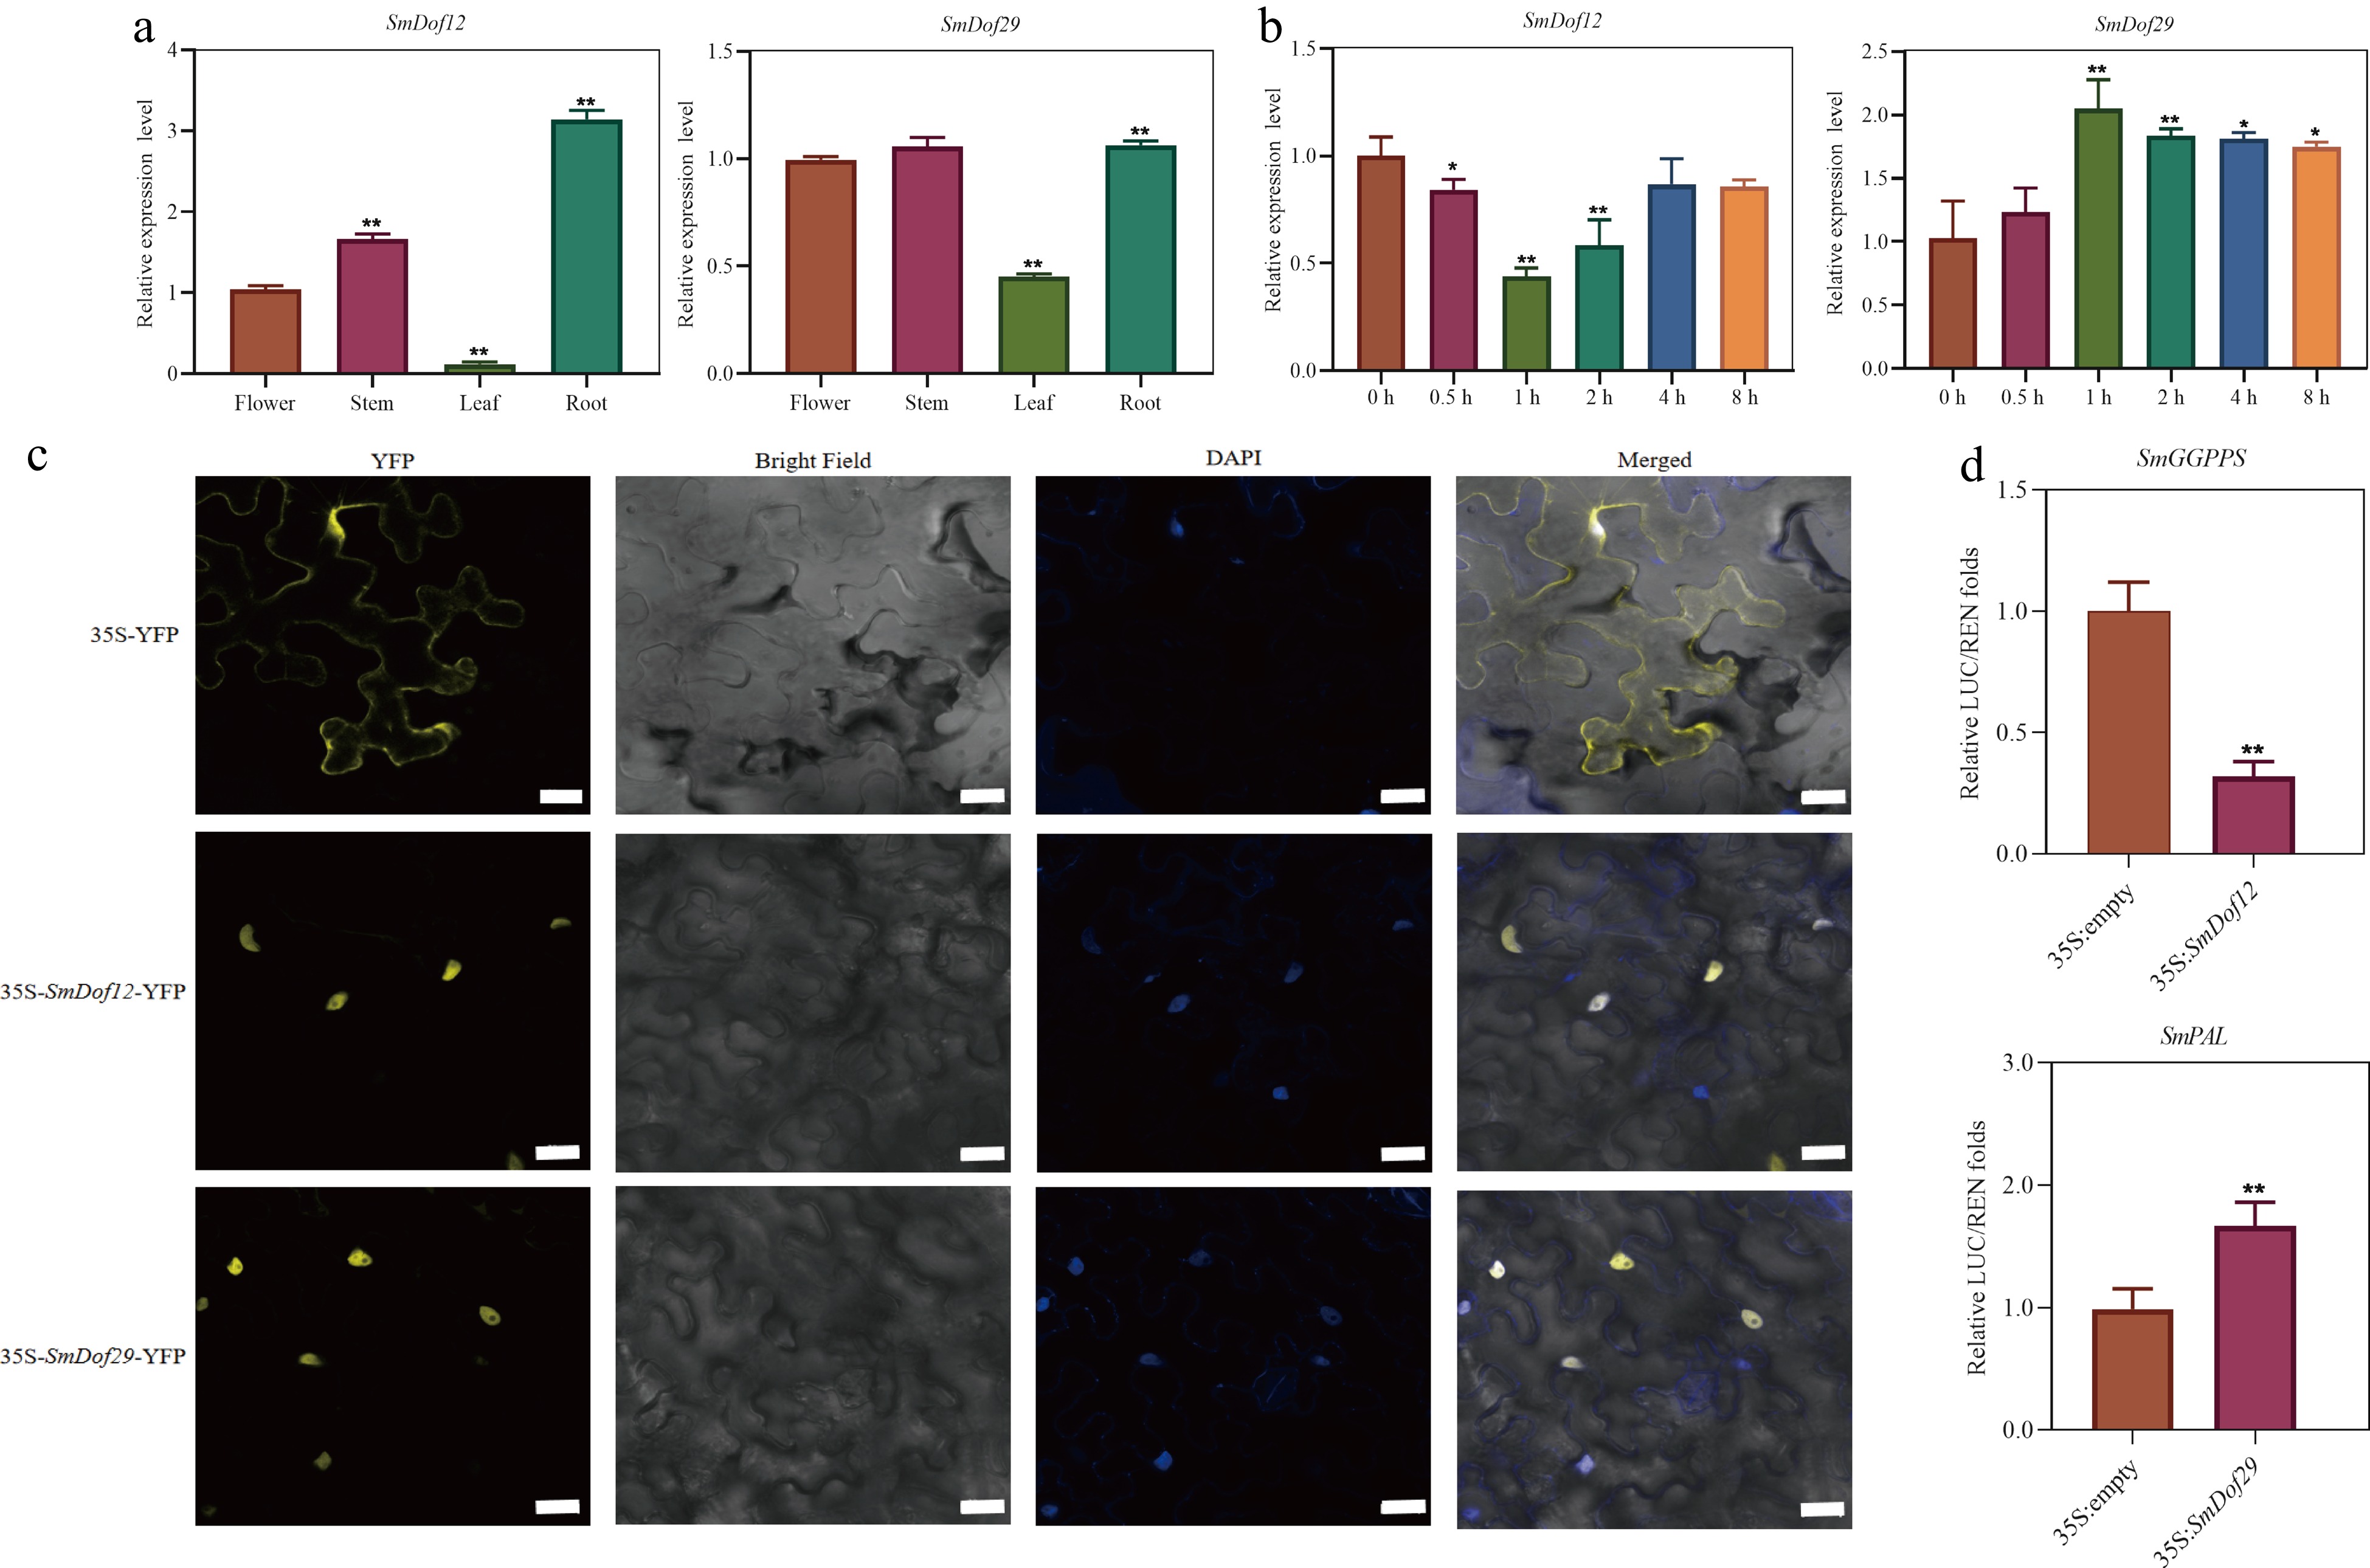
Figure 7.
Functional characterization of SmDof12 and SmDof29. (a) Expression patterns of SmDof12 and SmDof29 in four tissues of S. miltiorrhiza. The fold changes of the relative gene expression level in the other three tissues are all normalized to the expression level in flower. (b) Expression patterns of SmDof12 and SmDof29 in hairy roots of S. miltiorrhiza treated with ABA. The fold changes in the relative gene expression level were all normalized to the control expression without induction at the 0 h time point. (c) Subcellular localization of SmDof12 and SmDof29 in tobacco. 35S-YFP is the control group, yellow is the fluorescence of YFP, and blue is the nucleus. Scale bar = 50 μm. (d) Dual-Luc assay showed that SmDof12 could inhibit the activity of SmGGPPS promoter and SmDof29 could promote the activity of SmPAL promoter. Three biological replicates were performed and the mean ± SD was taken, SD was represented by the error line. * indicates significant difference in t-test (* p < 0.05, ** p < 0.01).
-
Gene ID Name Length (aa) MW (Da) pI Subcellar
localizationSMILT016590.1 SmDof1 304 33,168.7 8.66 nucleus SMILT016591.1 SmDof2 246 26,202.9 9.8 nucleus SMILT016651.1 SmDof3 242 26,184.9 8.96 nucleus SMILT021318.1 SmDof4 225 23,560.2 8.6 nucleus SMILT032678.1 SmDof5 224 24,689.4 6.01 nucleus SMILT003591.1 SmDof6 241 25,256.1 4.66 nucleus SMILT009582.1 SmDof7 306 32,436.3 4.69 nucleus SMILT017417.1 SmDof8 301 33,248.9 6.7 nucleus SMILT020107.1 SmDof9 332 36,827.9 7.94 nucleus SMILT023380.1 SmDof10 318 34,176.8 9.72 nucleus SMILT025505.1 SmDof11 283 30,690.9 8.48 nucleus SMILT025760.1 SmDof12 274 30,006.1 8.47 nucleus SMILT028288.1 SmDof13 249 27,303.1 8.99 nucleus SMILT030586.1 SmDof14 334 36,582.9 6.92 nucleus SMILT031093.1 SmDof15 230 23,444.9 8.49 nucleus SMILT000323.1 SmDof16 511 55,341.6 5.23 nucleus SMILT000784.1 SmDof17 265 27,611.4 10.55 nucleus SMILT000789.1 SmDof18 198 22,350 9.04 nucleus SMILT001058.1 SmDof19 190 20,795.1 9.27 chloroplast SMILT001687.1 SmDof20 216 24,023.7 9.28 nucleus SMILT002891.1 SmDof21 268 29,359.3 4.54 chloroplast SMILT004451.1 SmDof22 168 18,463.7 8.83 chloroplast SMILT005491.1 SmDof23 266 29,274.4 9.31 nucleus SMILT007077.1 SmDof24 251 27,427 9.06 nucleus SMILT007580.1 SmDof25 168 18,625.9 9.22 chloroplast SMILT009335.1 SmDof26 191 21,529.9 9.5 nucleus SMILT010473.1 SmDof27 240 24,863.9 7.82 nucleus SMILT012697.1 SmDof28 248 26,508.7 9.28 nucleus SMILT019592.1 SmDof29 283 30,740.7 8.39 nucleus SMILT023561.1 SmDof30 337 35,816.5 9.51 nucleus SMILT024154.1 SmDof31 258 27,841.9 8.06 nucleus Table 1.
Length, molecular weight, isoelectric point, and subcellular localization of 31 SmDof proteins in S. miltiorrhiza.
Figures
(7)
Tables
(1)