-
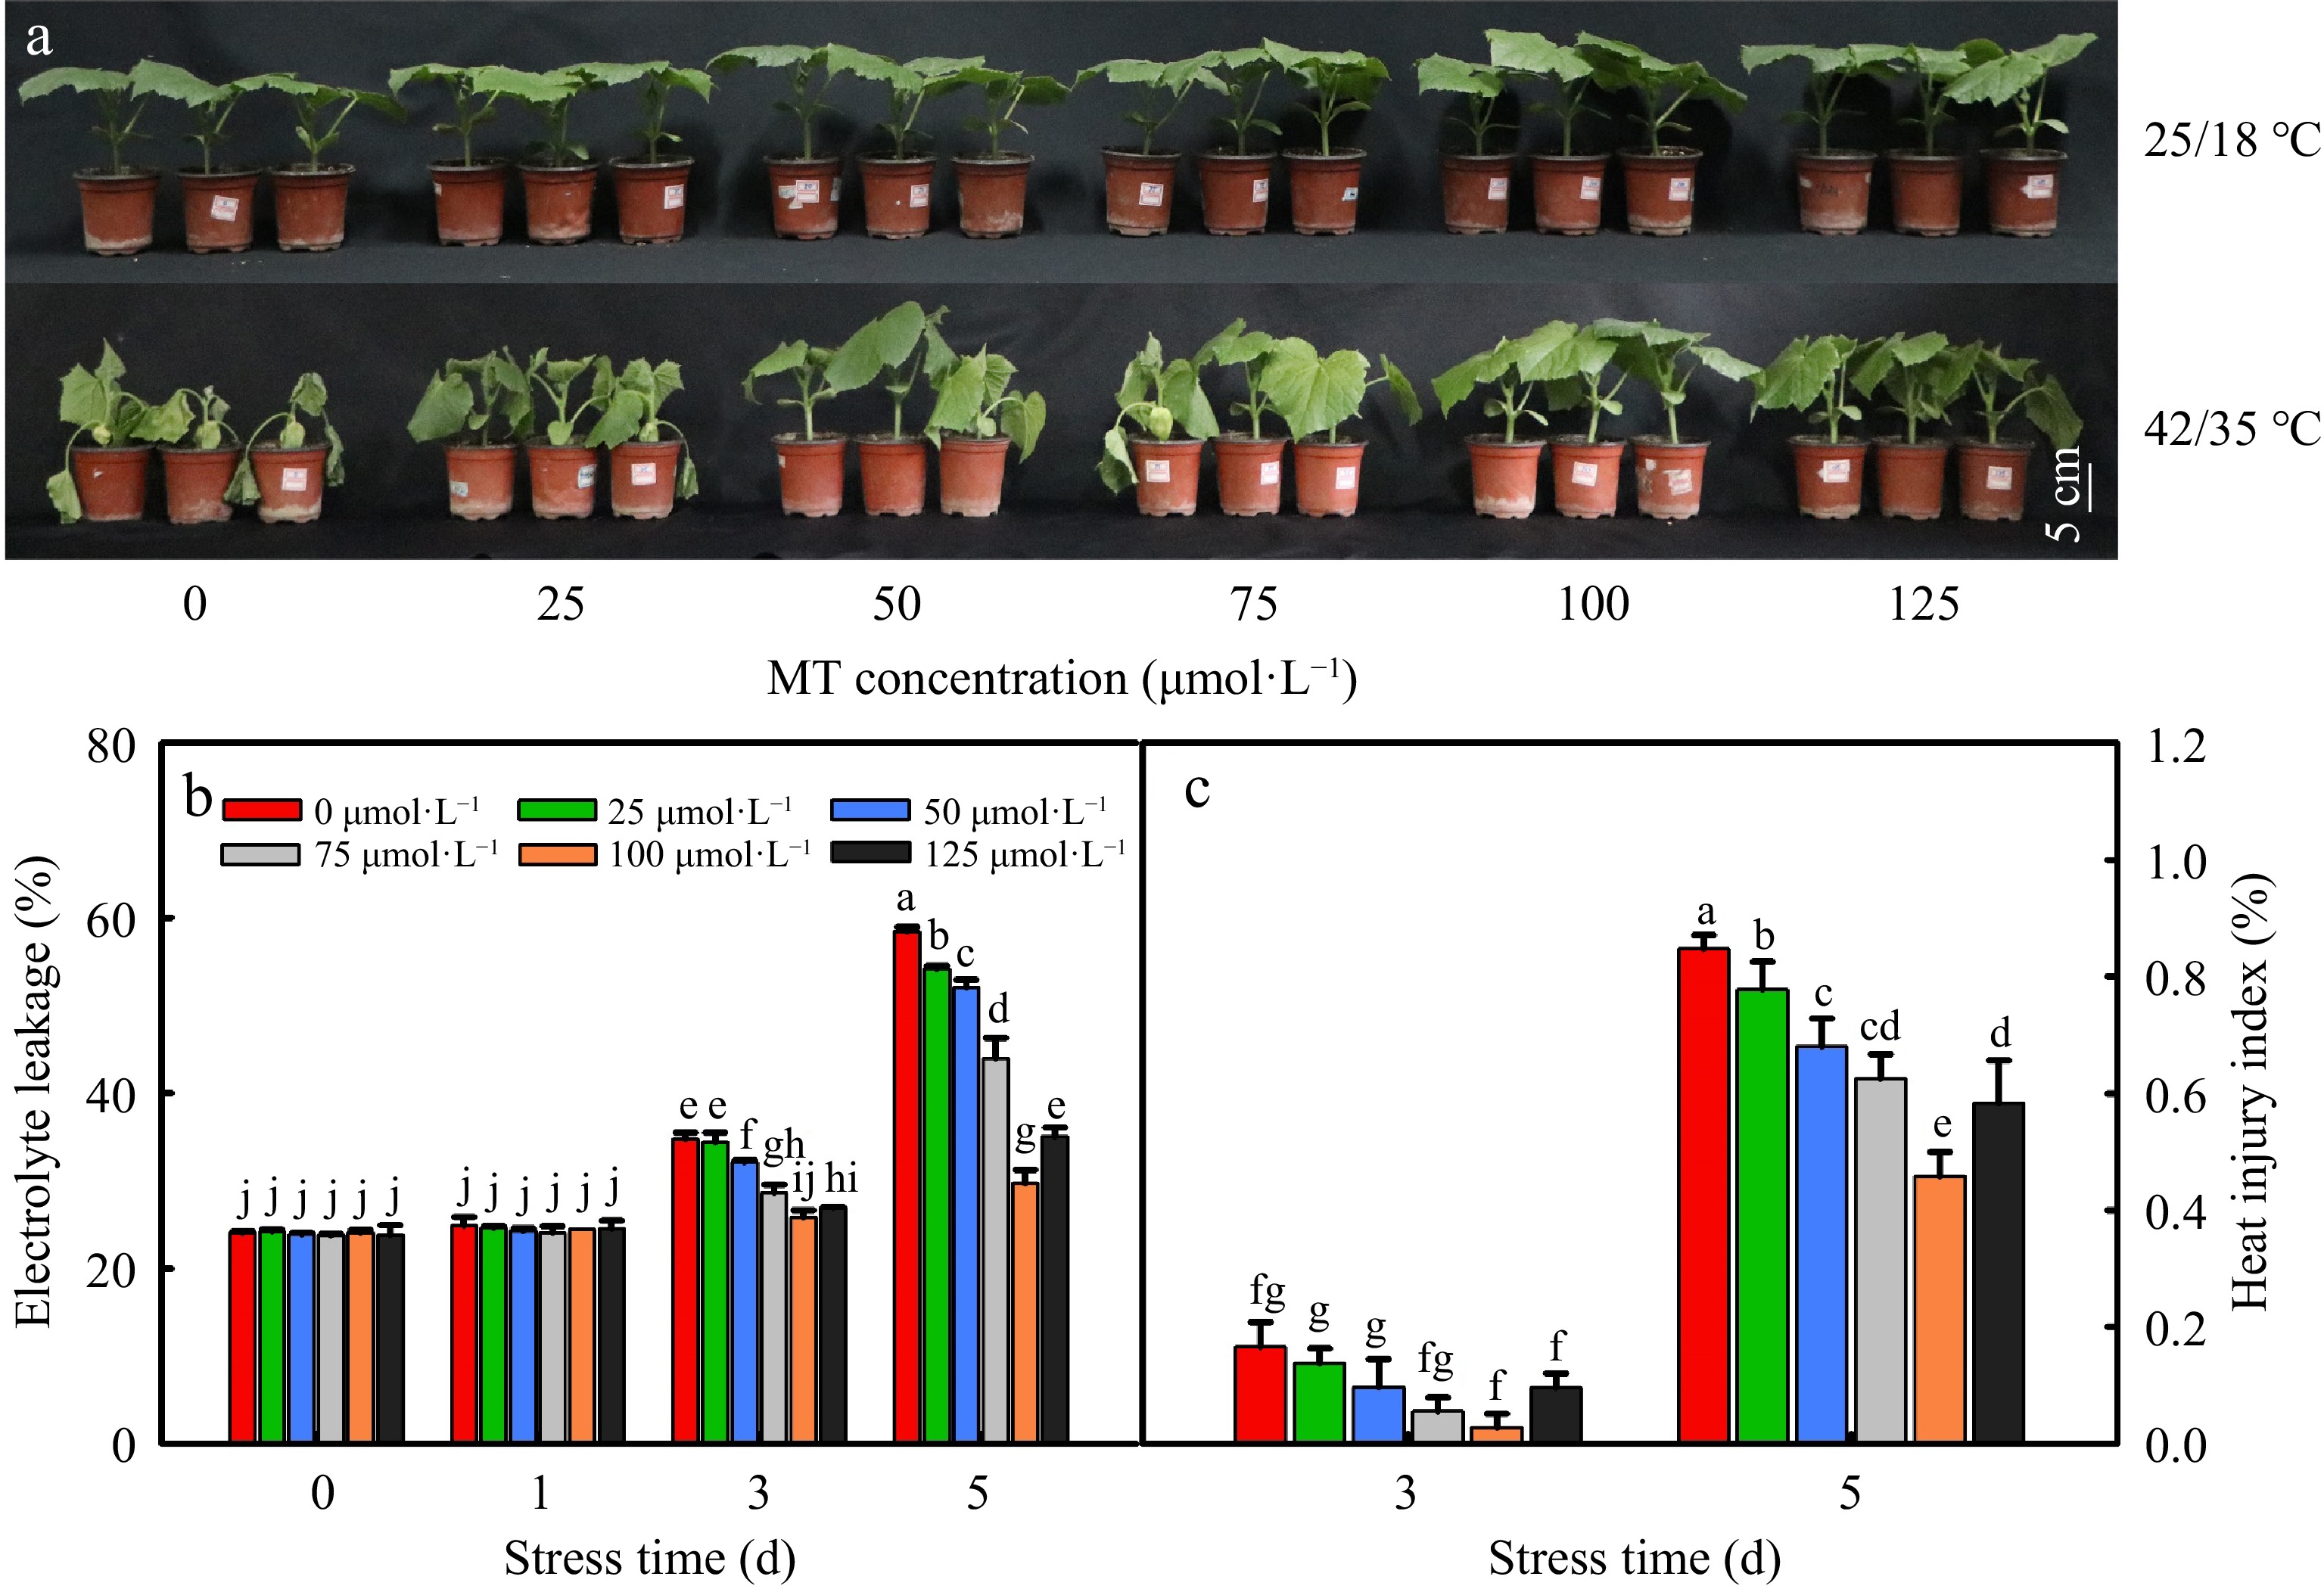
Figure 1.
The effect of different concentrations of melatonin on heat tolerance of cucumber seedings. (a) The phenotype of cucumber seedlings after 5 d of high temperature stress; (b) Electrolyte leakage rate; (c) Heat injury index. The two-leaf-stage cucumber seedlings were treated at 42/35 °C for 5 d, the samples were taken at 0, 1, 3, and 5 d after high temperature treatment. All values shown are the mean ± SD (n = 3). Lowercase letters a–j indicate that mean values are significantly different among samples (p < 0.05).
-
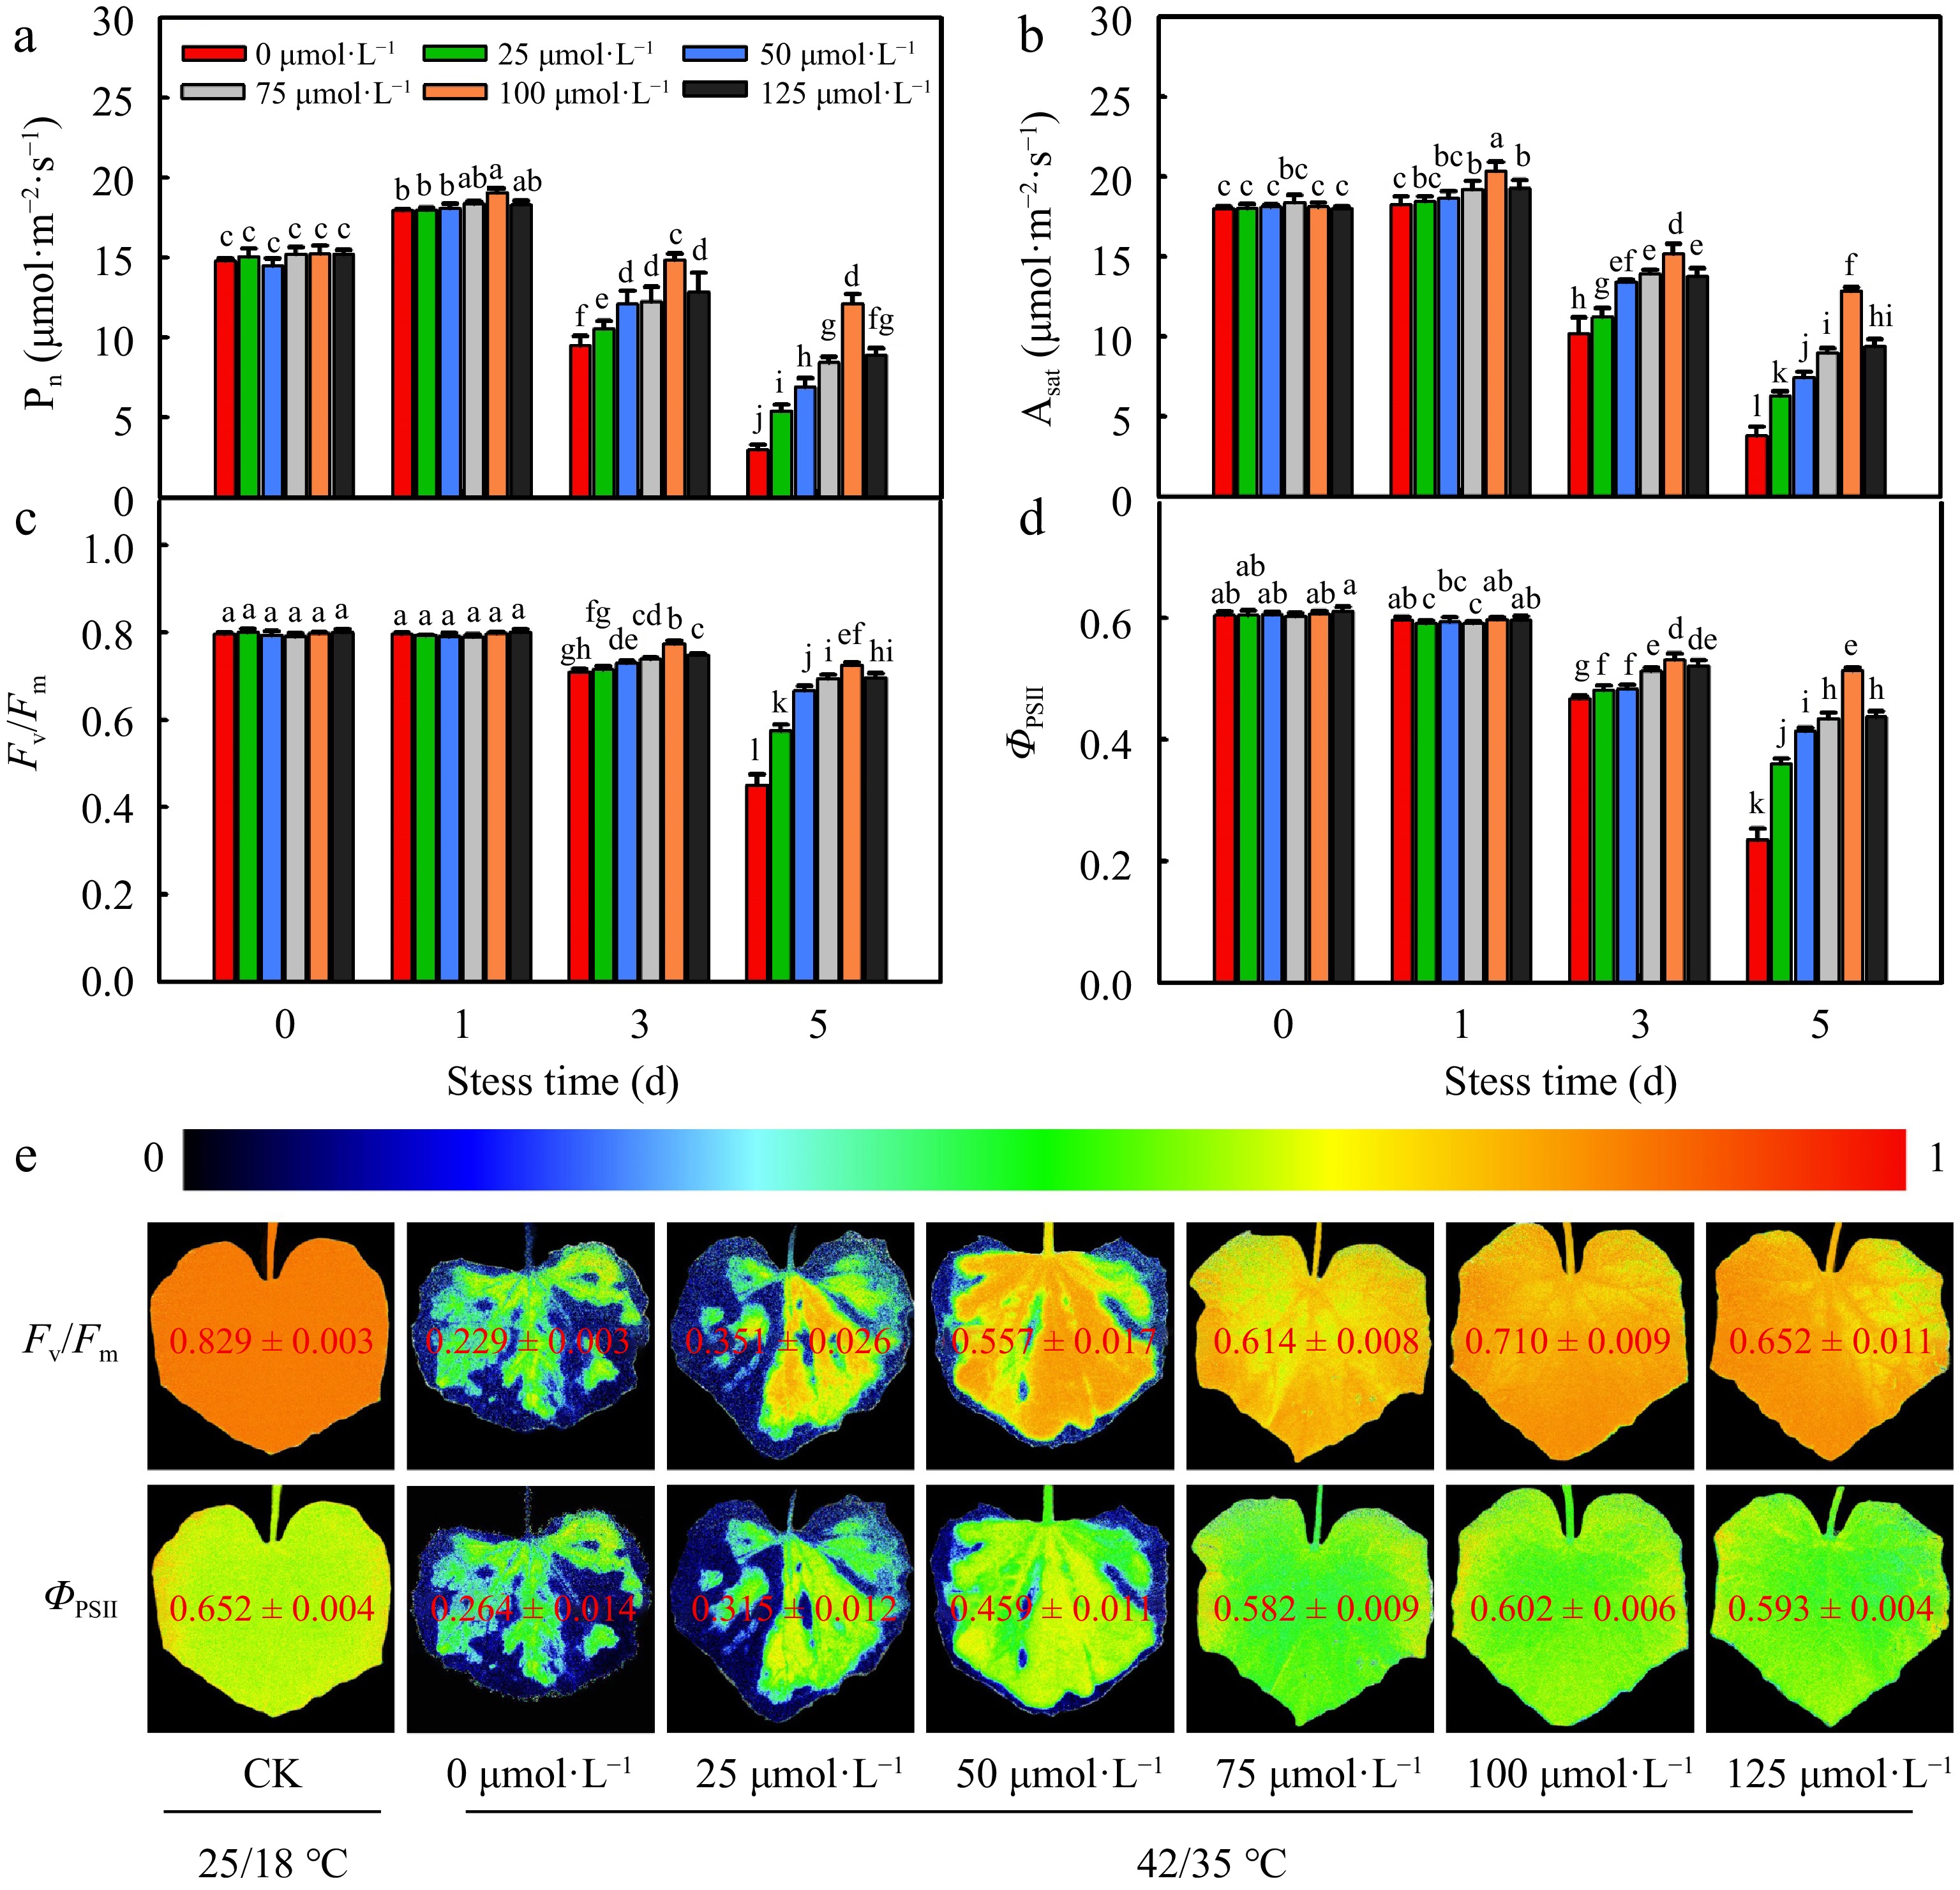
Figure 2.
The effect of different concentrations of melatonin on photosynthesis of cucumber seedings under high temperature stress. (a) Pn; (b)Asat; (c) Fv/Fm; (d) ΦPSII; (e) Images of Fv/Fm and ΦPSII. The two-leaf-stage cucumber seedlings were treated at 42/35 °C for 5 d. All values shown are the mean ± SD (n = 3). Lowercase letters a–l indicate that mean values are significantly different among treatments (p < 0.05).
-
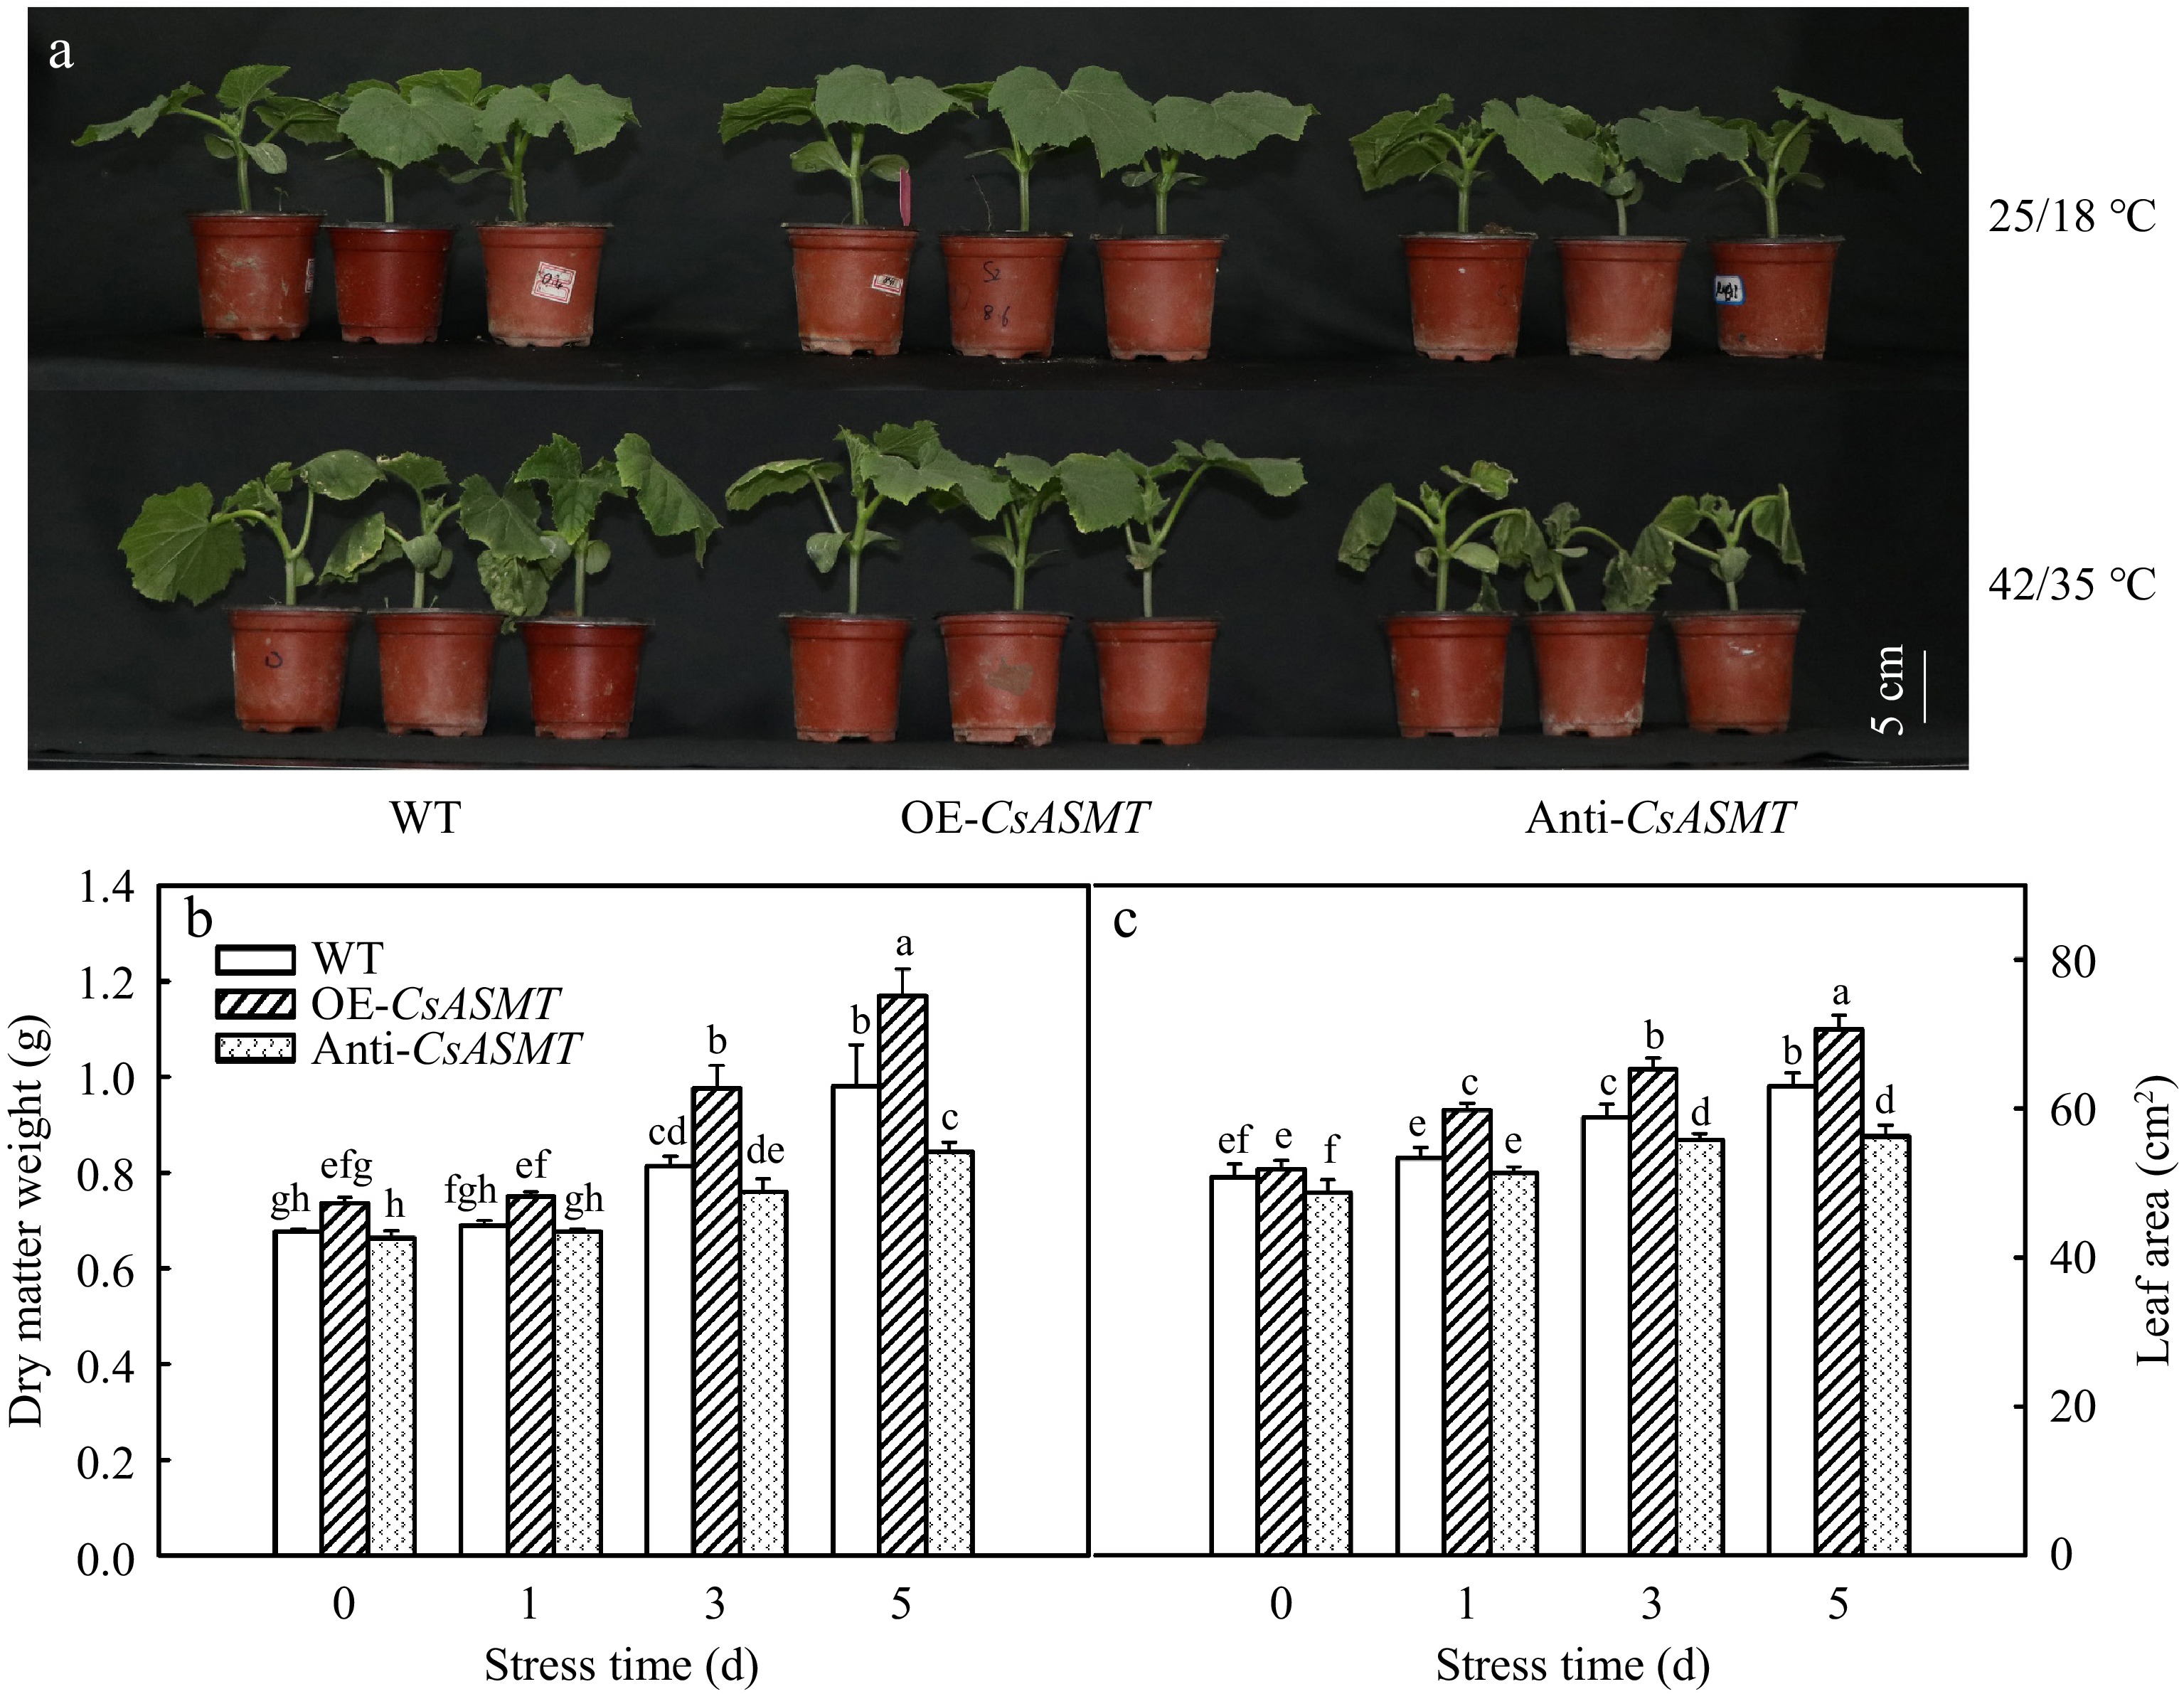
Figure 3.
The effect of CsASMT overexpression and inhibition on the growth of cucumber seedlings under high temperature stress. (a) The phenotype of cucumber seedlings after 5 d of high temperature stress; (b) Dry matter weight; (c) Leaf area. The two-leaf-stage cucumber seedlings were treated at 42/35 °C for 5 d, the samples were taken at 0, 1, 3, and 5 d after high temperature treatment. All values shown are the mean ± SD (n = 3). Lowercase letters a–h indicate that mean values are significantly different among treatments (p < 0.05).
-
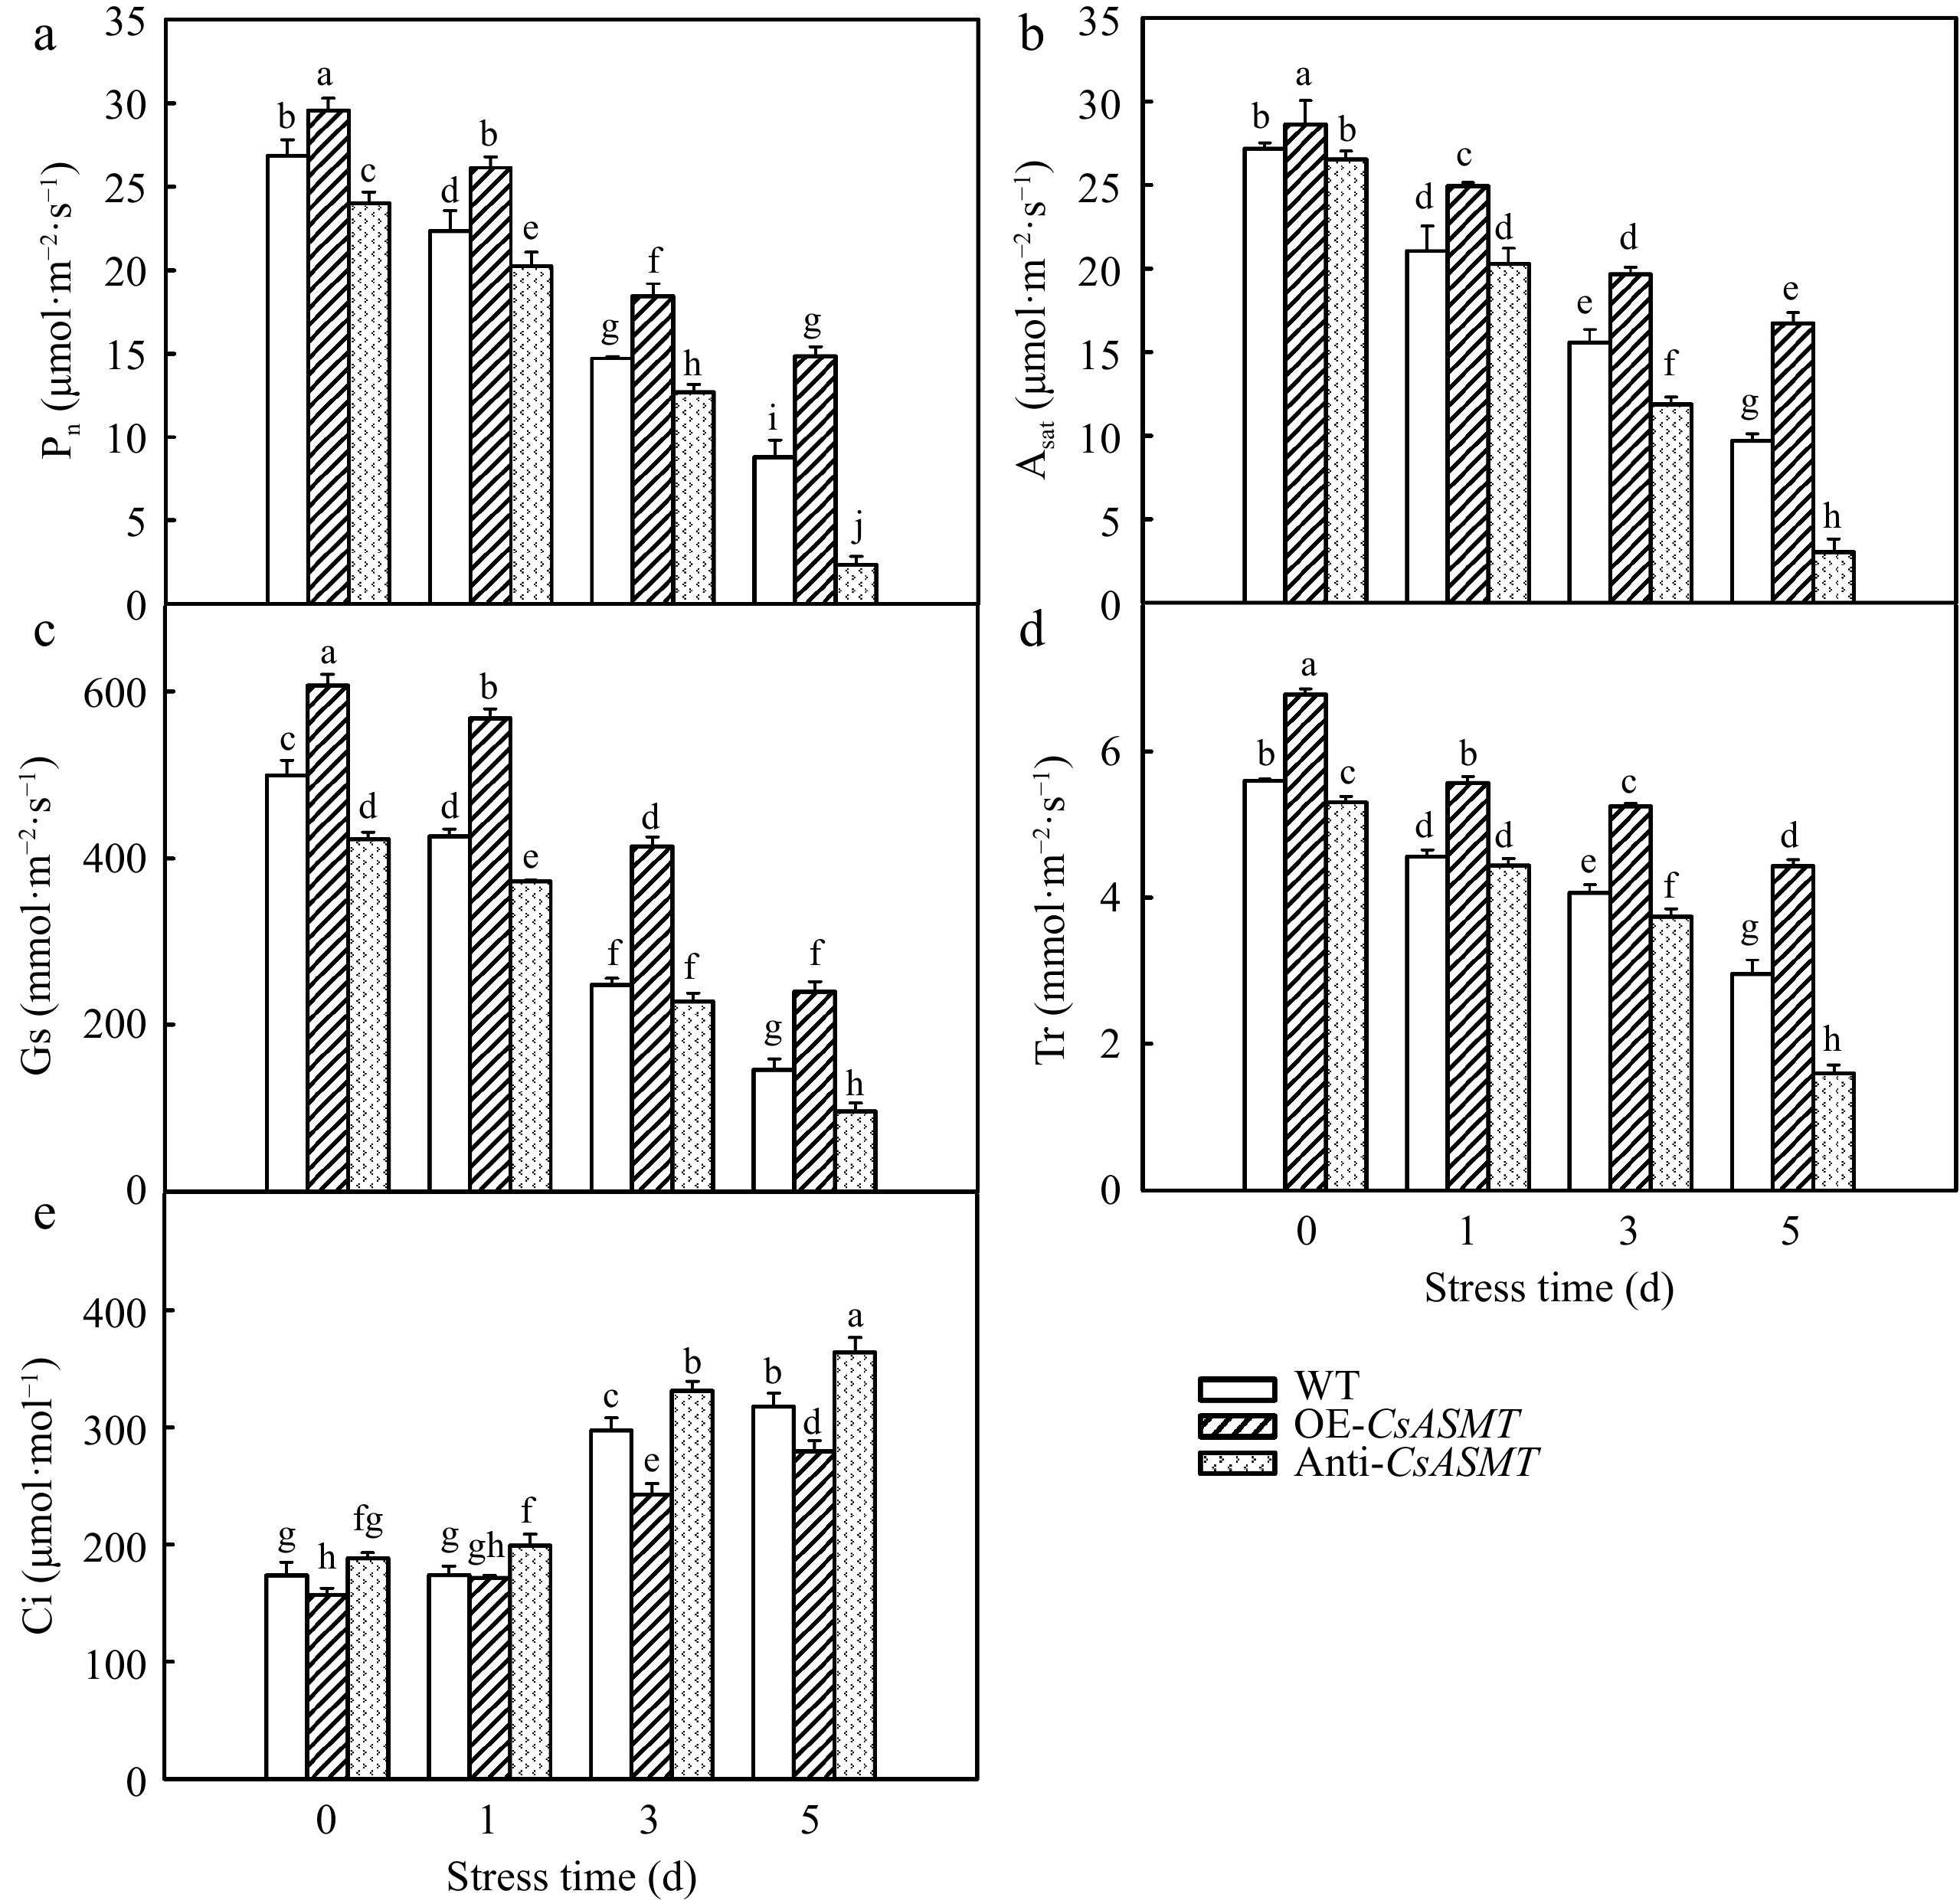
Figure 4.
The effect of CsASMT overexpression and inhibition on photosynthesis of cucumber seedlings under high temperature stress. (a) Pn; (b) Asat; (c) Gs; (d) Tr; (e) Ci. The two-leaf-stage cucumber seedlings were treated at 42/35 °C for 5 d. All values shown are the mean ± SD (n = 3). Lowercase letters a–j indicate that mean values are significantly different among treatments (p < 0.05).
-
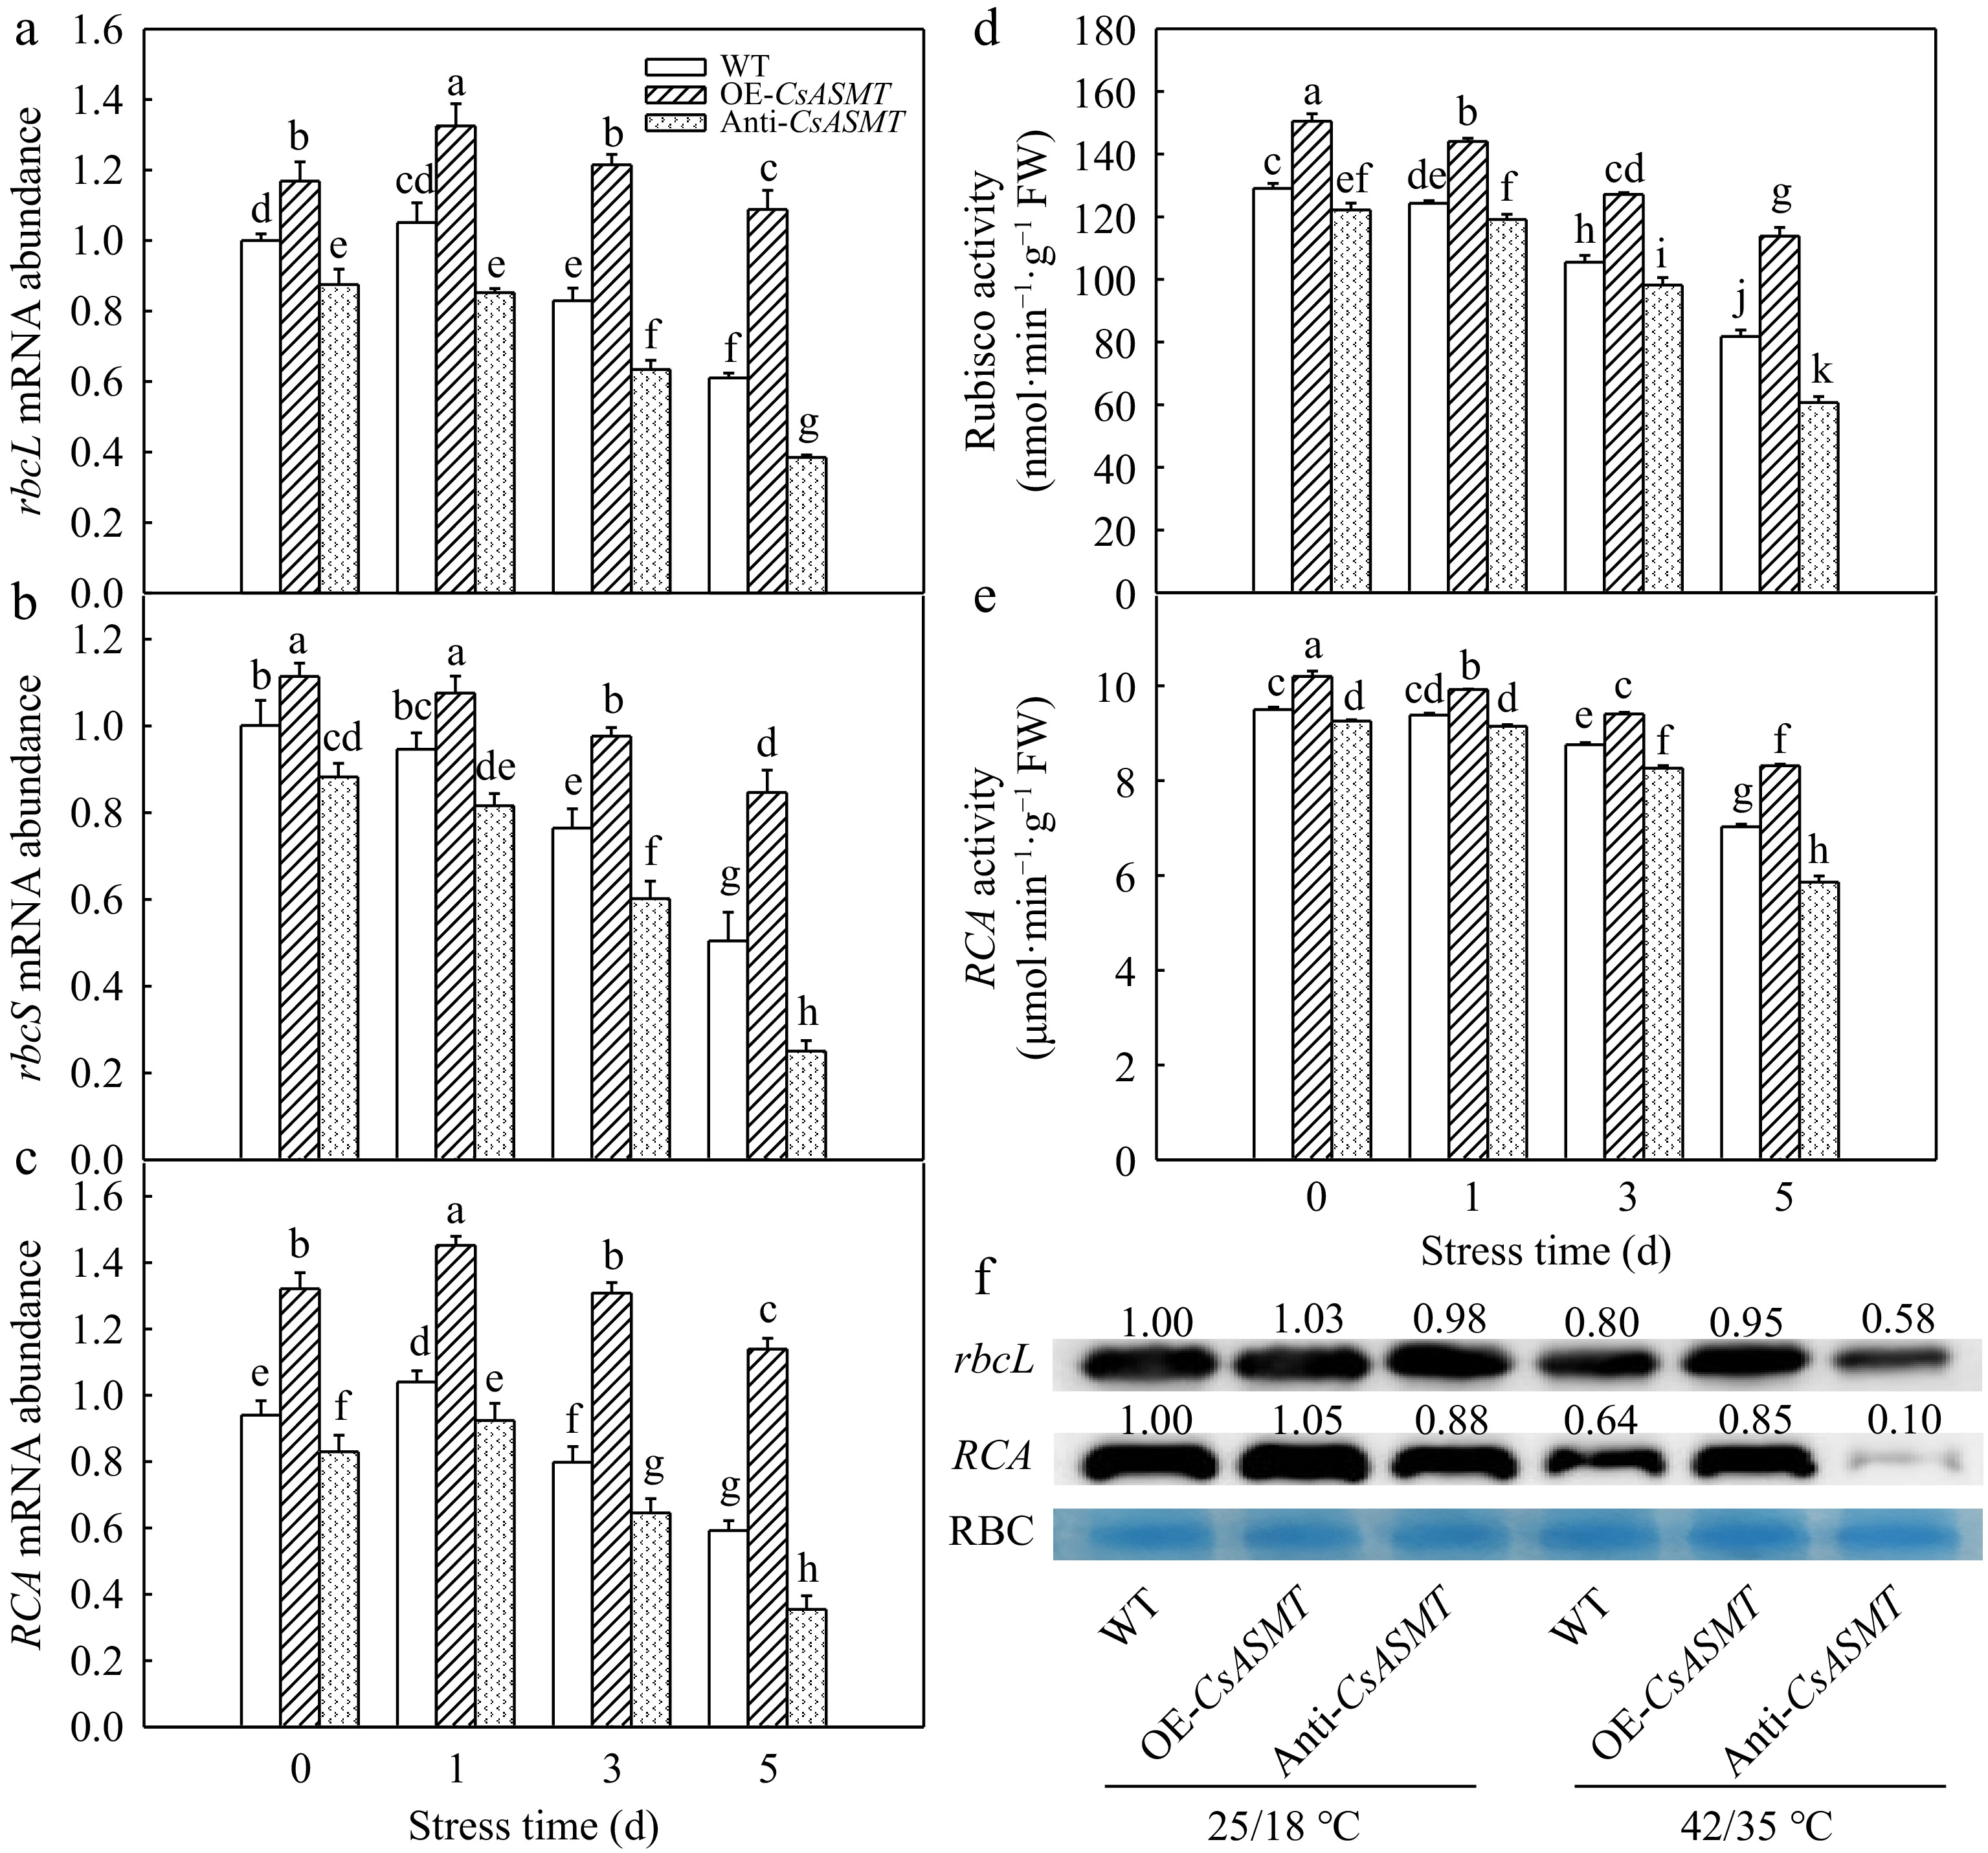
Figure 5.
The effect of CsASMT overexpression and inhibition on the activity and expression of photosynthetic enzymes in cucumber seedlings under high temperature stress. (a)–(c) rbcL, rbcS, and RCA mRNA abundance. (d), (e) Activities of Rubisco and RCA. (f) The protein level of rbcL and RCA. The two-leaf-stage cucumber seedlings were treated at 42/35 °C for 5 d, the samples were taken at 0, 1, 3, and 5 d after high temperature treatment. All values shown are the mean ± SD (n = 3). Lowercase letters a–k indicate that mean values are significantly different among samples (p < 0.05).
-
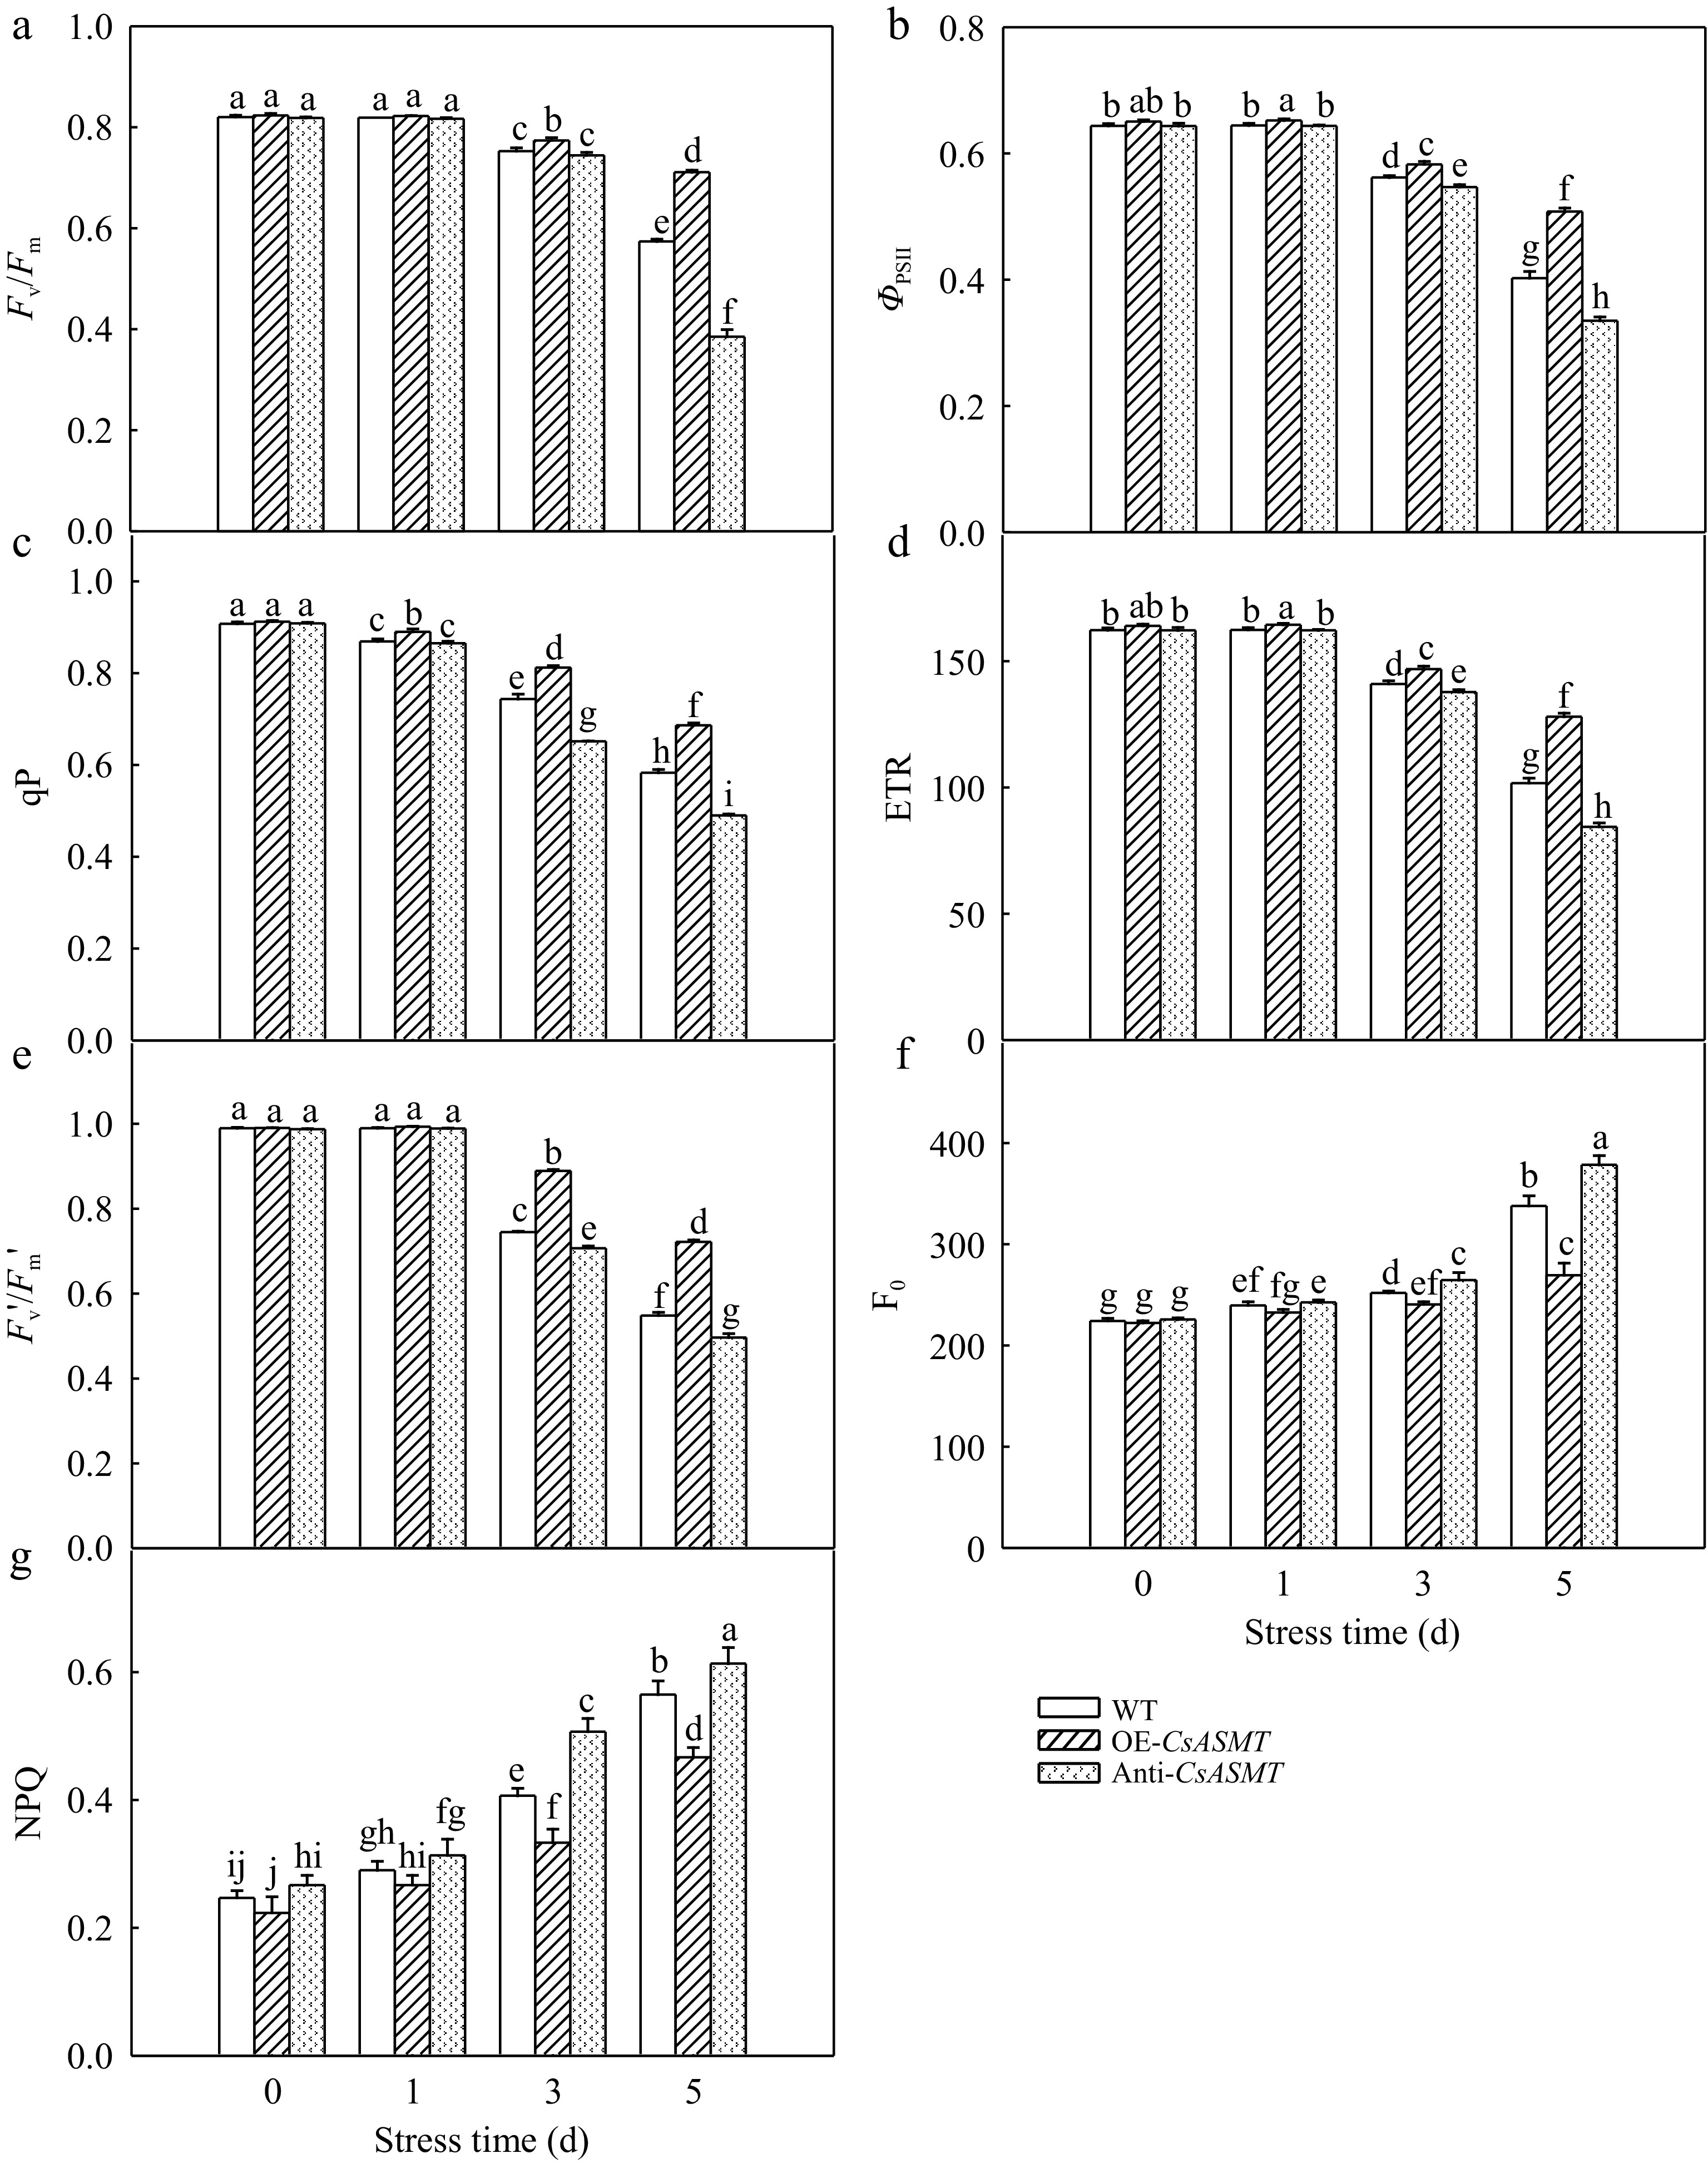
Figure 6.
The effect of CsASMT overexpression and inhibition on chlorophyll fluorescence parameters of cucumber seedlings under high temperature stress. (a) Fv/Fm; (b) ΦPSII; (c) qP; (d) ETR; (e) Fv'/Fm'; (f) F0; (g) NPQ. The two-leaf-stage cucumber seedlings were treated at 42/35 °C for 5 d. All values shown are the mean ± SD (n = 3). Lowercase letters a–j indicate that mean values are significantly different among treatments (p < 0.05).
-
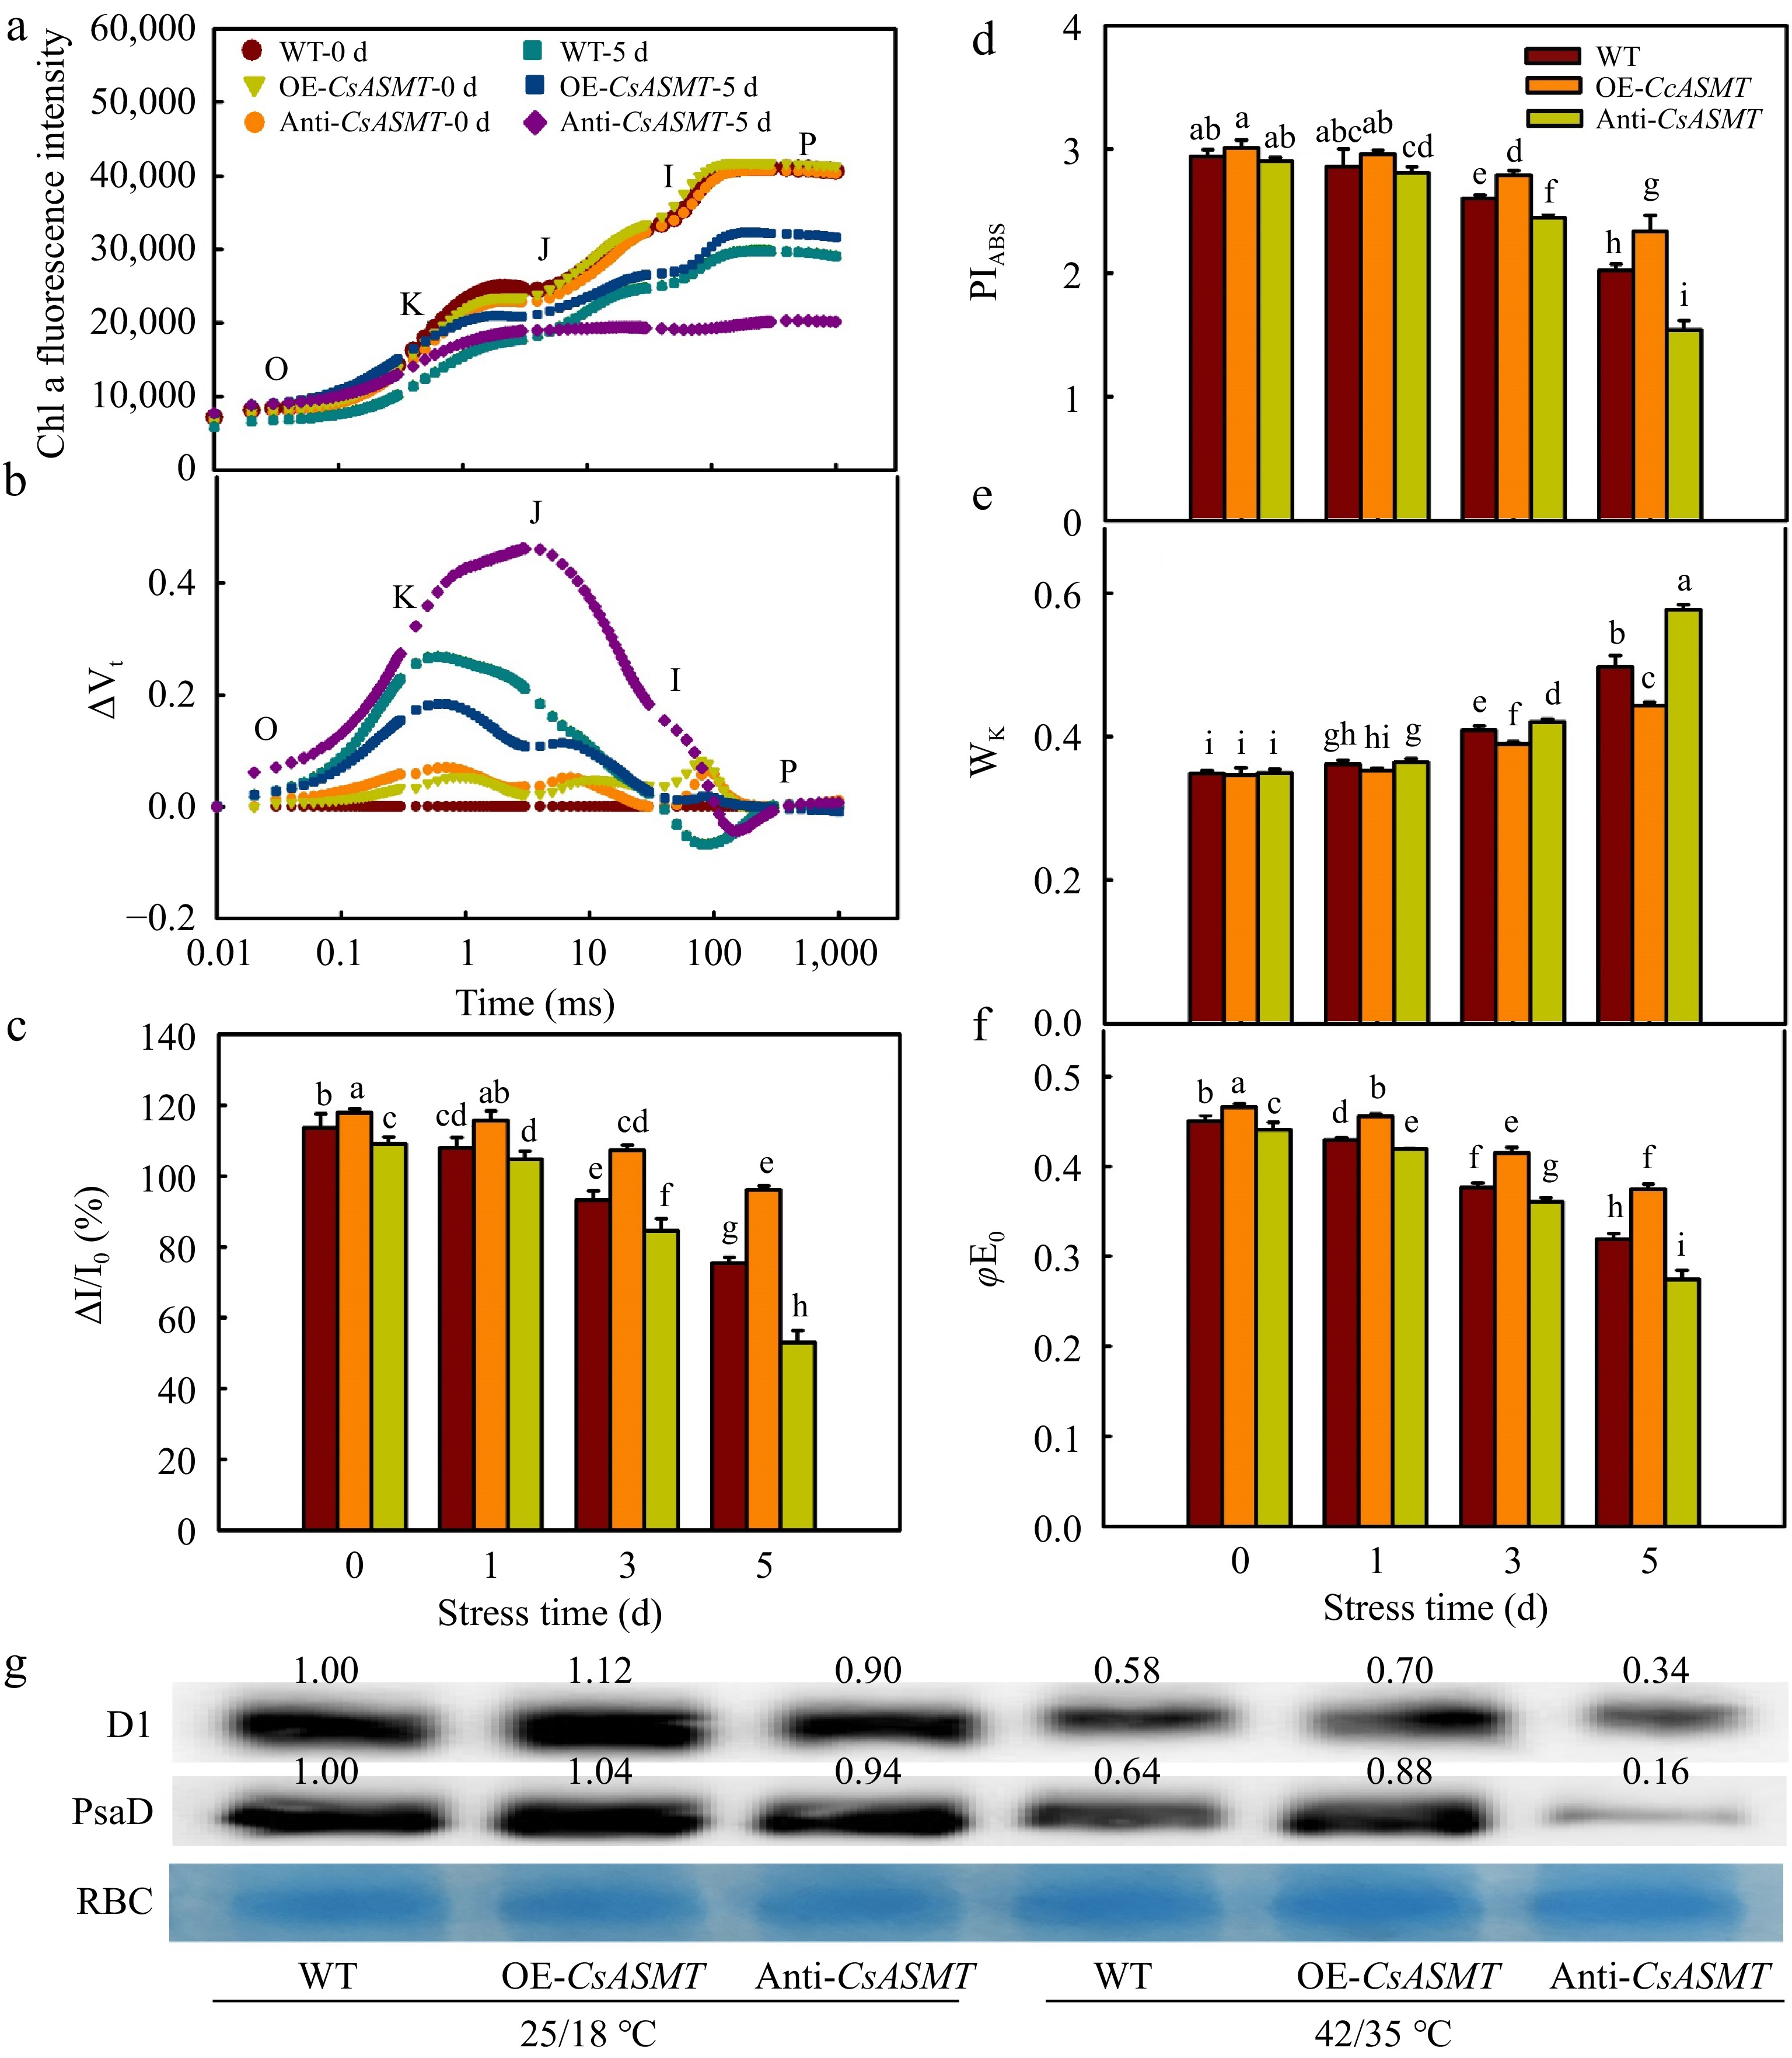
Figure 7.
The effect of CsASMT overexpression and inhibition on the activities of PSII and PSI in cucumber seedlings under high temperature stress. (a) Chl a fluorescence intensity; (b) ΔVt; (c) ΔI/I0; (d) PIABS; (e) Wk; (f) φEo; (g) The protein level of D1 and PsaD. The two-leaf-stage cucumber seedlings were treated at 42/35 °C for 5 d, the samples for protein level analysis were taken at 0, 1, 3, and 5 d after high temperature treatment. All values shown are the mean ± SD (n = 3). Lowercase letters a–i indicate that mean values are significantly different among samples (p < 0.05).
-
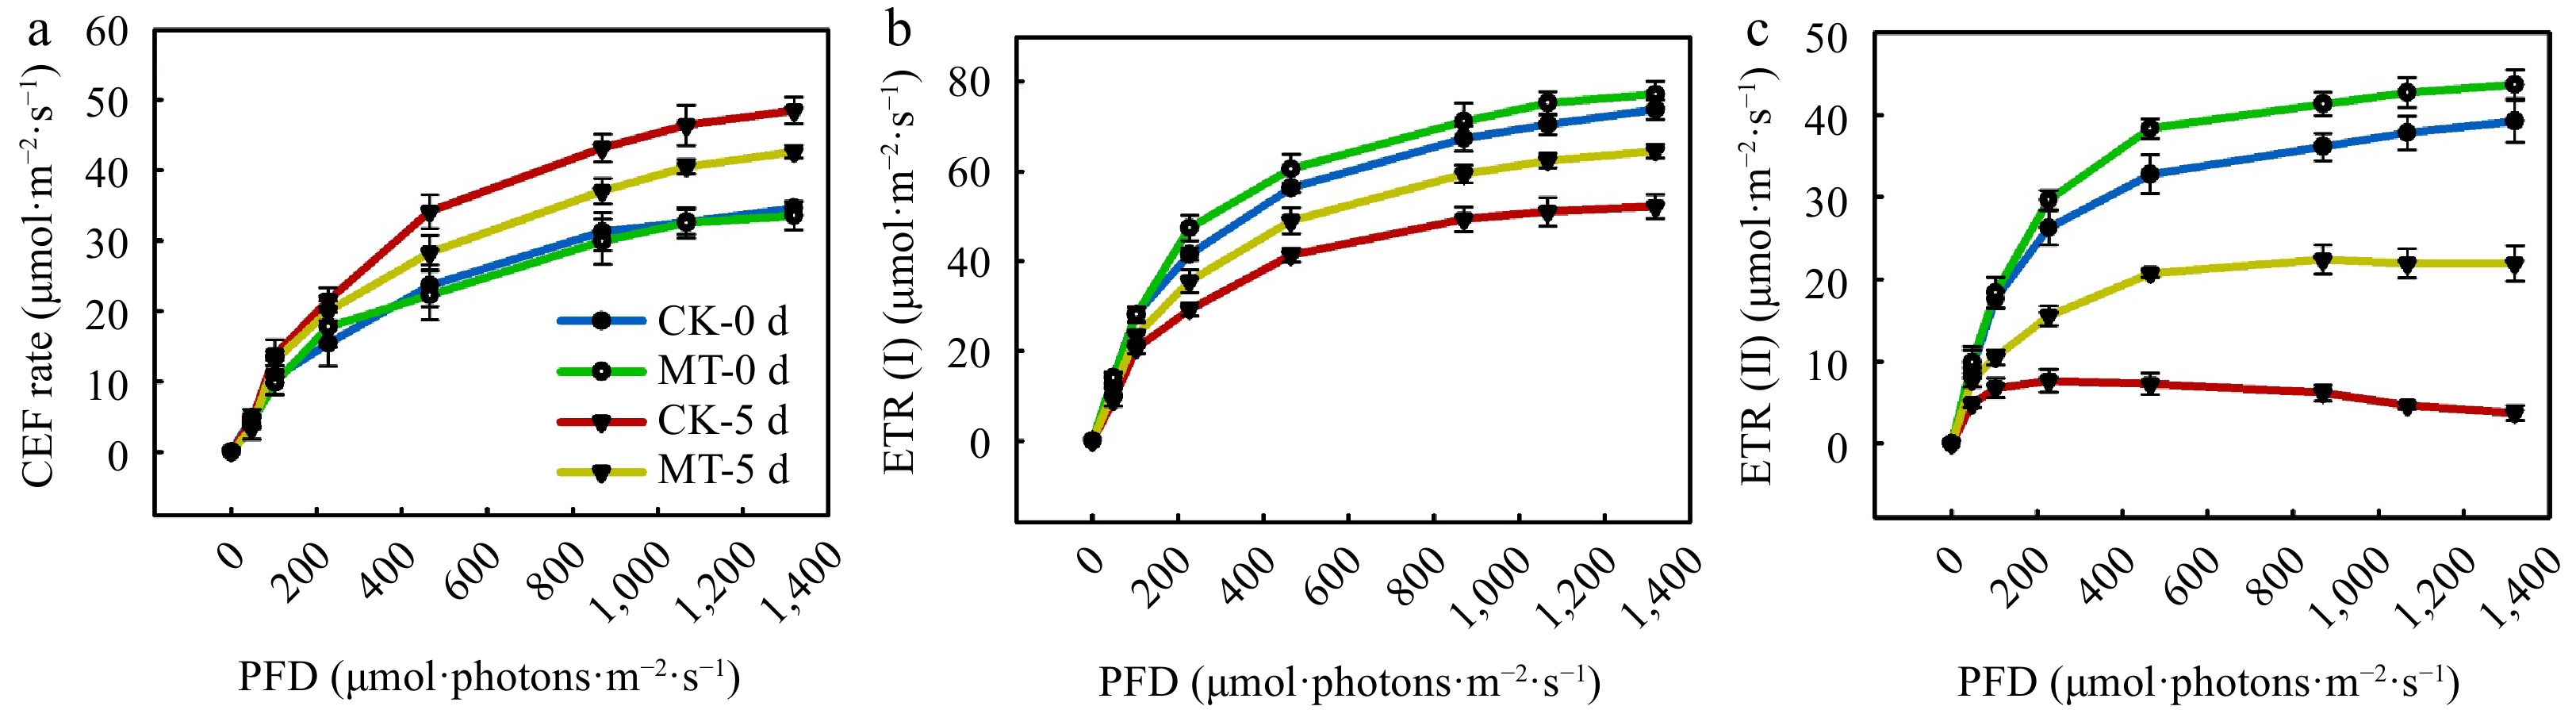
Figure 8.
The effect of MT on CEF in cucumber seedlings under high temperature stress. (a) CEF rate; (b) ETR (I); (c) ETR (II). The two-leaf-stage cucumber seedlings were treated at 42/35 °C after 5 d. All values shown are the mean ± SD (n = 3).
-

Figure 9.
The effect of CsPGR5 inhibition on the gas exchange parameters of cucumber seedlings under high temperature stress. (a) Pn; (b) Gs; (c) Tr; (d) Ci. The two-leaf-stage cucumber seedlings were treated at 42/35 °C for 5 d. All values shown are the mean ± SD (n = 3). Lowercase letters a–g indicate that mean values are significantly different among samples (p < 0.05).
-
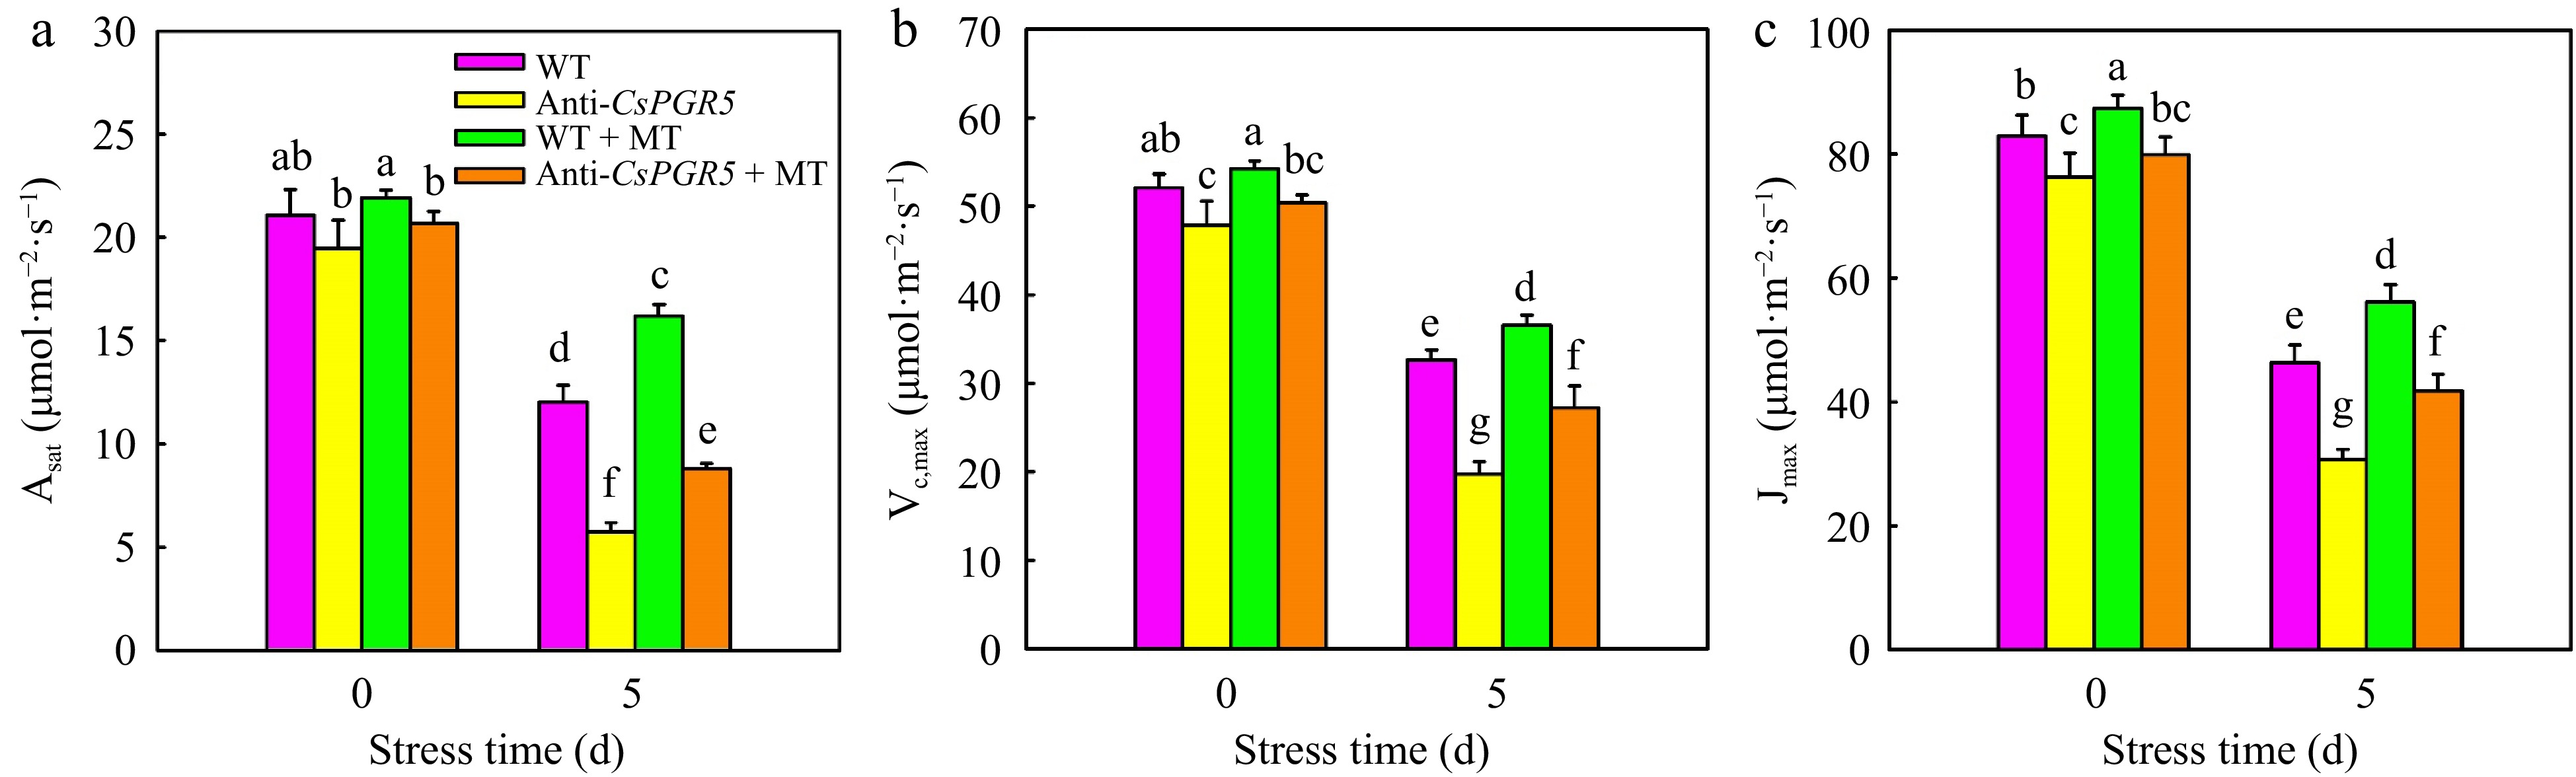
Figure 10.
The effect of CsPGR5 inhibition on Asat, Vc,max, Jmax of cucumber seedlings under high temperature stress. (a) Asat; (b) Vc,max; (c) Jmax. The two-leaf-stage cucumber seedlings were treated at 42/35 °C for 5 d. All values shown are the mean ± SD (n = 3). Lowercase letters a–g indicate that mean values are significantly different among samples (p < 0.05).
-
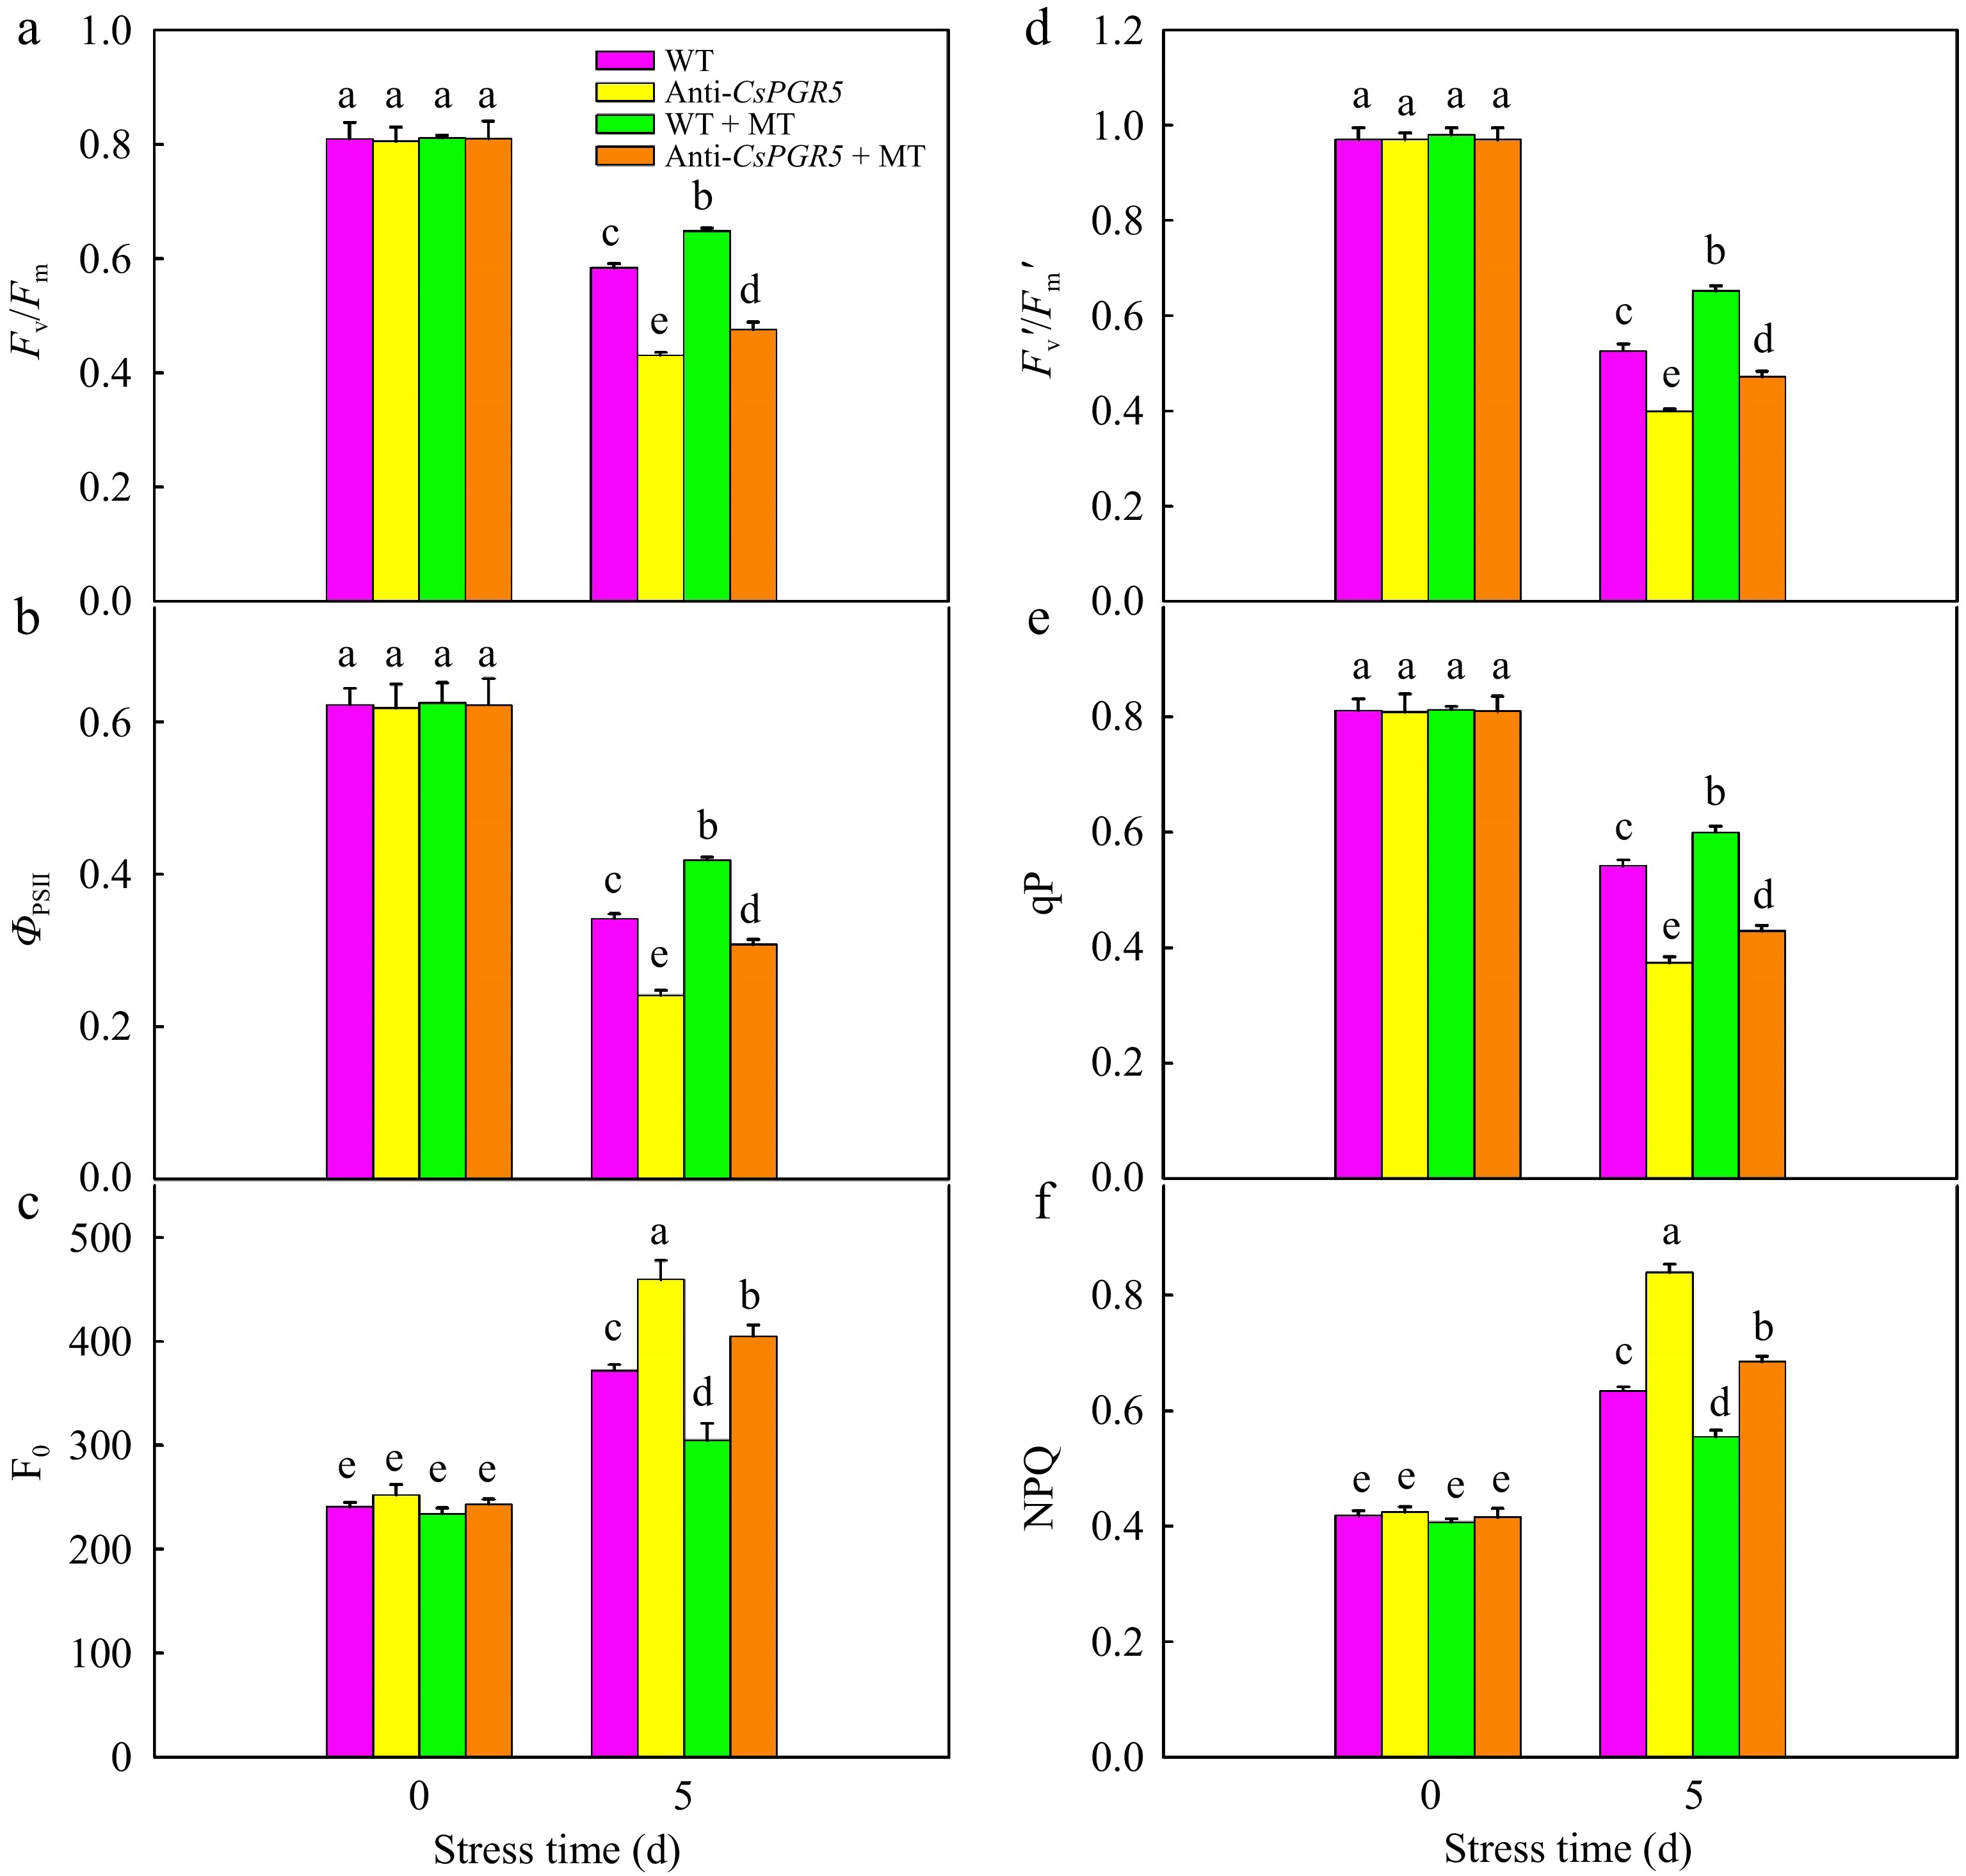
Figure 11.
The effect of CsPGR5 inhibition on chlorophyll fluorescence parameters of cucumber seedlings under high temperature stress. (a) Fv/Fm; (b) ΦPSII; (c) F0; (d) Fv'/Fm'; (e) qP; (f) NPQ. The two-leaf-stage cucumber seedlings were treated at 42/35 °C for 5 d. All values shown are the mean ± SD (n = 3). Lowercase letters a–e indicate that mean values are significantly different among samples (p < 0.05).
-
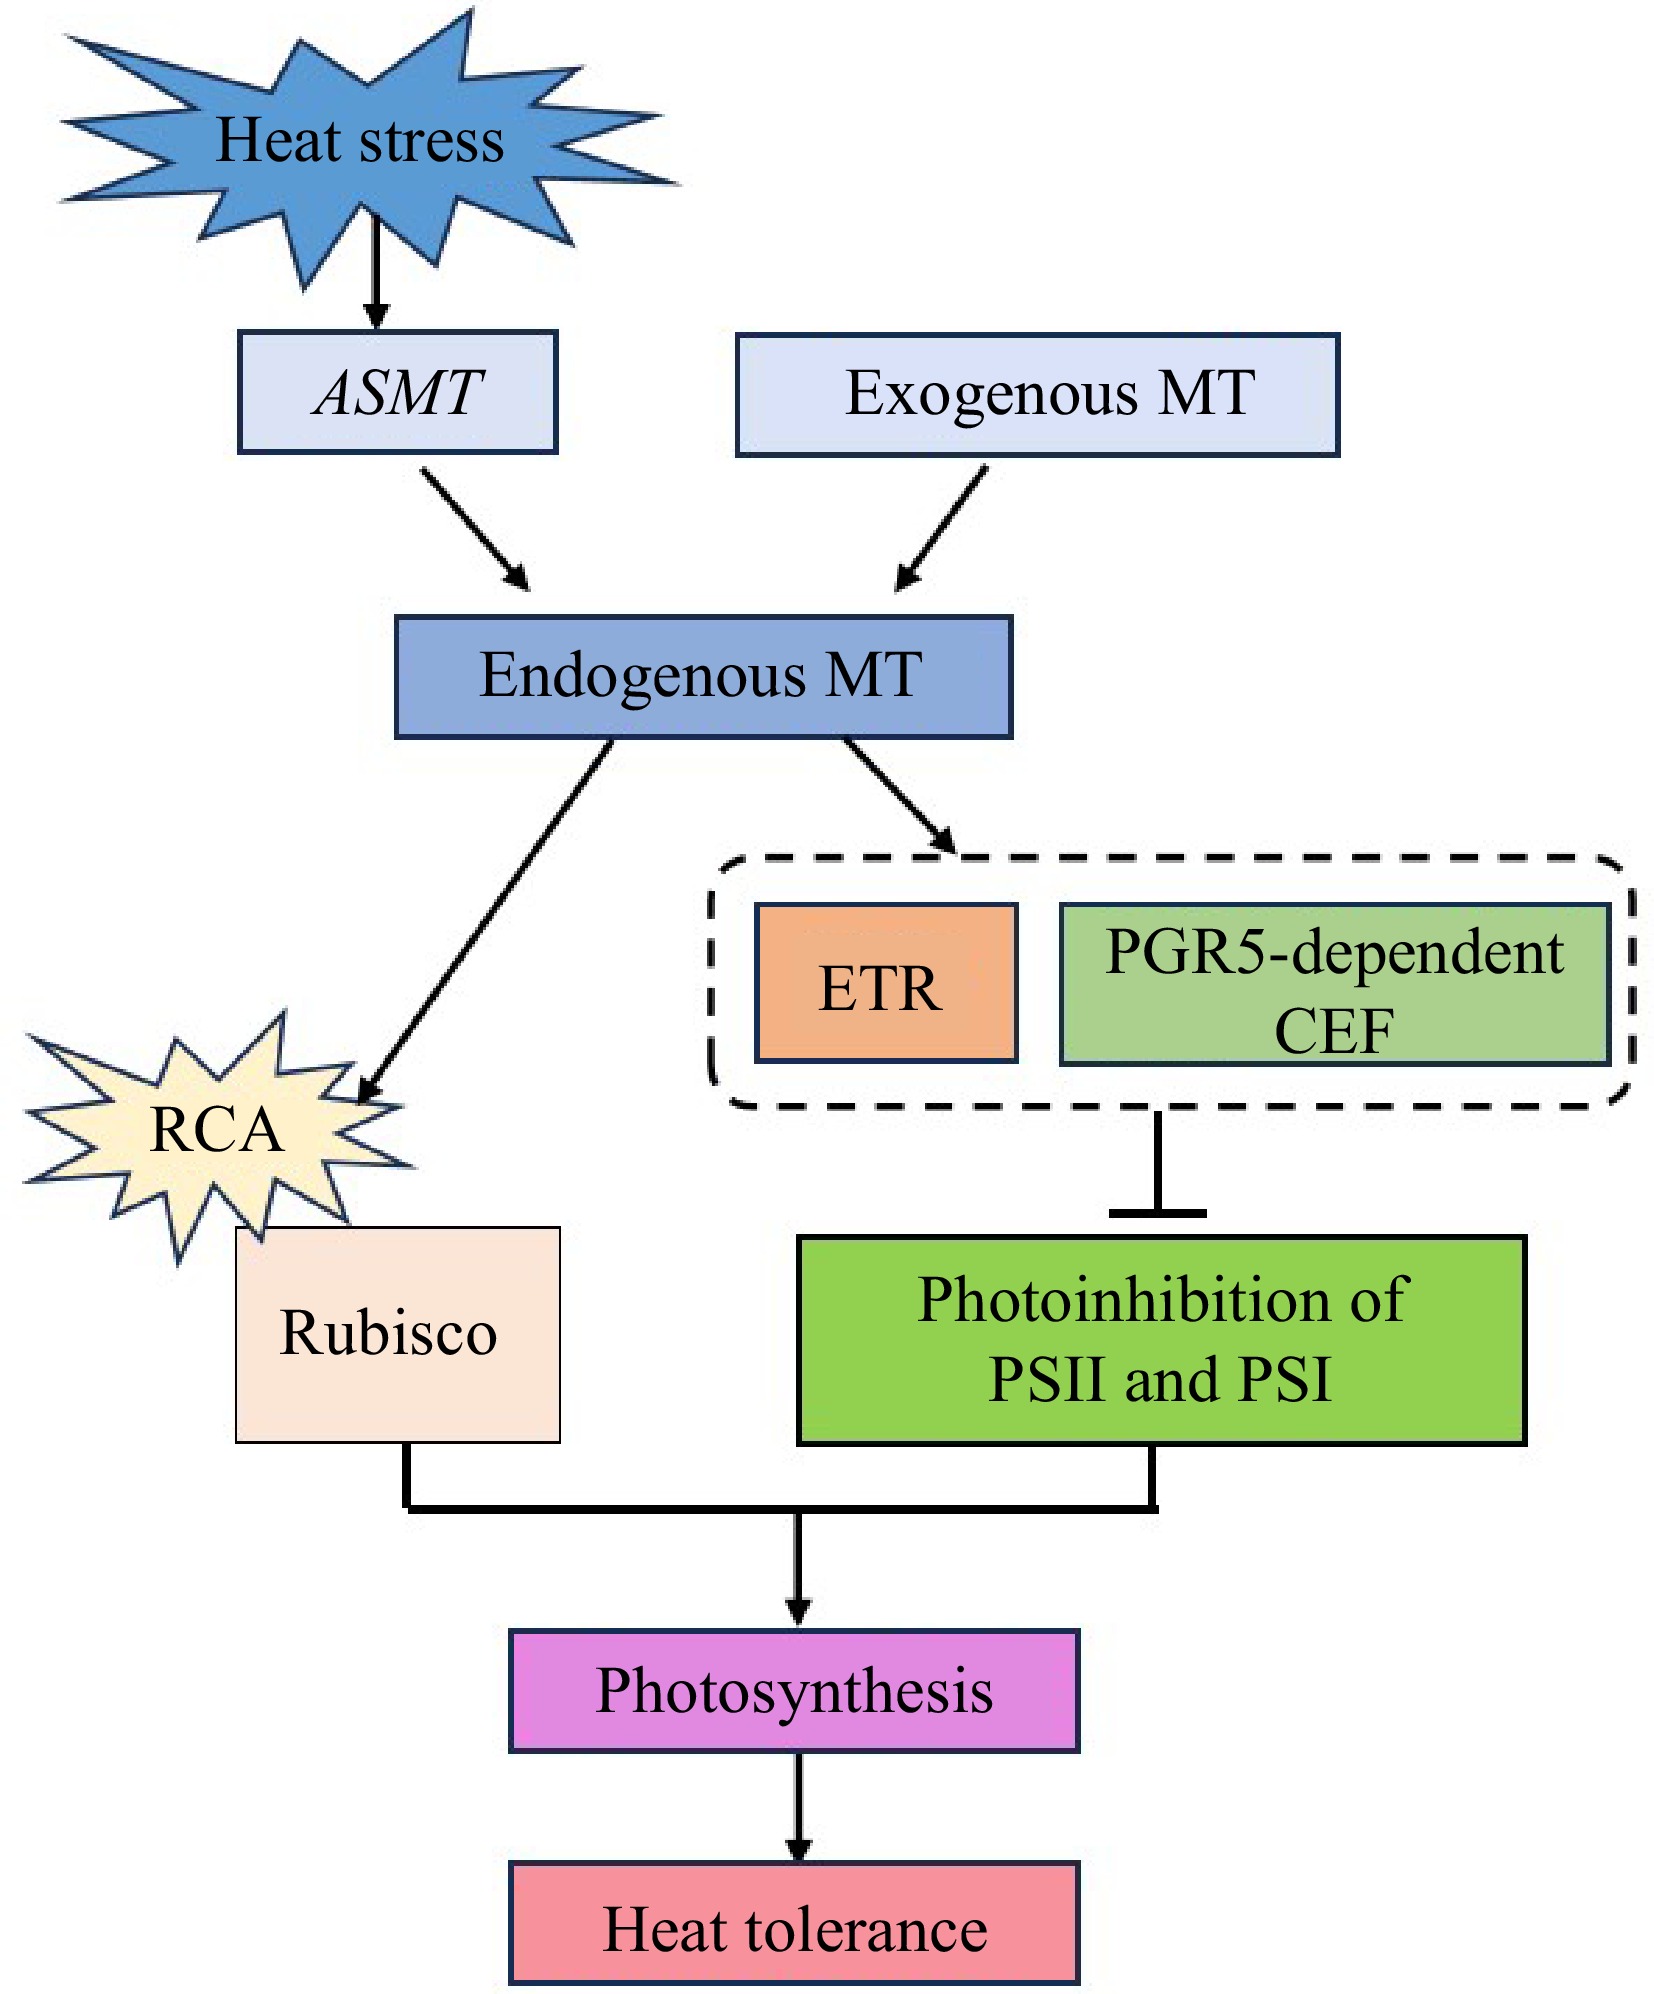
Figure 12.
A model of MT-enhanced photosynthesis of cucumber seedlings in response to heat stress.
Figures
(12)
Tables
(0)