-
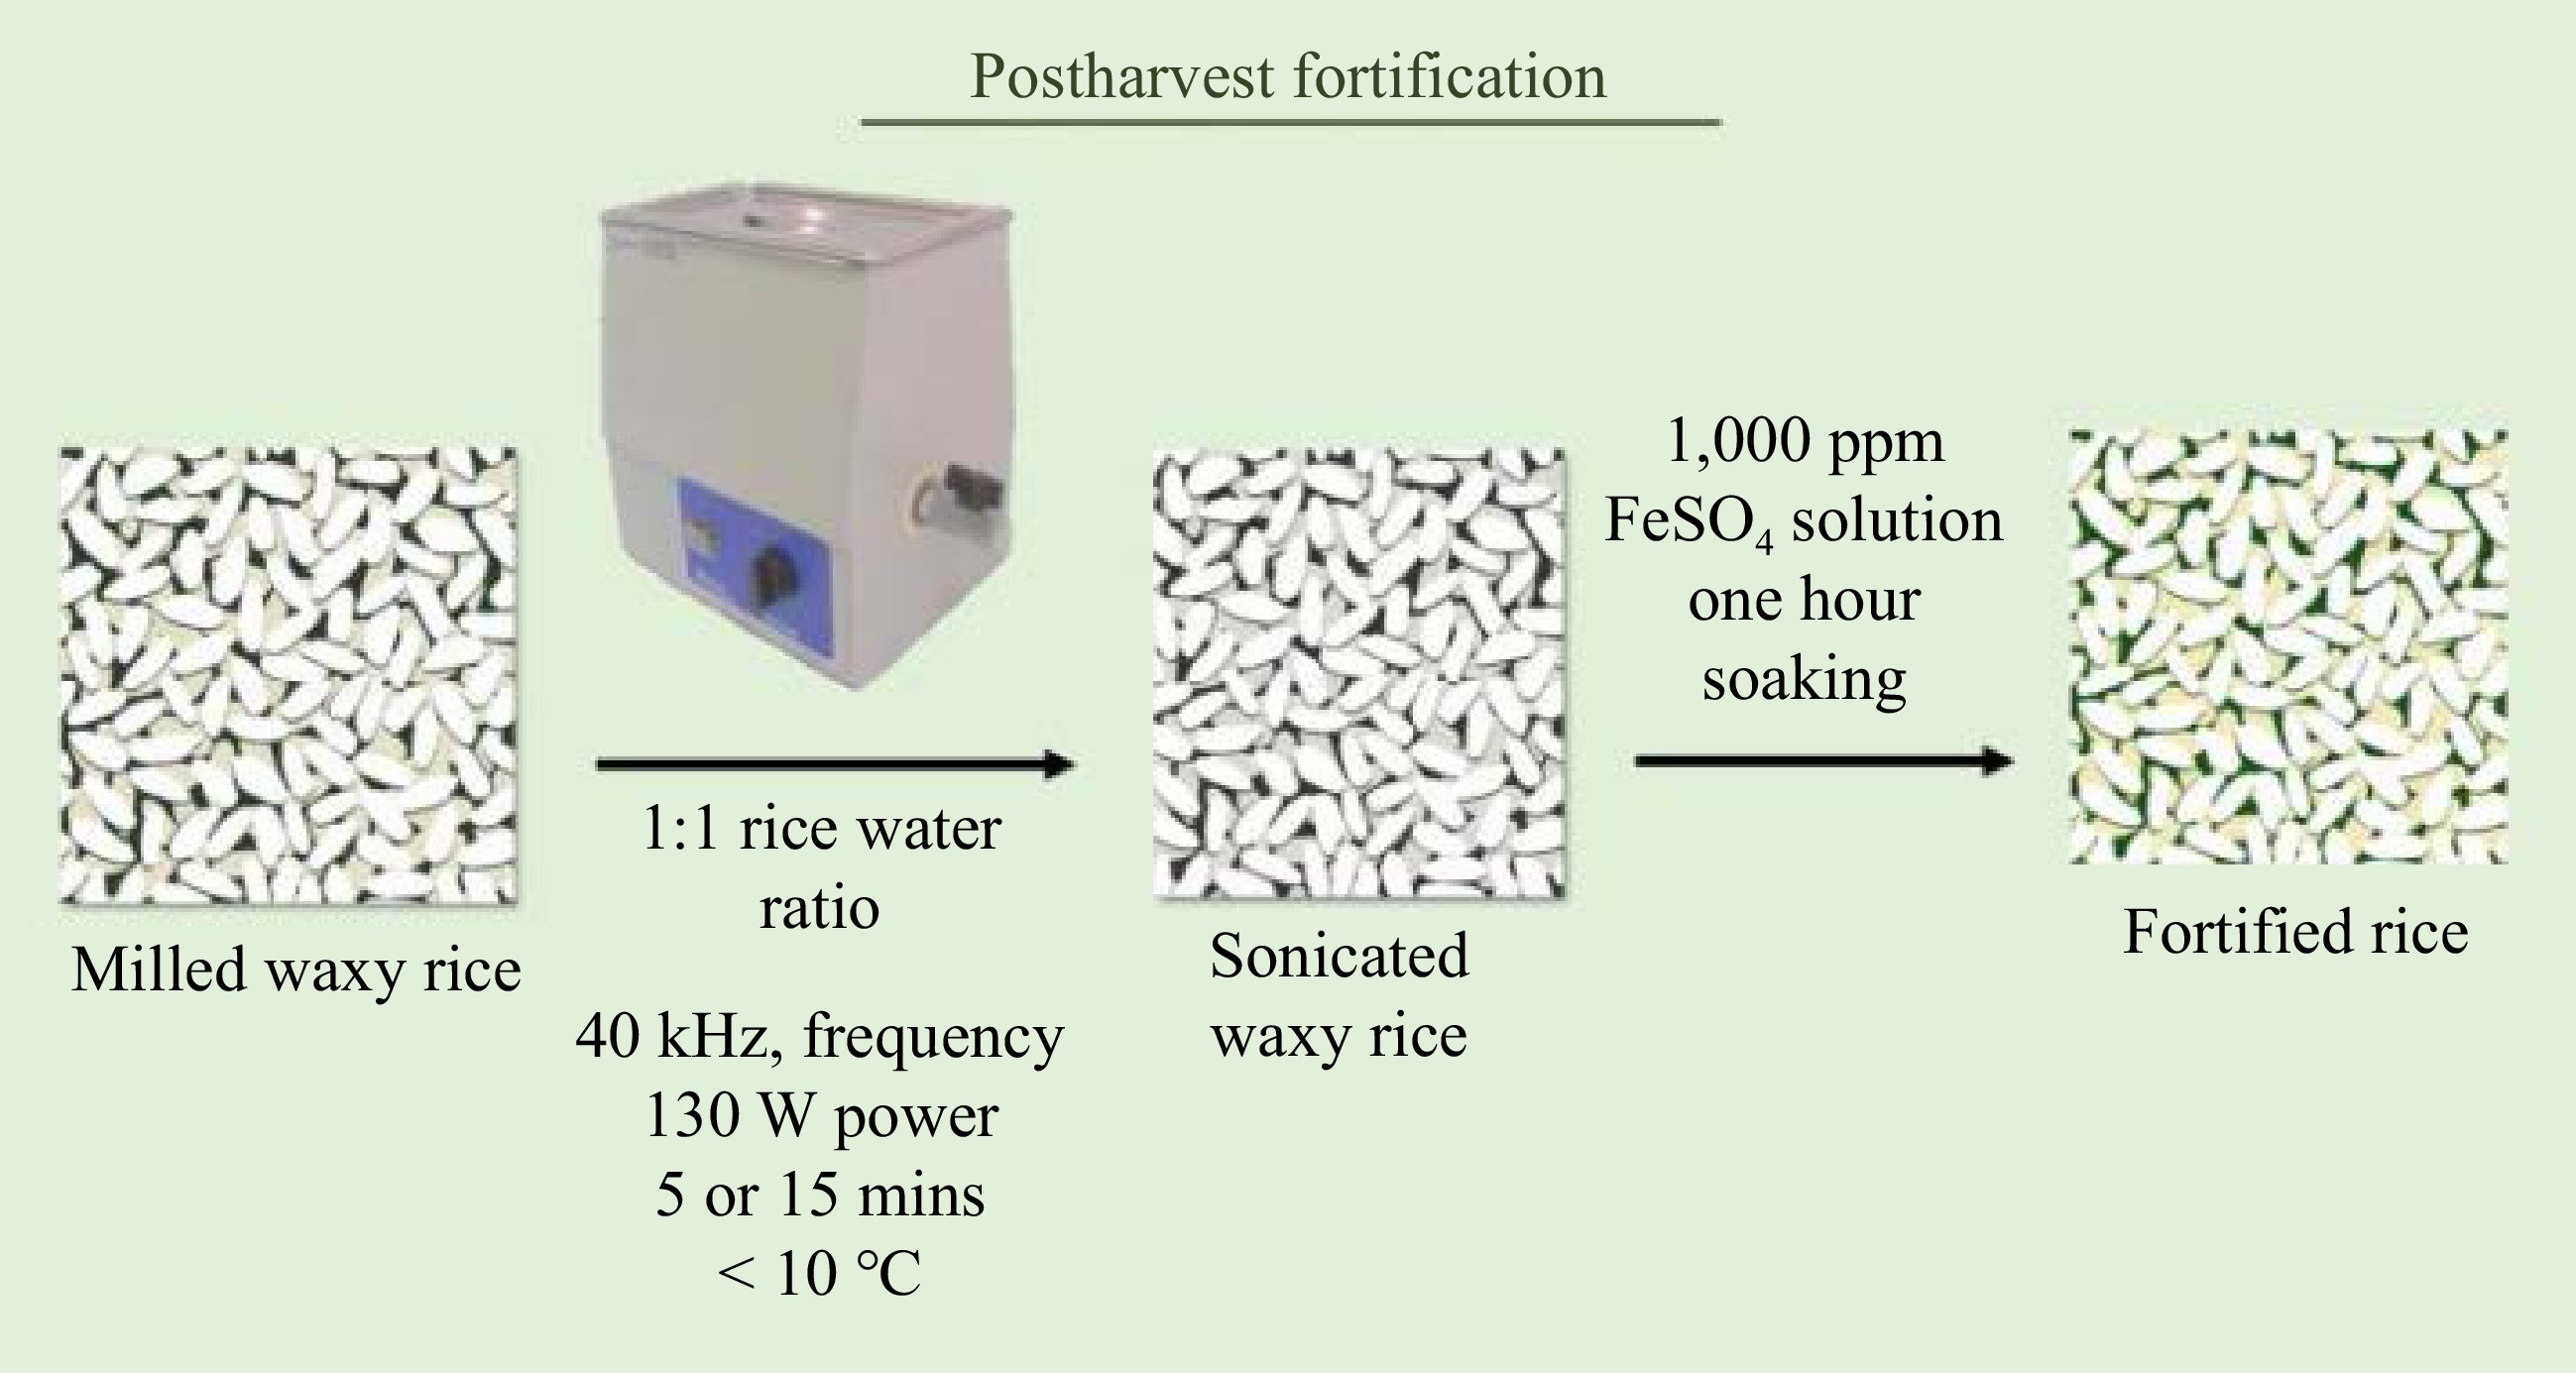
Figure 1.
Postharvest iron fortification of waxy rice using ultrasonic treatment.
-
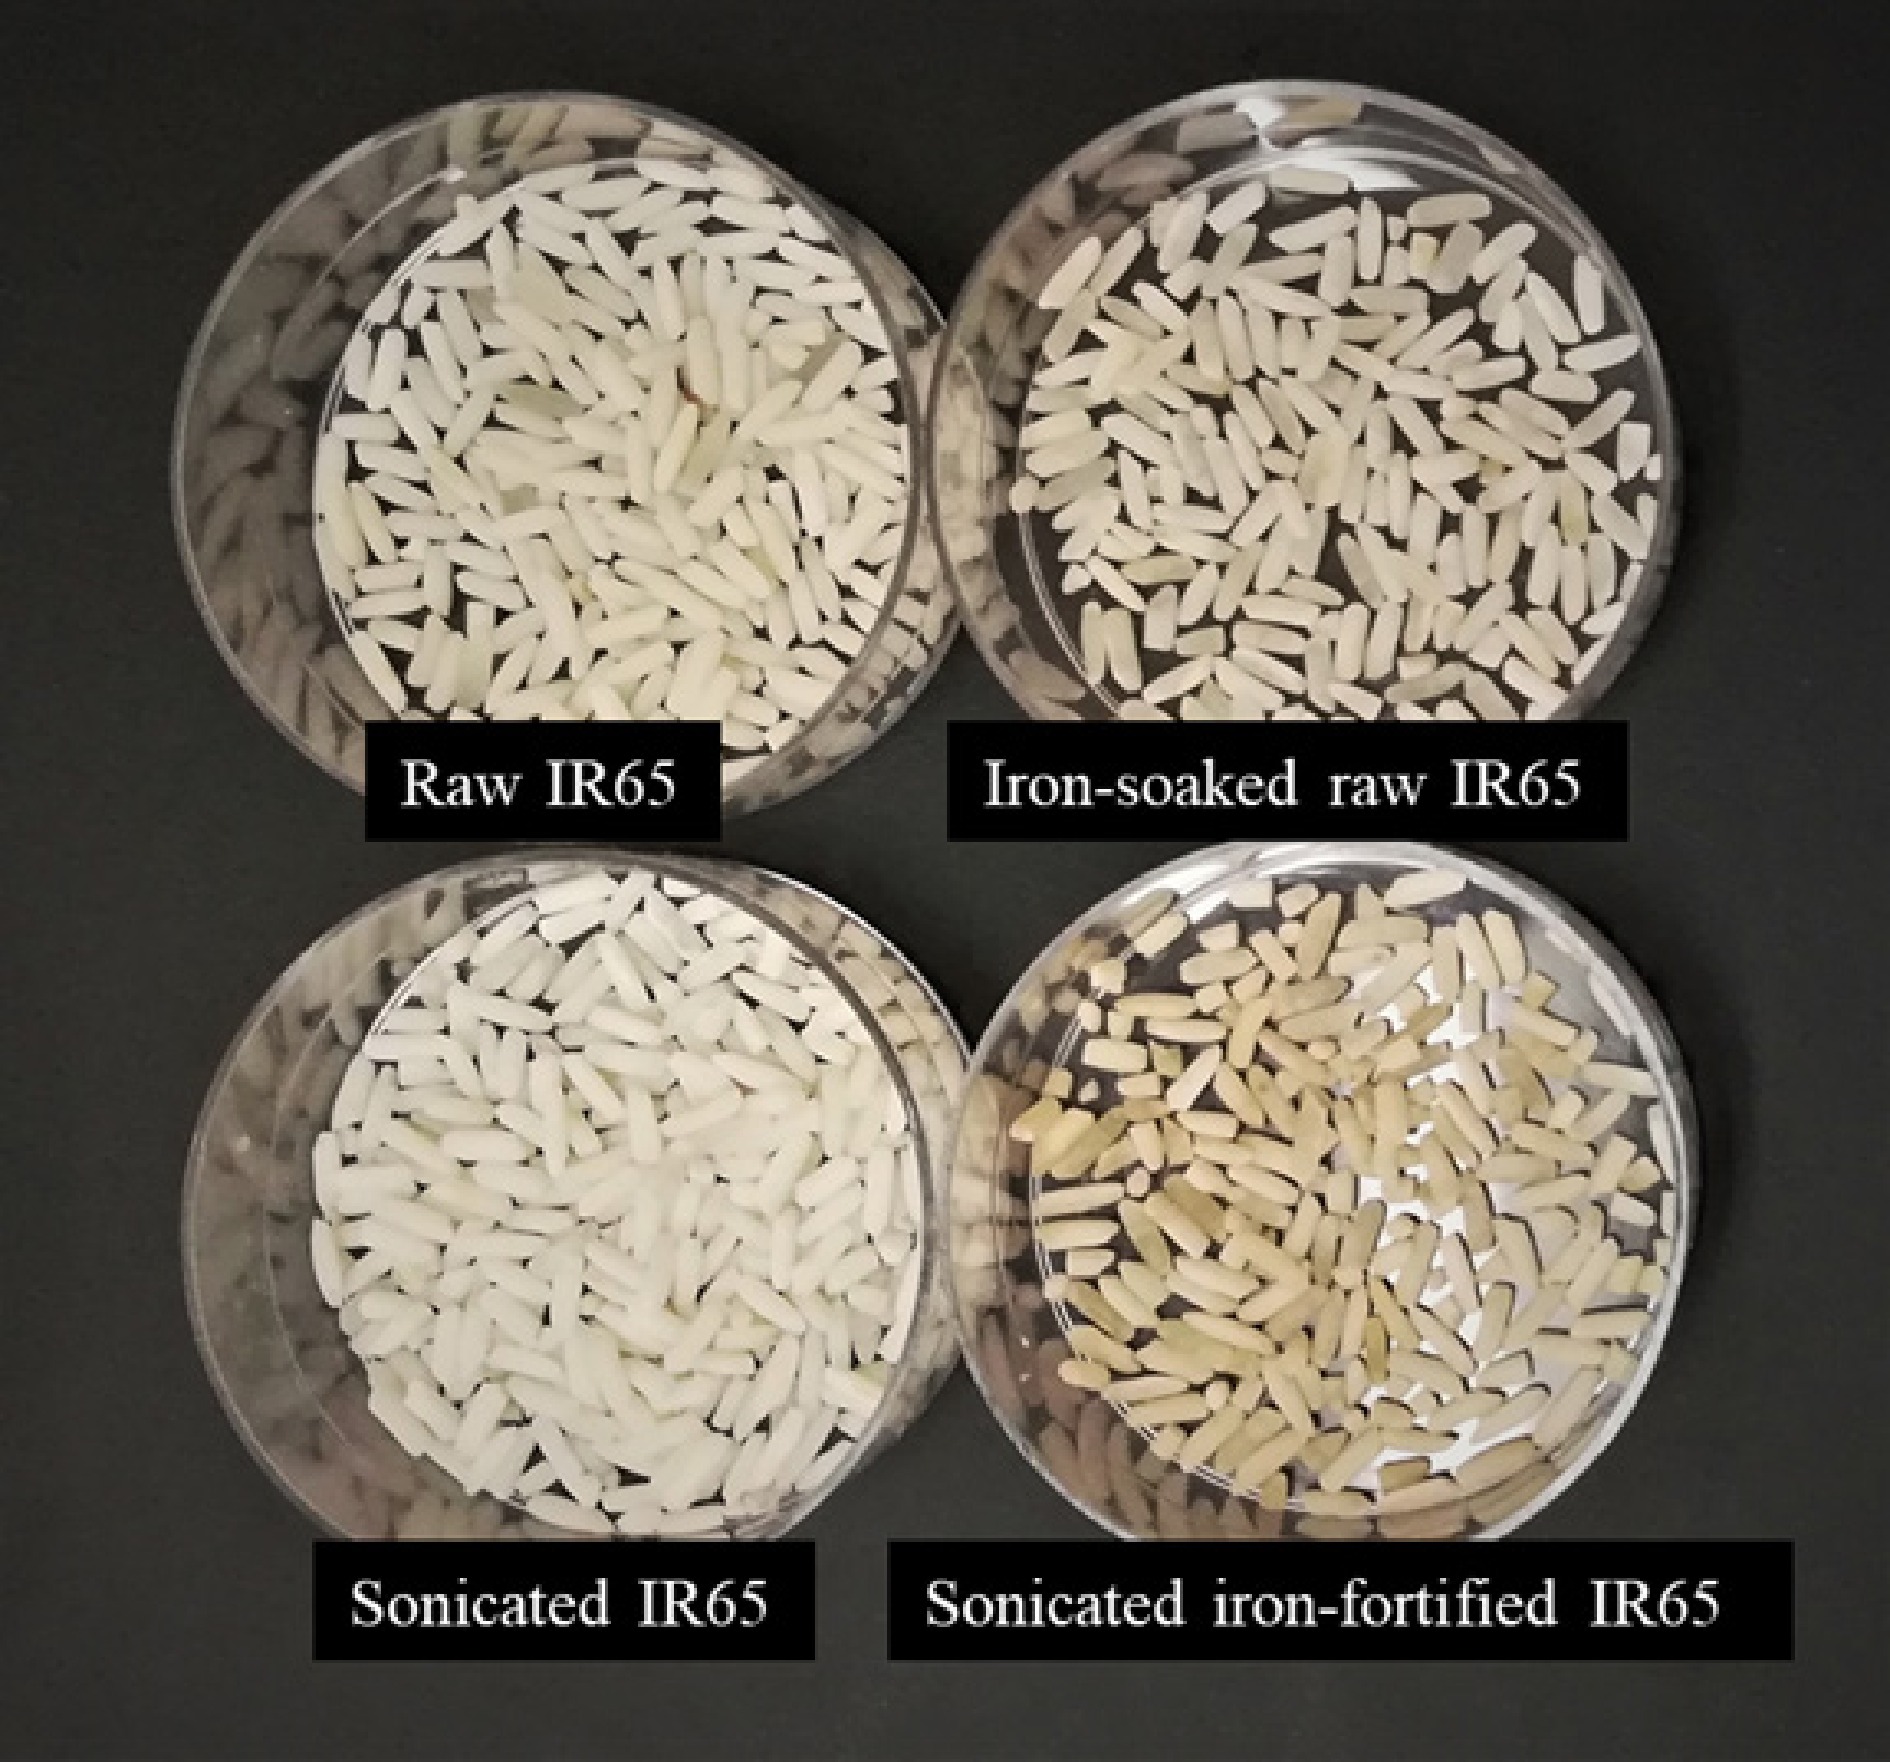
Figure 2.
Photographs of raw, sonicated, and iron-soaked (non-sonicated and sonicated) IR65 rice.
-
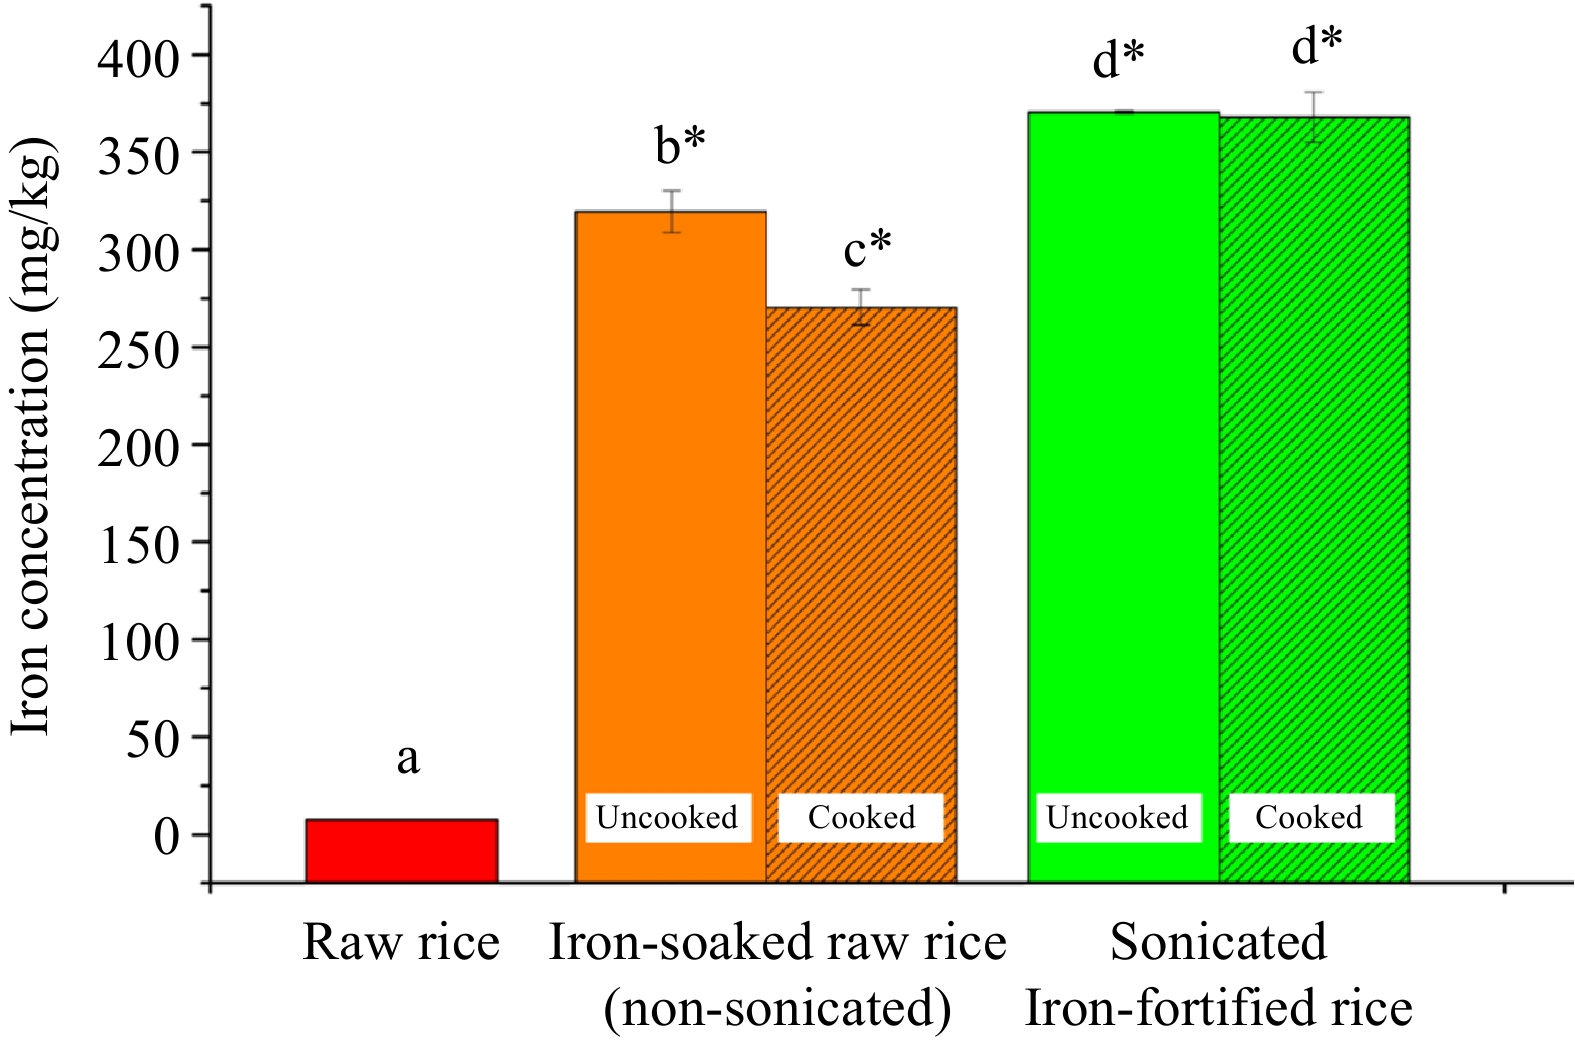
Figure 3.
Iron content of uncooked and cooked fortified rice. Values with different letters are significantly different (* p < 0.01).
-
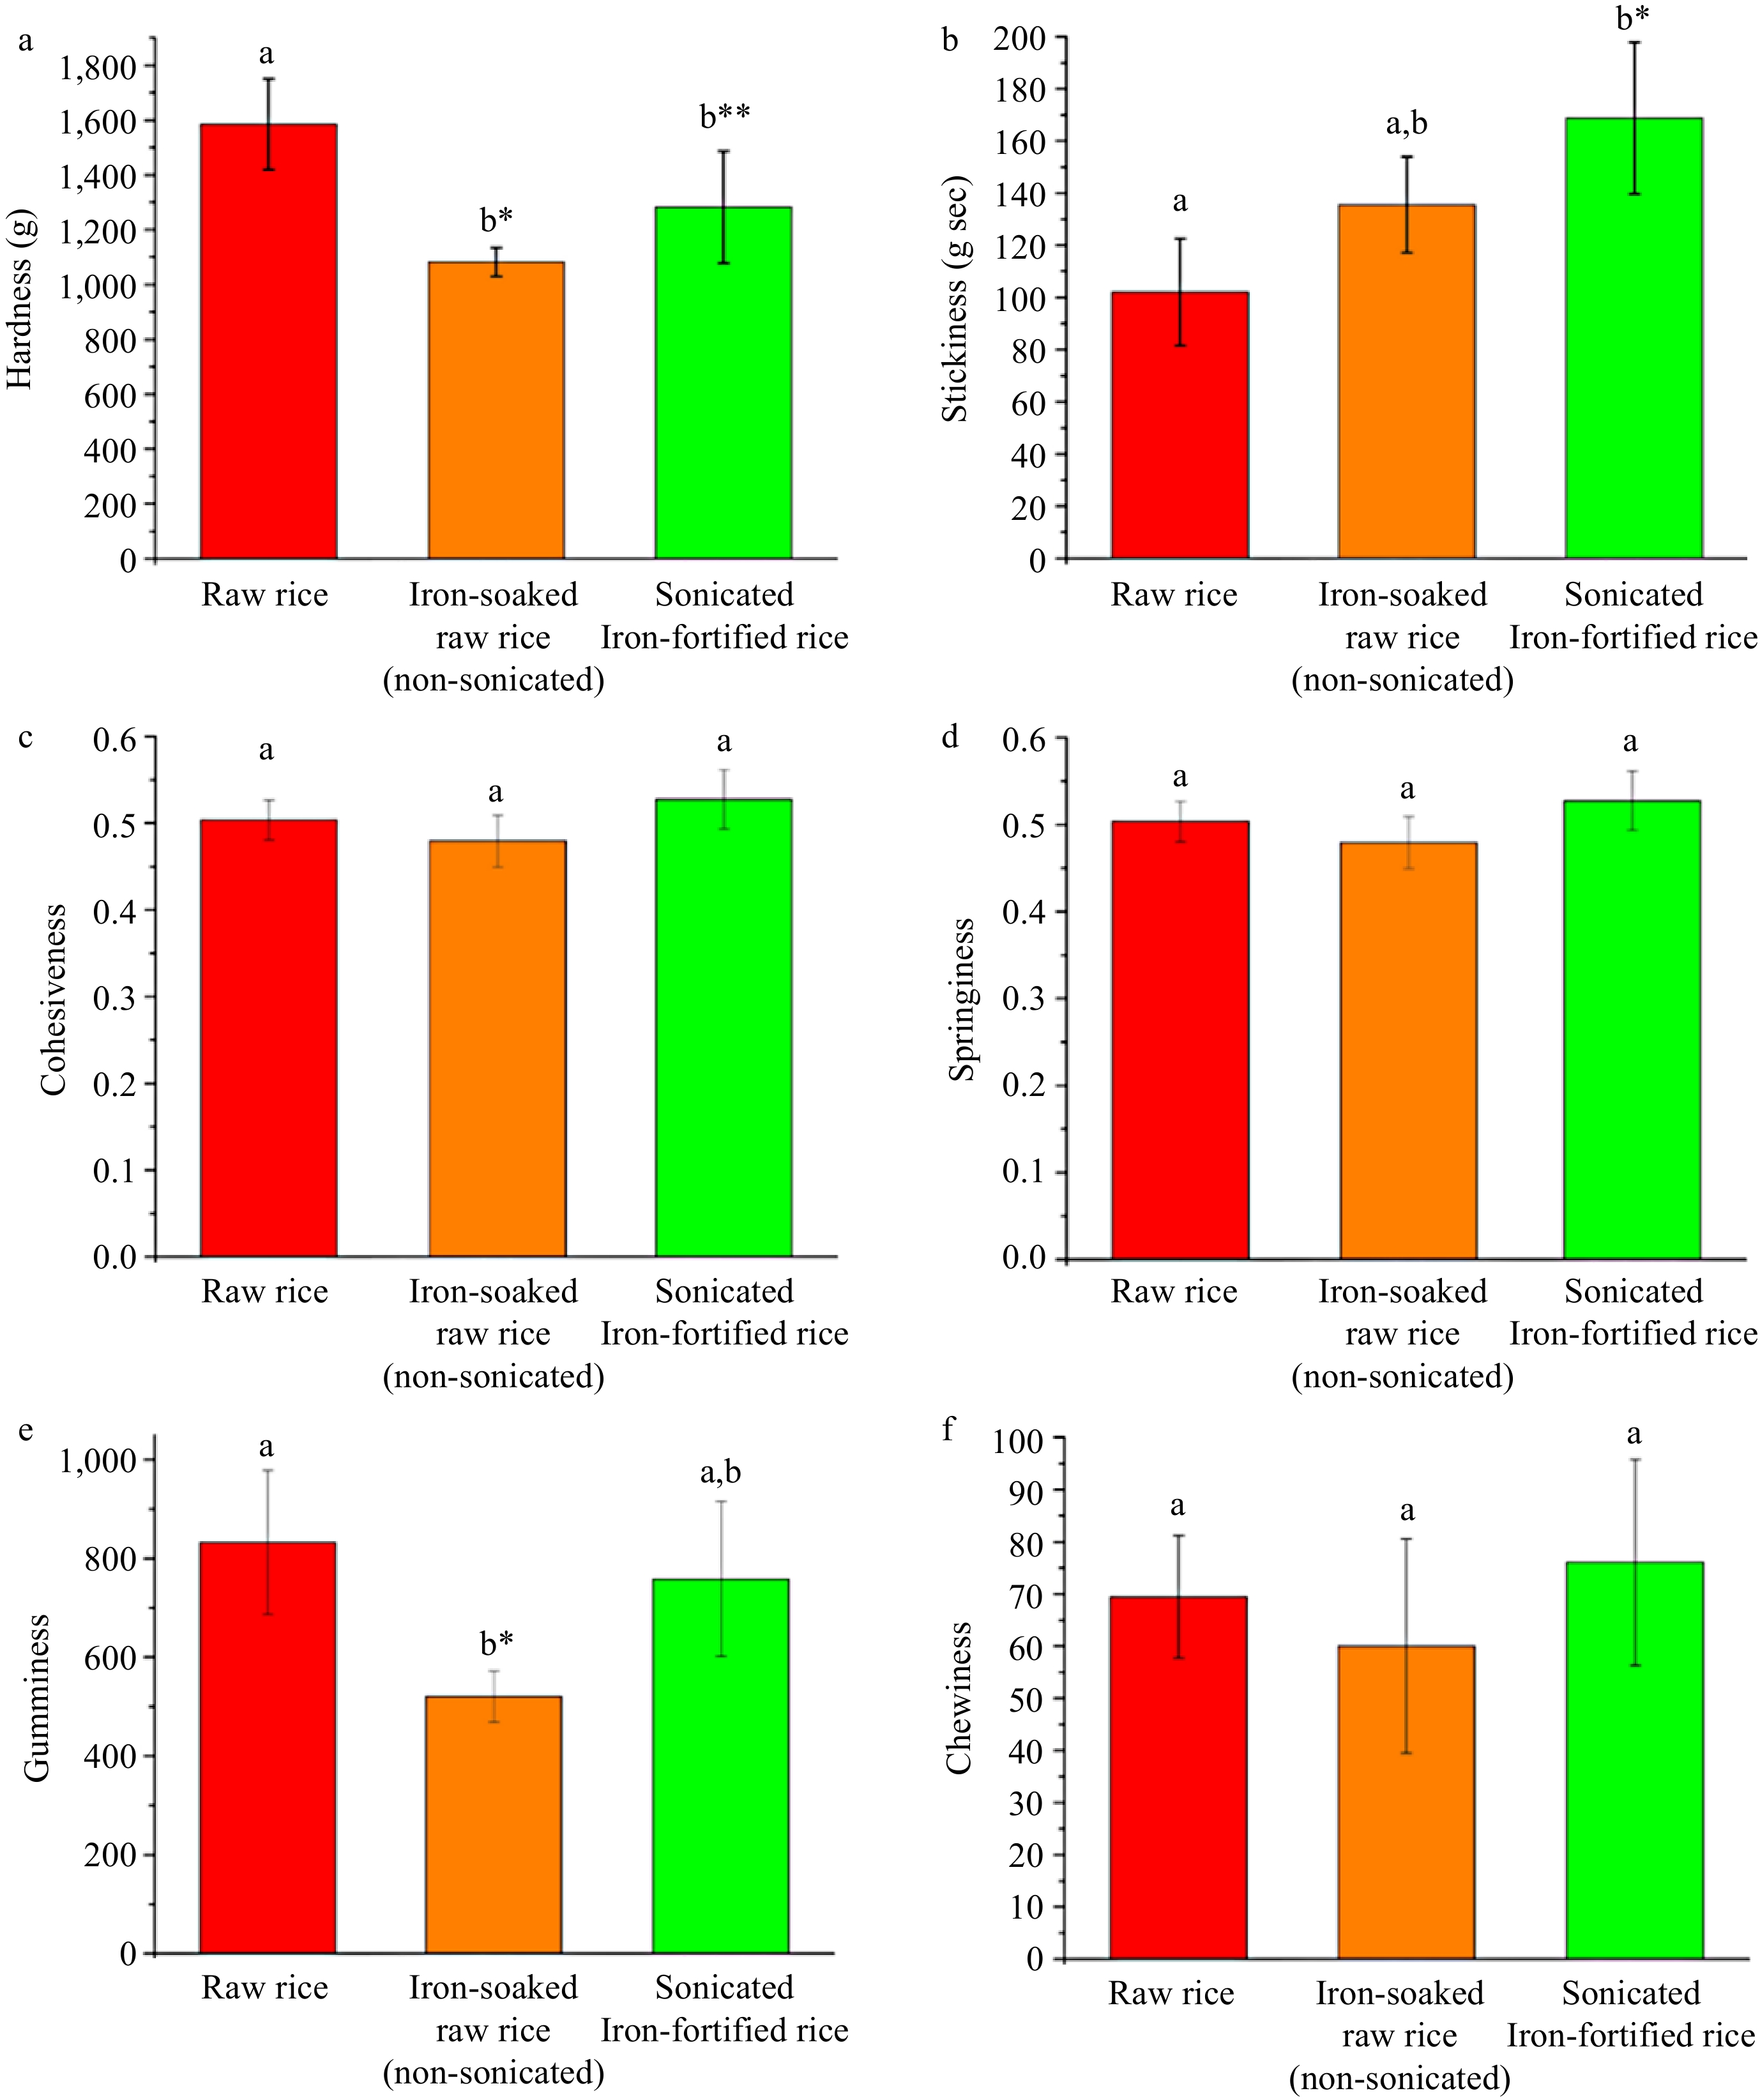
Figure 4.
Textural properties of cooked raw and iron-fortified IR65 rice. (a) Hardness, (b) stickiness, (c) cohesiveness, (d) springiness, (e) gumminess, (f) chewiness. Values with different letters are significantly different (* p < 0.01, ** p < 0.05).
-
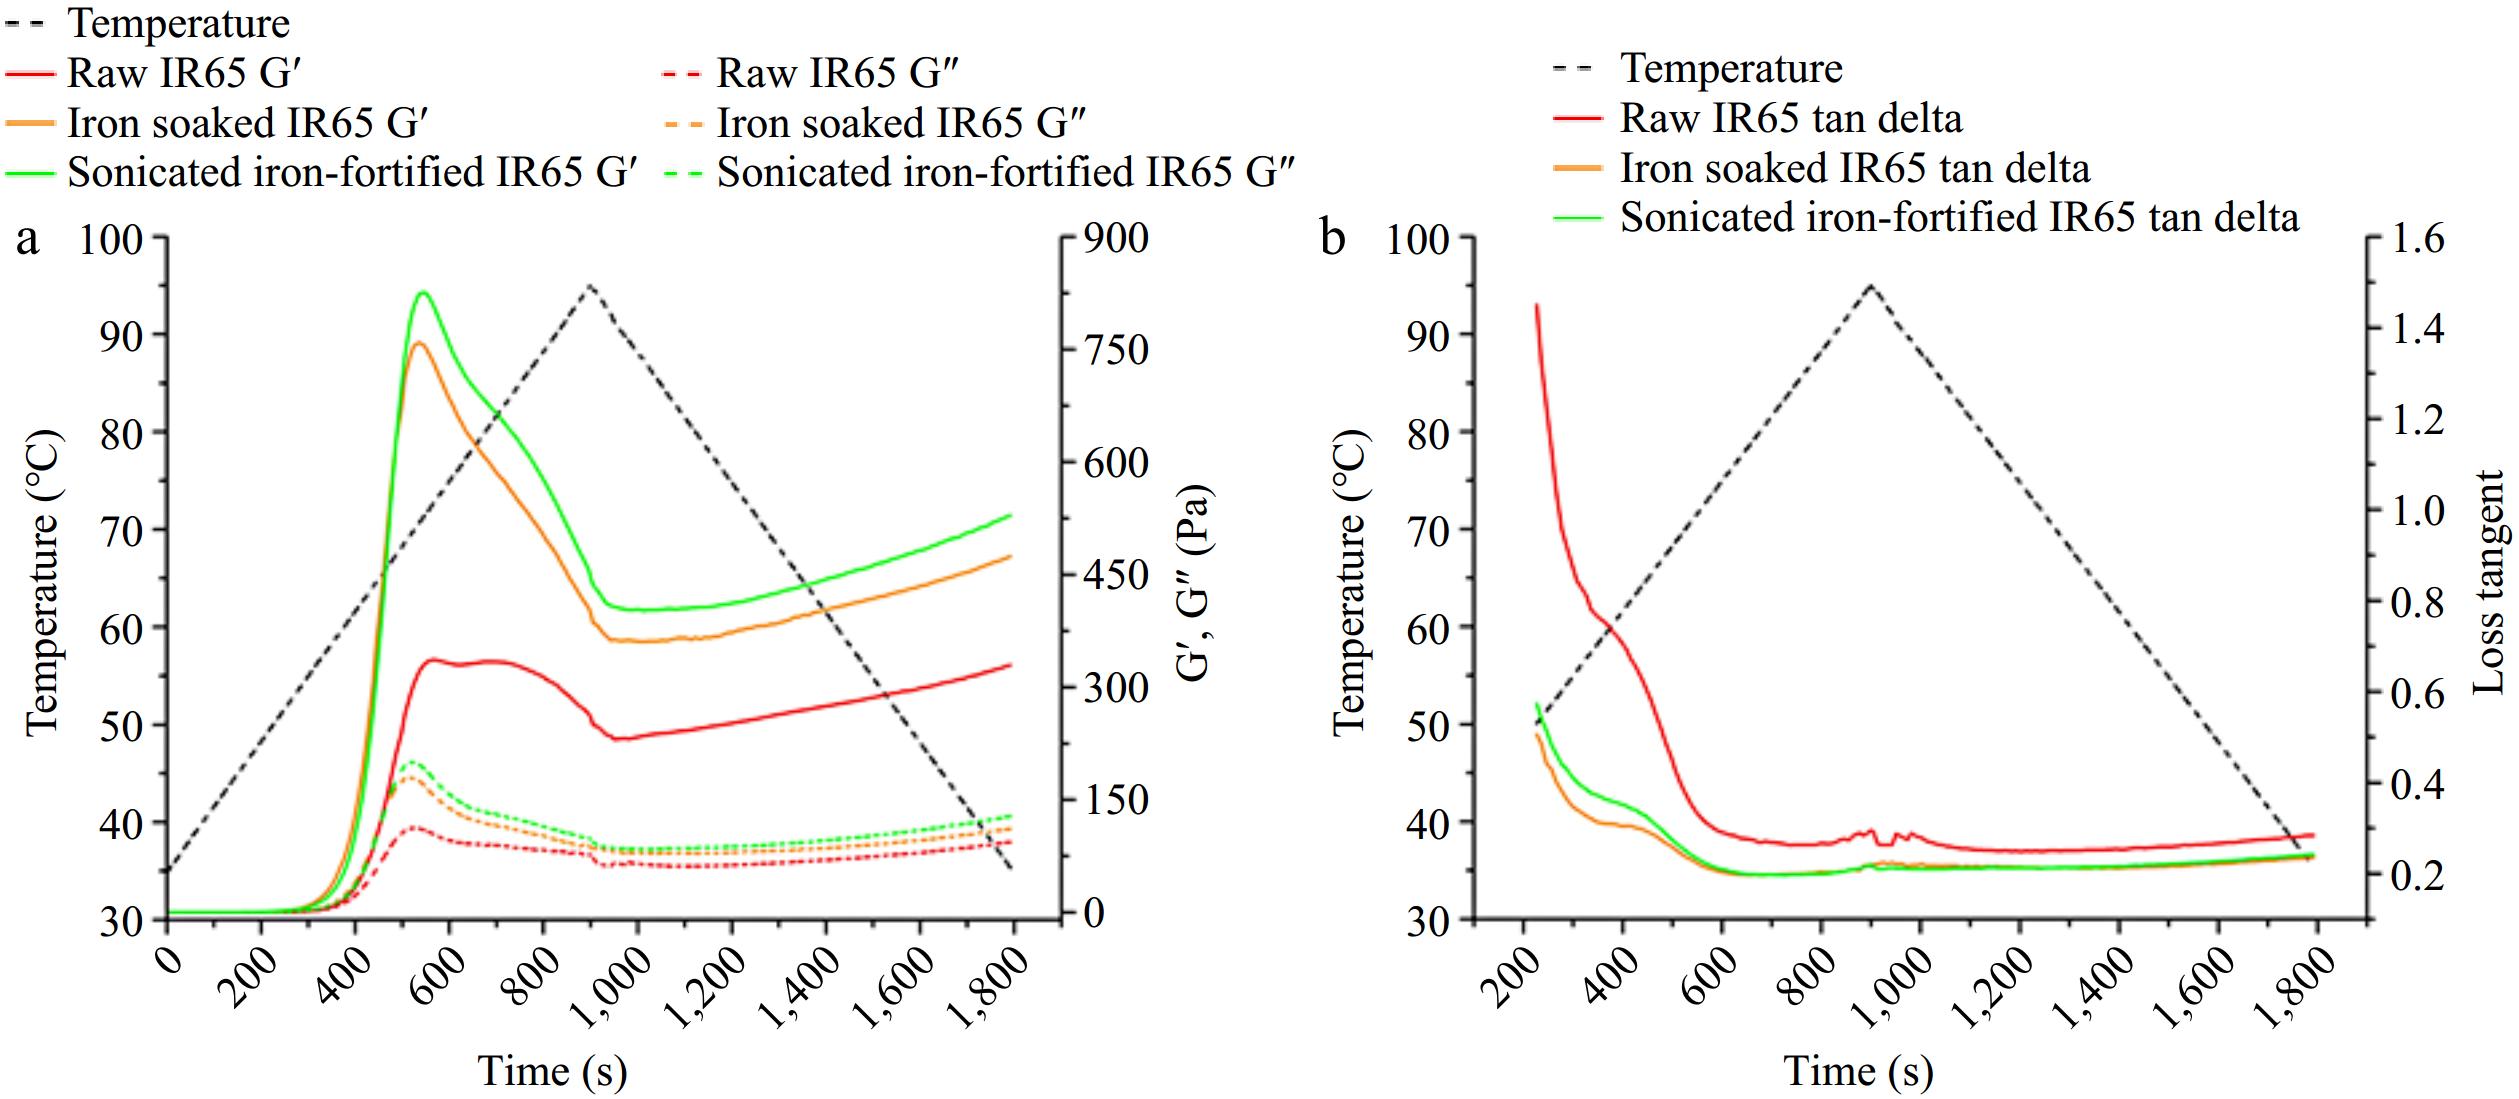
Figure 5.
Dynamic shear curves of IR65 rice samples during temperature ramp experiment showing (a) elastic (G') and viscous moduli (G"); and (b) tan δ. For the color version of the figure, the reader is referred to the online version of this article.
-
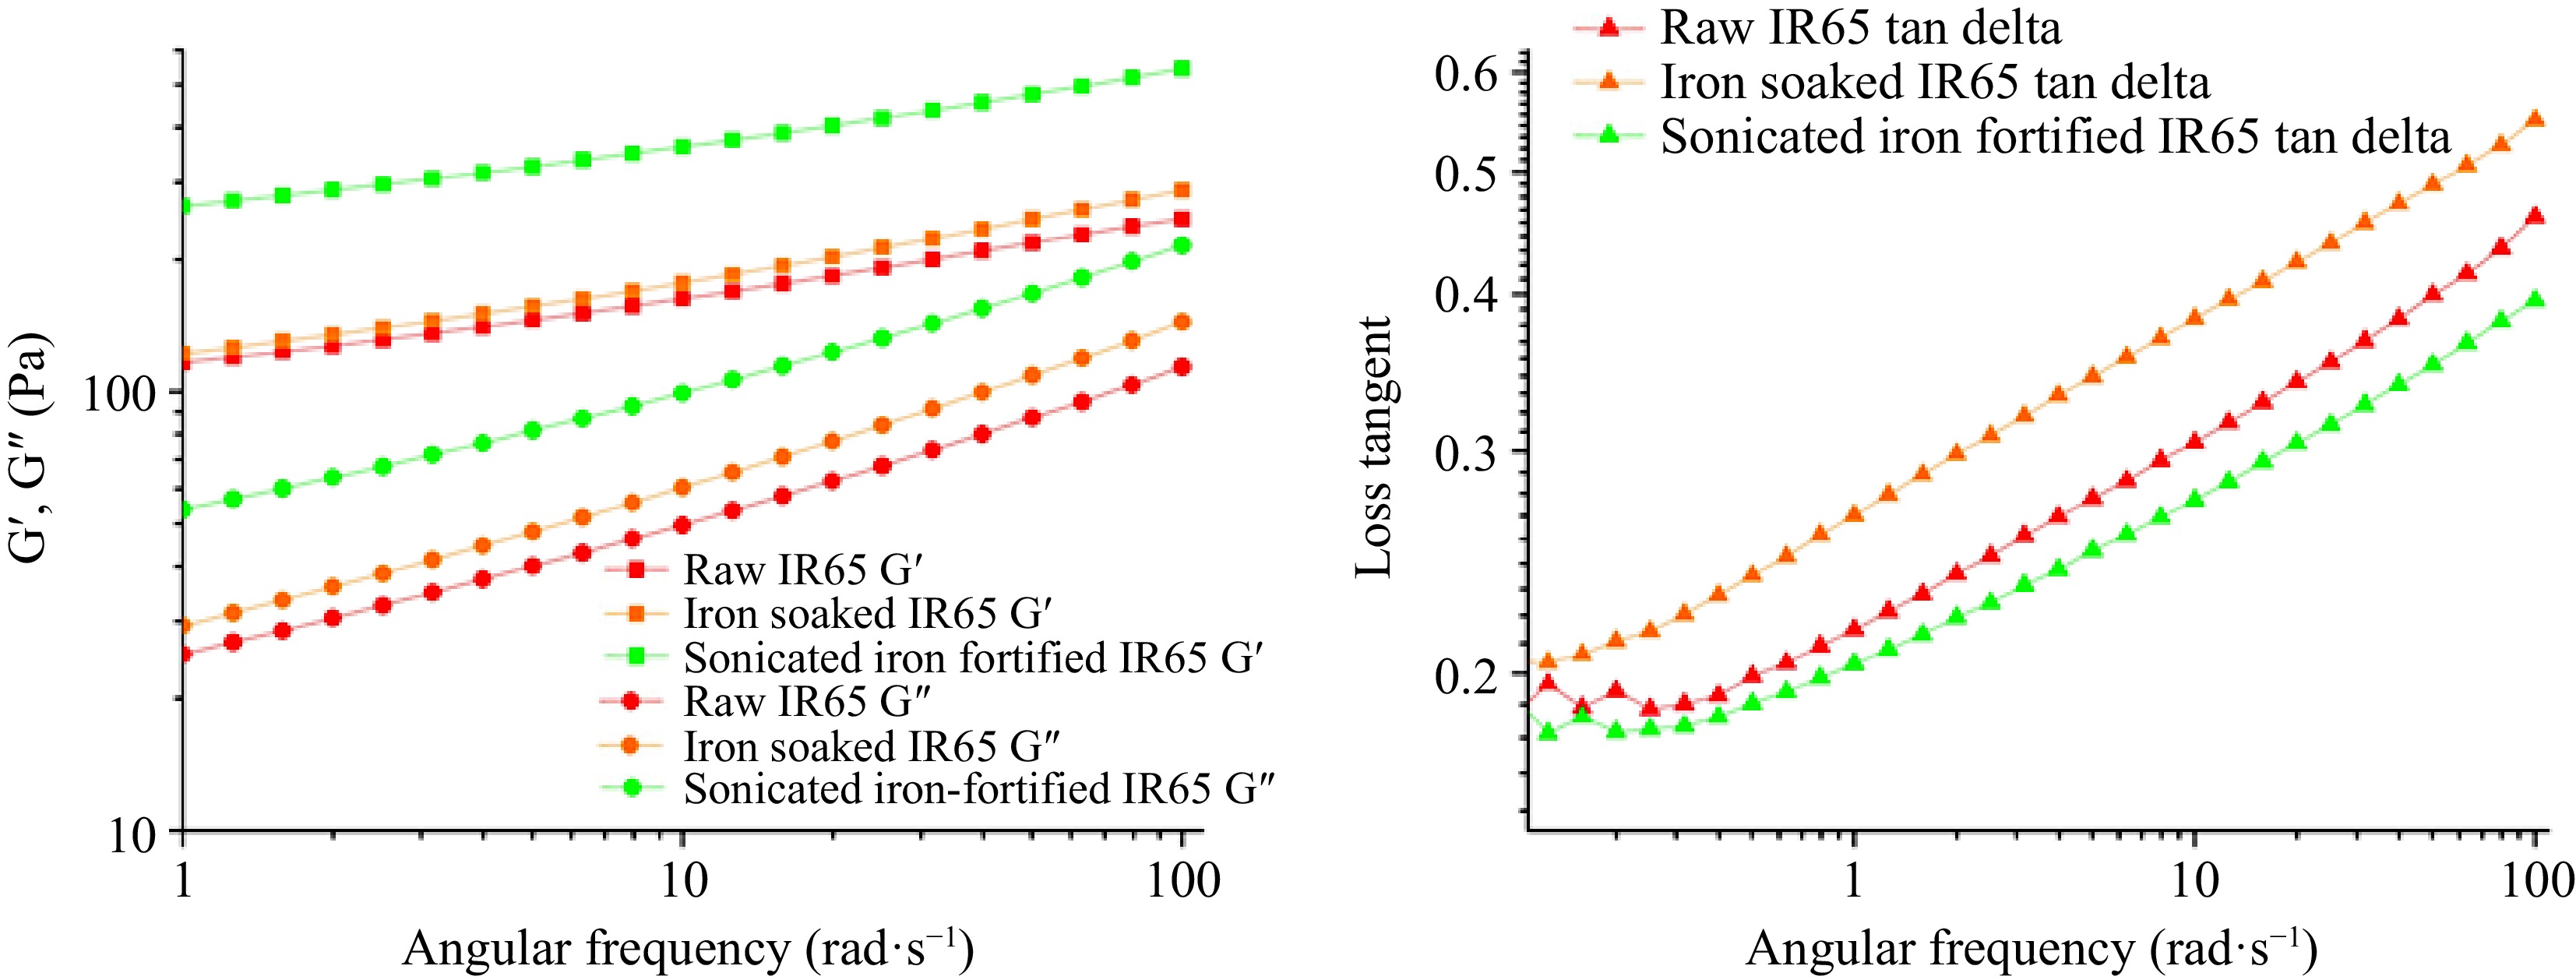
Figure 6.
Dynamic viscoelasticity of IR65 as a function of frequency.
-
Samples Raw IR65 Iron soaked IR65 Sonicated
iron-fortified IR65Heating G'max 333.73 ± 79.11a 760.50 ± 145.24b** 833.23 ± 199.95b* G"max 107.84 ± 14.34a 175.57 ± 30.09a 194.43 ± 39.46b** tan δG'max 0.33 ± 0.04a 0.23 ± 0.01a 0.23 ± 0.01a G'95°C 264.17 ± 23.05a 405.33 ± 56.47b** 456.20 ± 59.25b* G"95°C 76.58 ± 2.23a 88.88 ± 14.52a 98.74 ± 0.71b** tan δ95°C 0.29 ± 0.02a 0.22 ± 0.01b* 0.22 ± 0.01b* Cooling G'35°C 329.53 ± 12.26a 474.27 ± 69.27b** 529.03 ± 37.37b* G"35°C 93.62 ± 2.82a 111.29 ± 11.82b** 127.97 ± 6.33b* tan δ35°C 0.28 ± 0.00a 0.24 ± 0.01b* 0.24 ± 0.01b* Data presented as mean ± standard deviation of duplicate determinations. Values with different letters in the same group are significantly different (* p < 0.01, ** p < 0.05). Table 1.
Dynamic rheological properties of waxy rice in the presence of FeSO4.
-
Samples Consistency index (K) Flow behavior index (n) Raw IR65 6.80 ± 0.77a 0.030 ± 0.00a Iron soaked IR65 6.98 ± 2.99a,b 0.037 ± 0.01a Sonicated iron-fortified IR65 13.0 ± 1.33b 0.027 ± 0.00a Data presented as mean ± standard deviation of duplicate determinations. Values with different letters in the same group are significantly different. Table 2.
Derived parameters from frequency sweep experiment of IR65 rice samples.
Figures
(6)
Tables
(2)