-
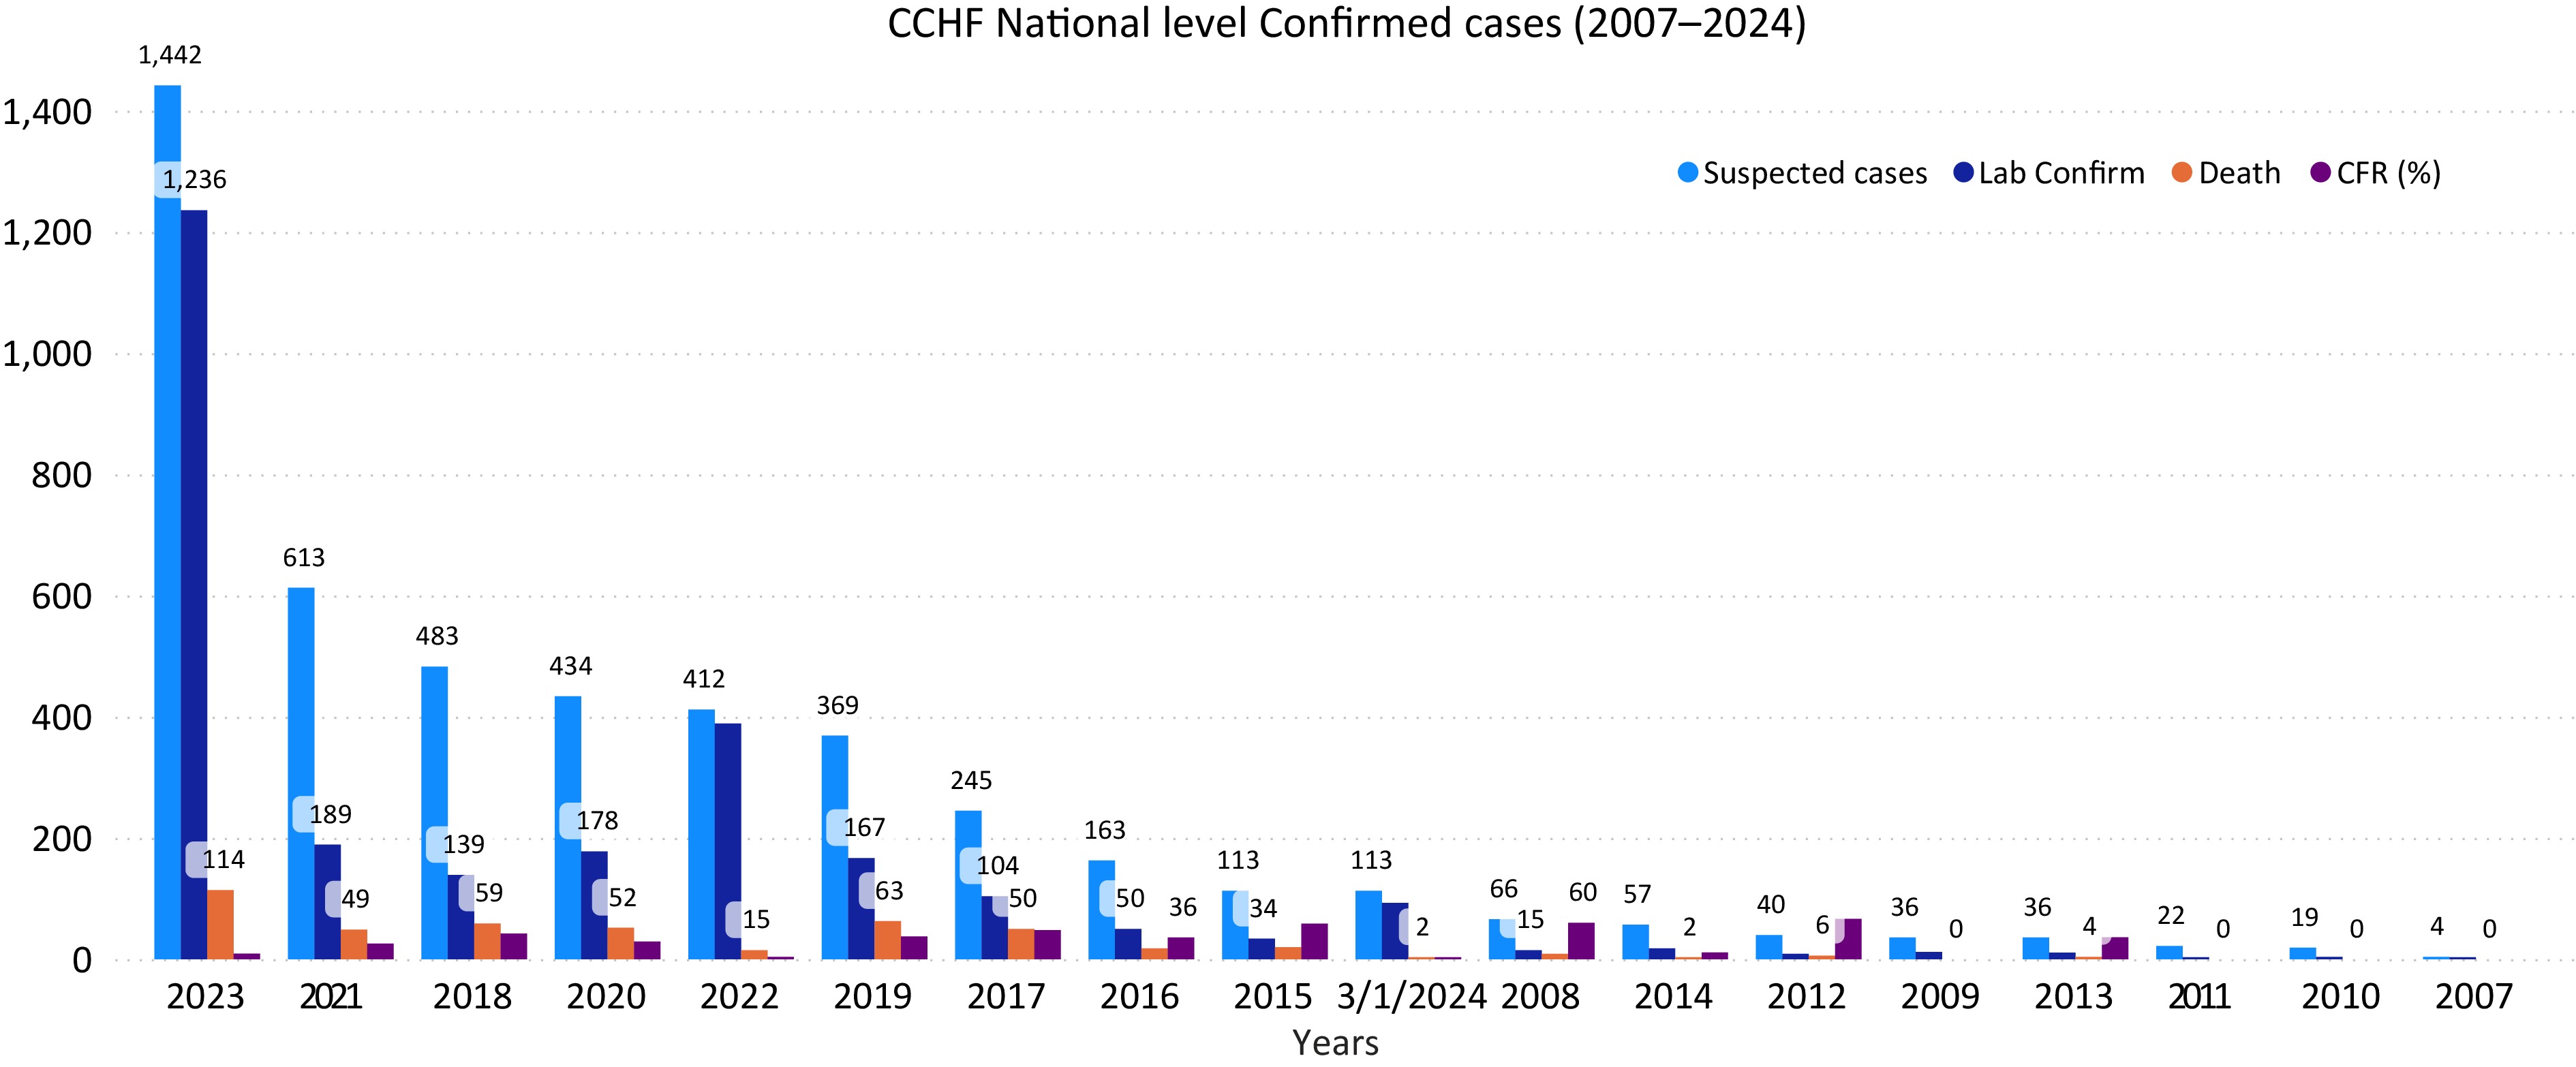
Figure 1.
Number of suspected and confirmed CCHF cases and death in Afghanistan, 2007–2024. The horizontal axis year (from 2007 to 2024) and vertical axis shows the number of CCHF cases.
-

Figure 3.
National surveillance data due to CCHF outbreak on an annual basis for the northeast region provinces (Kunduz, Takhar, Badakhshan, and Baghlan) during the period of 2007−2024. The horizontal axis shows CCHF prevalence on year basis and vertical axis shows the number of CCHF confirmed cases by the national surveillance system for the northeast region provinces.
-
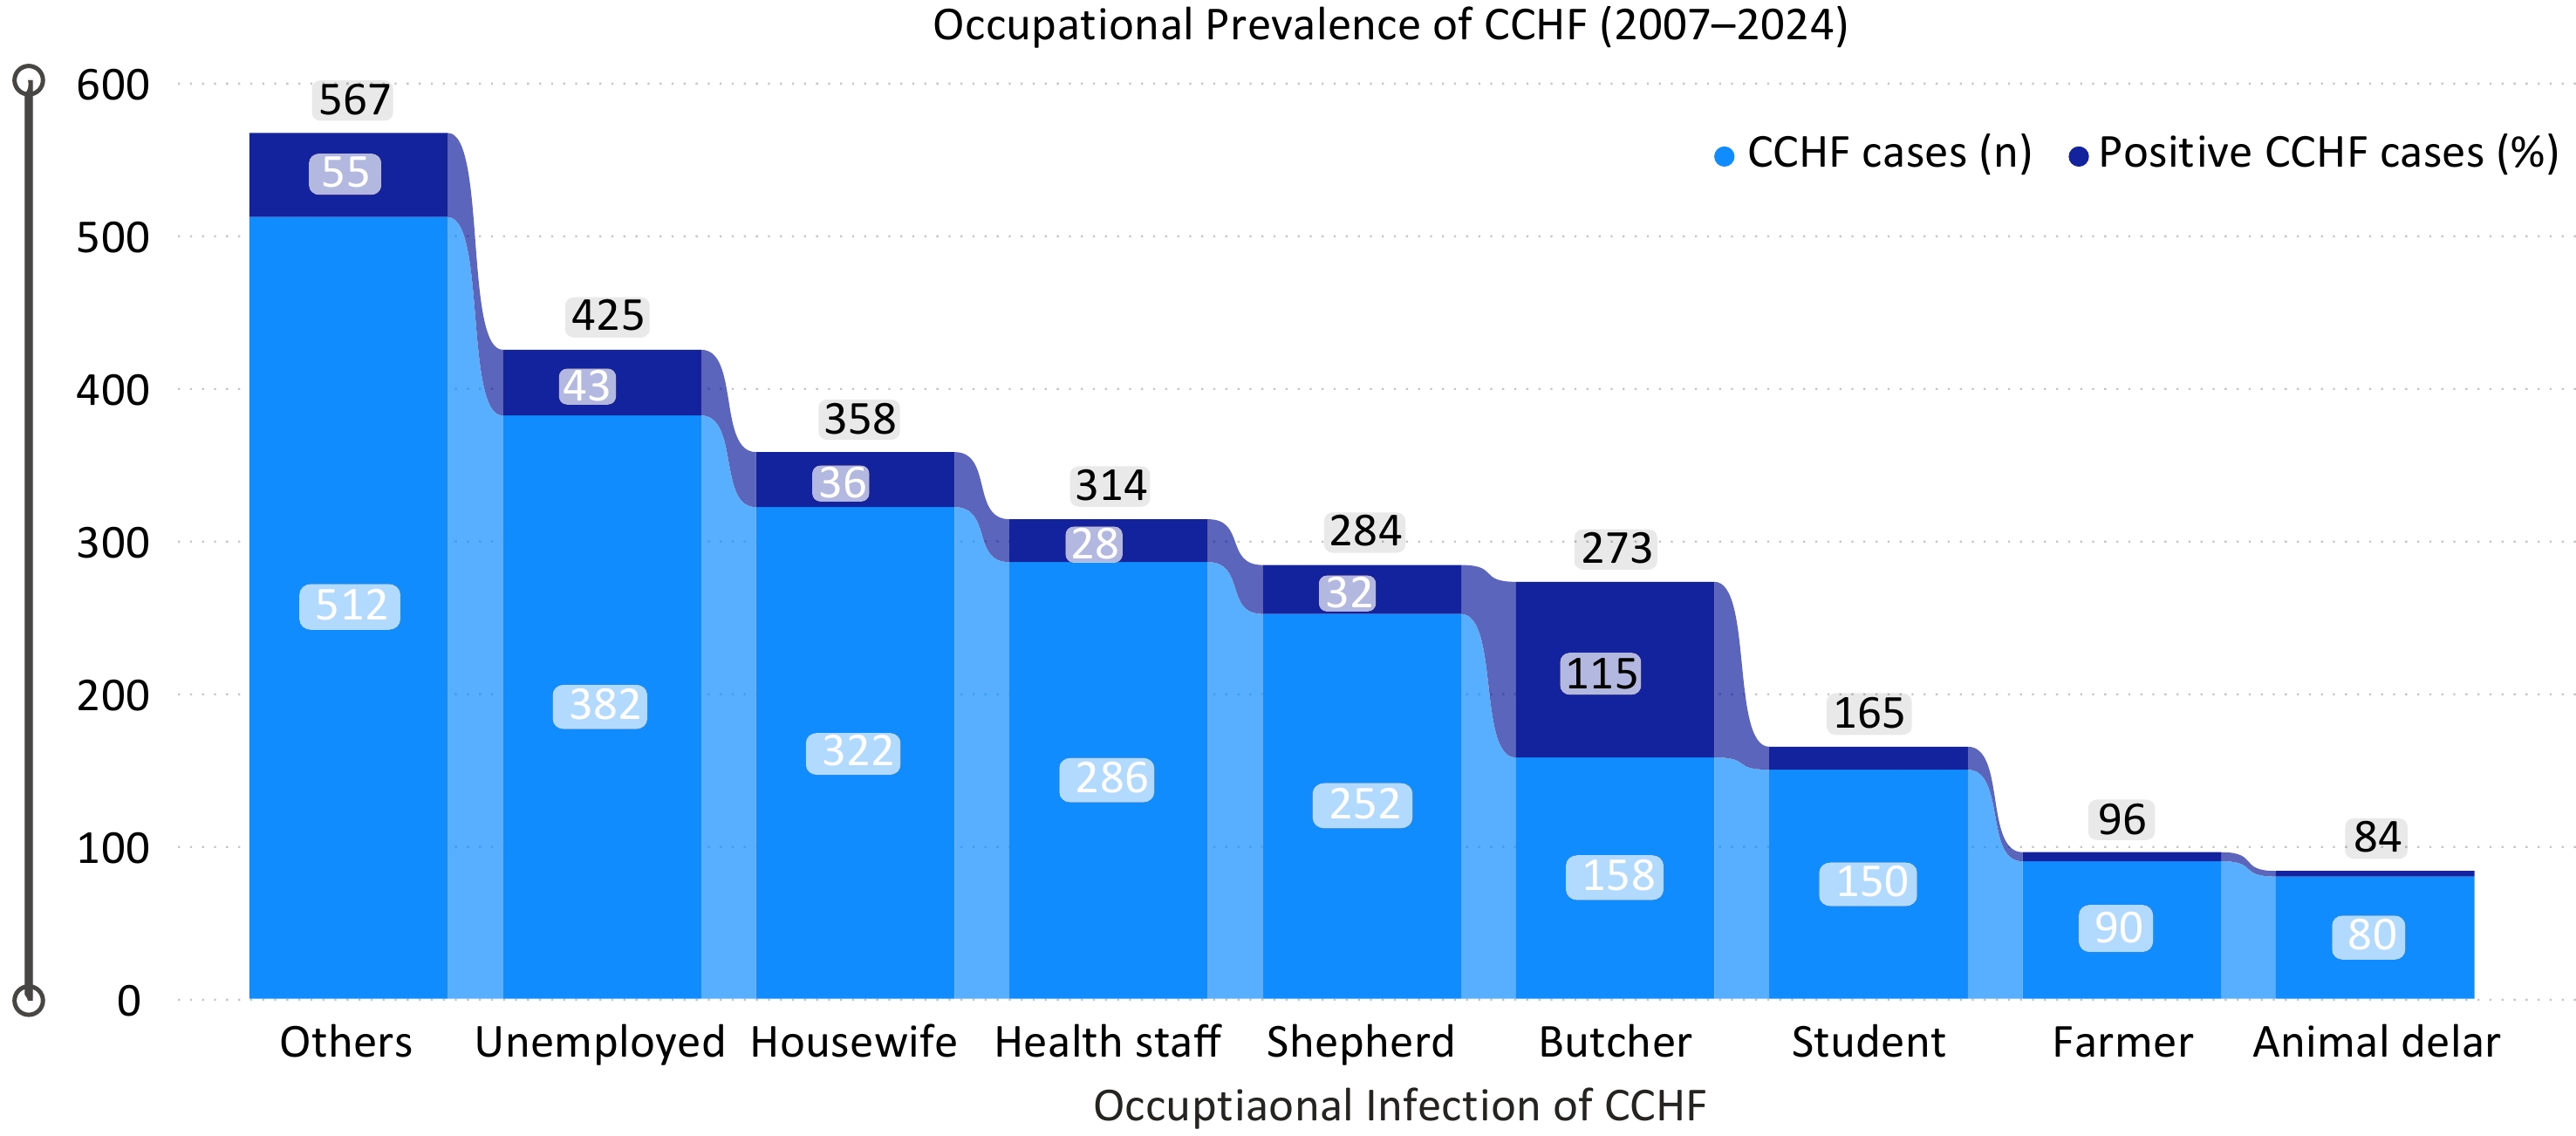
Figure 2.
Occupational prevalence due to CCHF for the period of 2007−2024. The blue color indicates number of recorded cases while the dark blue color indicates the number of death cases respectively. The horizontal axis indicates the occupation of persons, and the vertical axis indicates the total number of CCHF cases due to occupational incidences of CCHF for the period of 2007−2024.
-
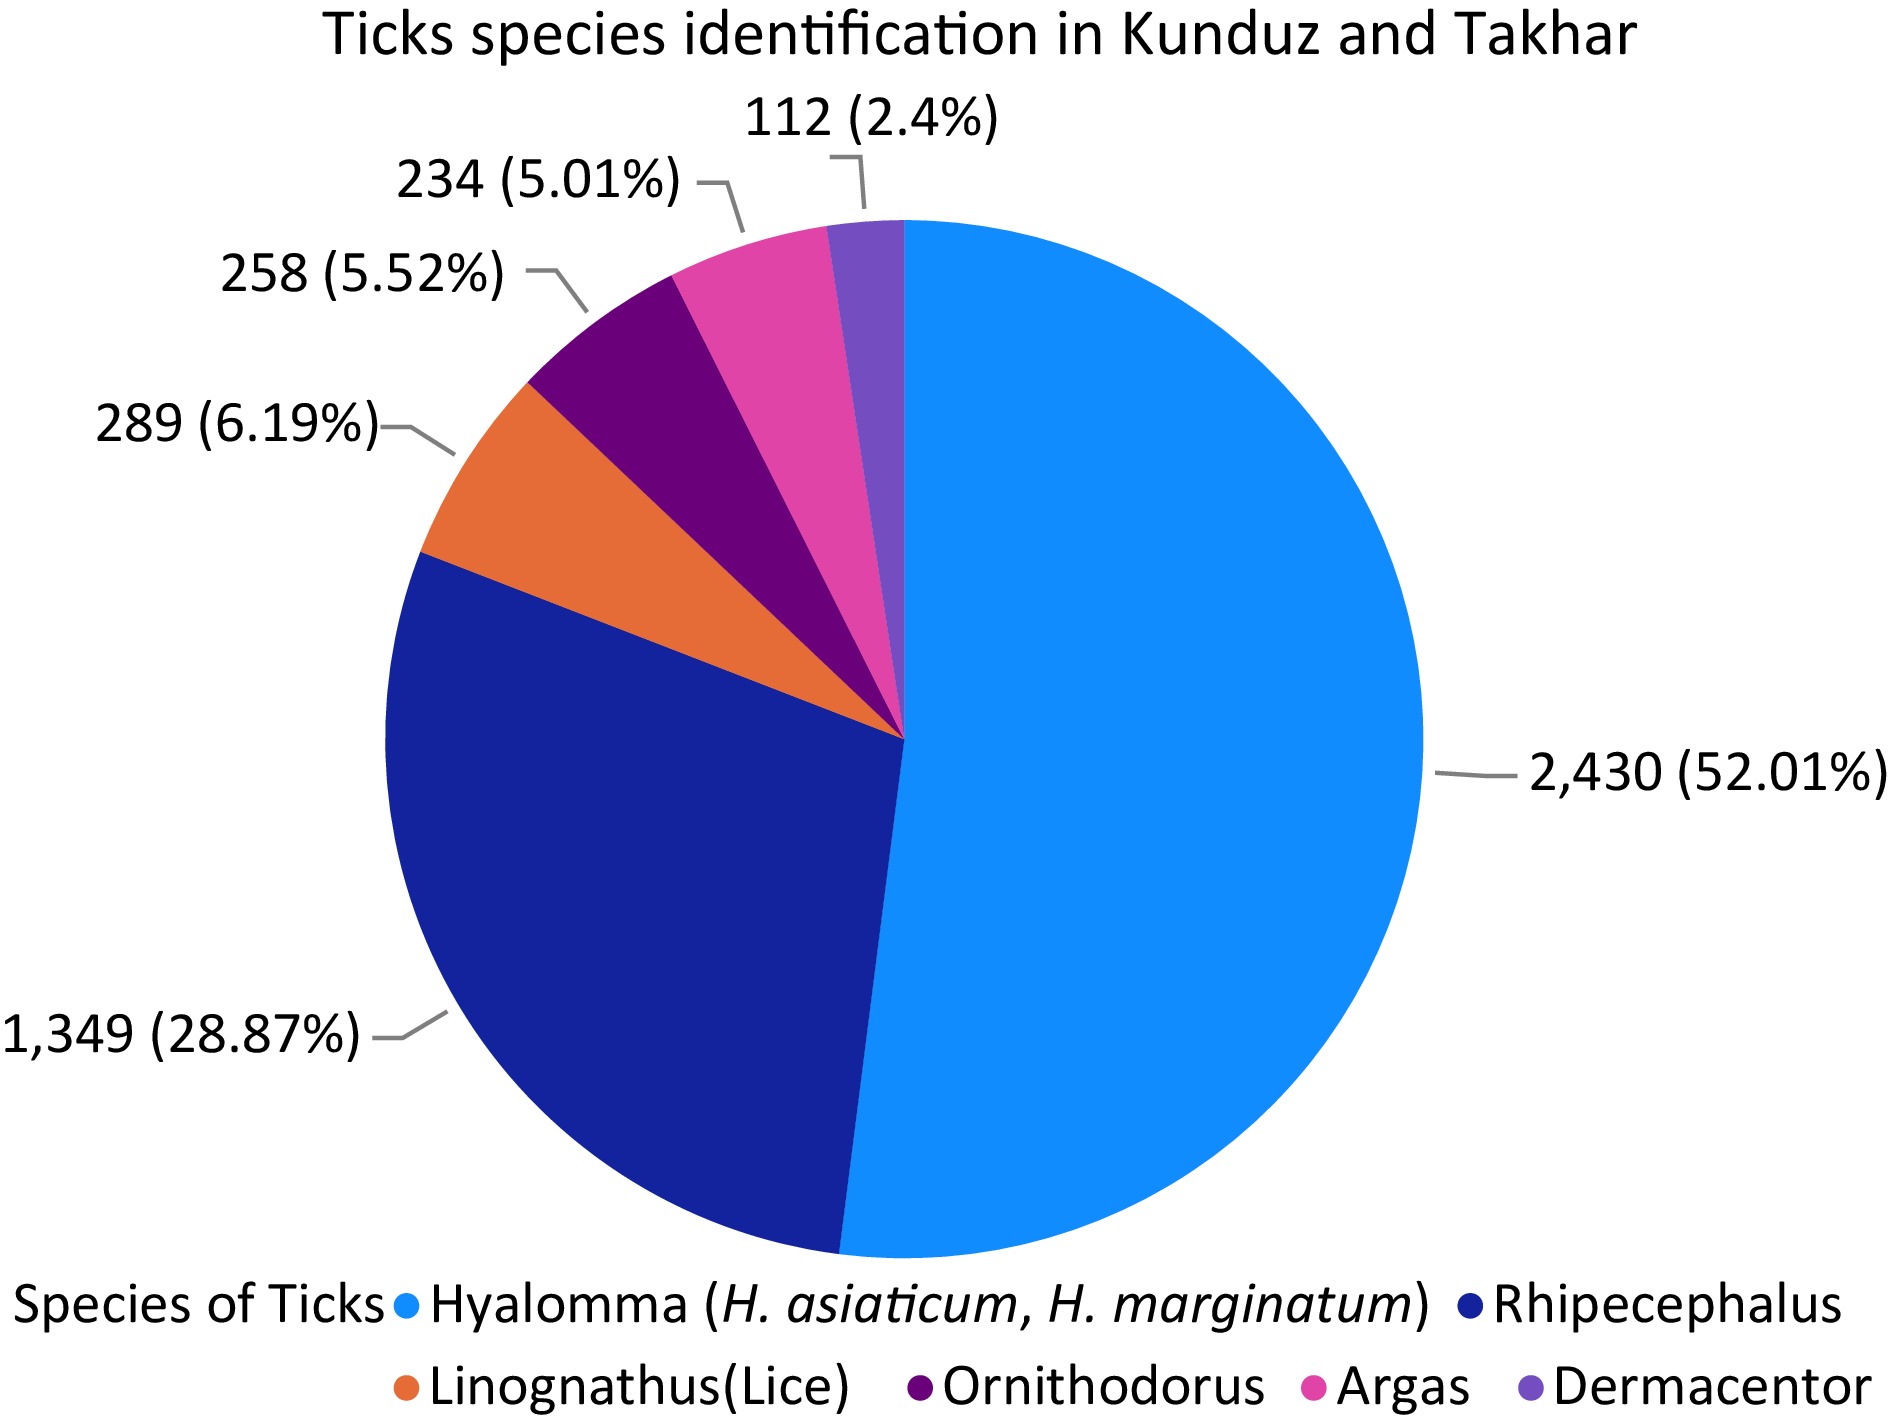
Figure 4.
Different species of ticks presents in Kunduz and Takhar provinces with their percentage. Each species of the ticks found are exhibited in the figure with number and percentage.
-
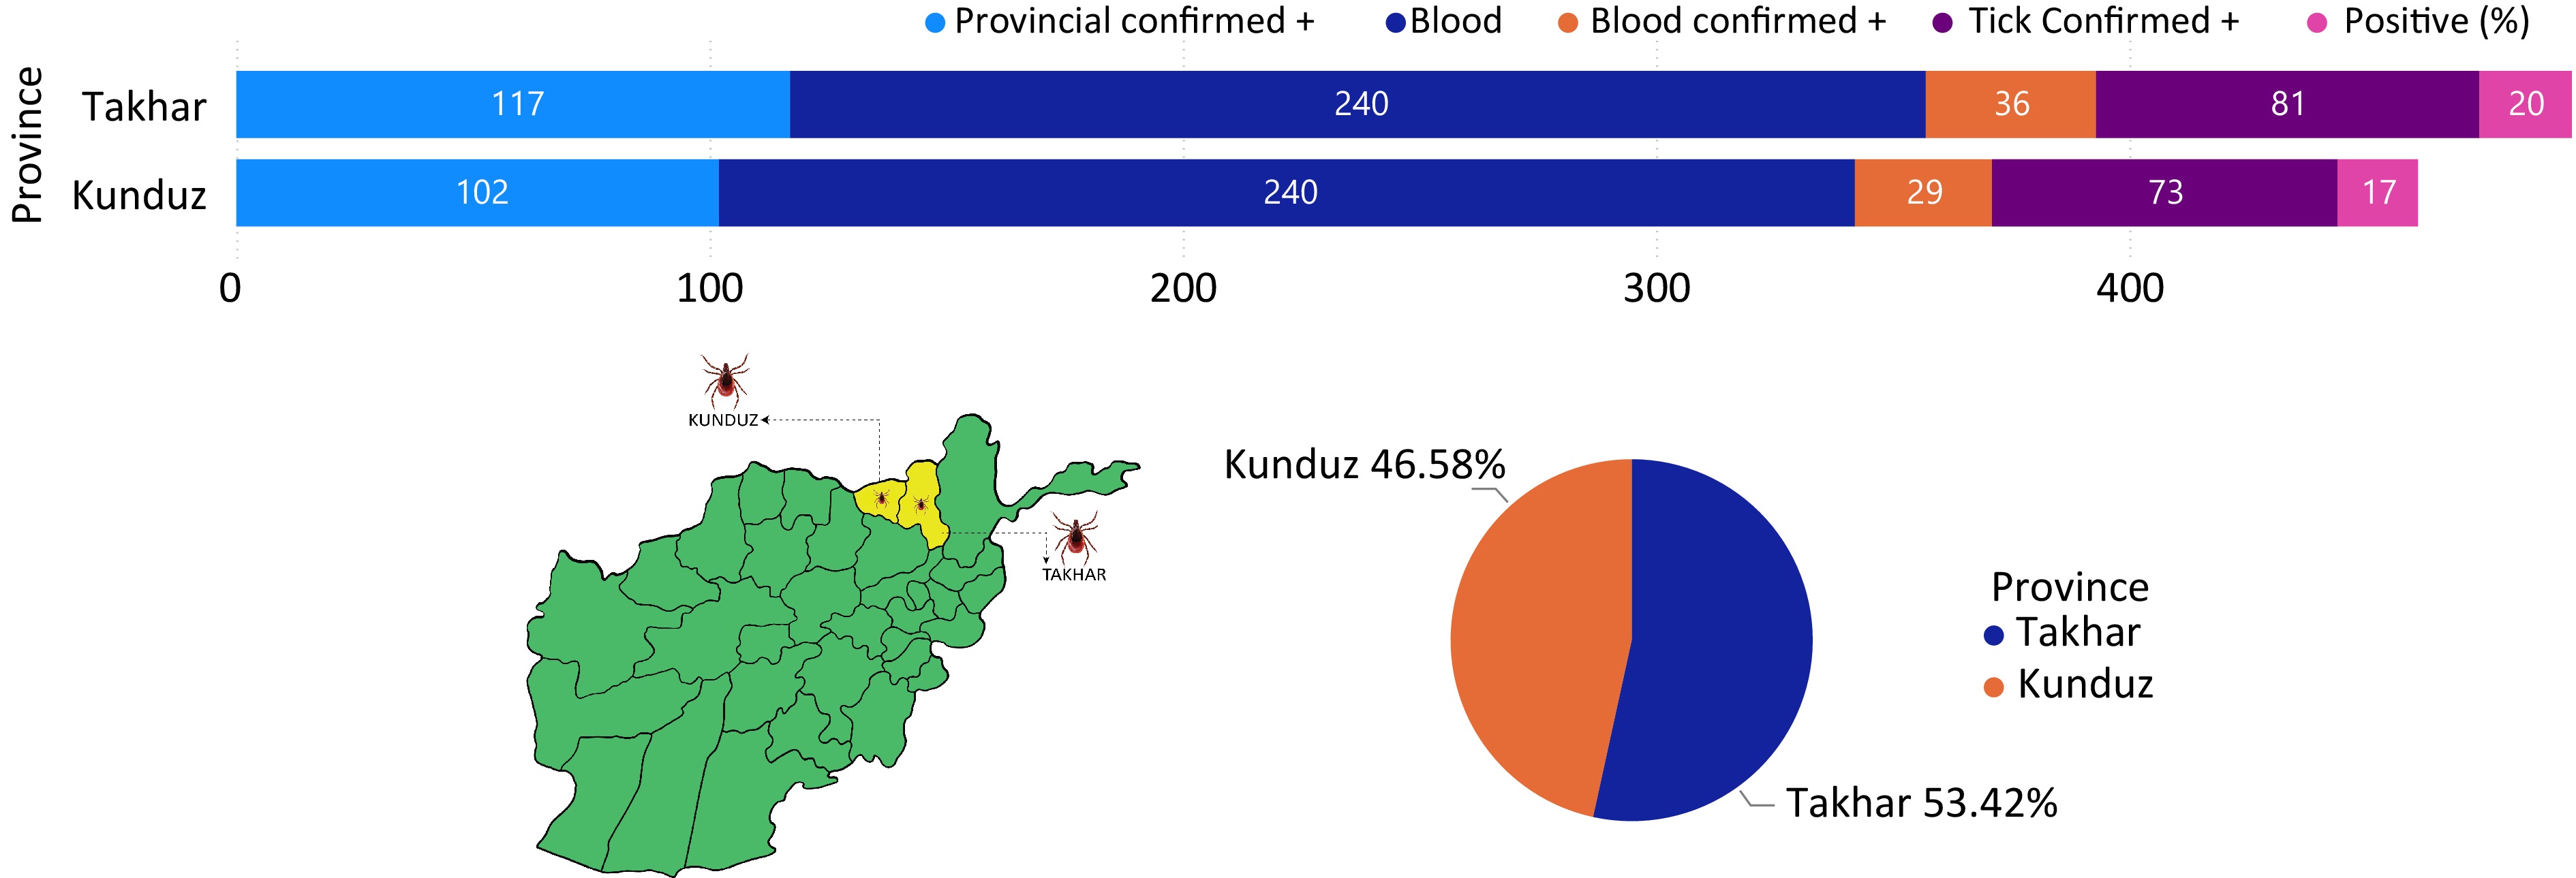
Figure 5.
Prevalence of CCHF in Kunduz and Takhar provinces.
-
Study province Study district Variables Examined Positive Seroprevalence (%) χ2 value p-value Kunduz Kunduz-Center Cattle 60 15 30 0.1816 0.0609 Sheep 40 9 32.5 Goat 30 3 26.66666667 Camel 15 0 13.33333333 Chicken 5 0 0 Dasht-e-Archi Cattle 60 18 25 0.6031 0.088 Sheep 40 13 22.5 Goat 30 8 10 Camel 15 2 0 Chicken 5 0 0 Imam Sahib Cattle 60 9 15 0.5714 0.061 Sheep 40 11 27.5 Goat 30 5 16.66666667 Camel 15 2 13.33333333 Chicken 5 0 0 Char Dara Cattle 60 5 8.333333333 0.0742 0.045 Sheep 40 4 10 Goat 30 3 10 Camel 15 0 0 Chicken 5 0 0 Takhar Taloqan Cattle 60 14 23.33333333 0.4867 0.067 Sheep 40 11 27.5 Goat 30 5 16.66666667 Camel 15 1 6.666666667 Chicken 5 0 0 Rustaq Cattle 60 22 36.66666667 0.5683 0.109 Sheep 40 16 40 Goat 30 9 30 Camel 15 3 20 Chicken 5 0 0 Khwaja Bahawodeen Cattle 60 9 15 0.4477 0.053 Sheep 40 8 20 Goat 30 4 13.33333333 Camel 15 0 0 Chicken 5 0 0 Khwaja Ghar Cattle 60 3 5 0.4953 0.043 Sheep 40 5 12.5 Goat 30 2 6.666666667 Camel 15 0 0 Chicken 5 0 0 Table 1.
Association of sera-molecular prevalence of CCHF within animal species in the Kunduz and Takhar provinces of Afghanistan.
-
Study province Study district Variables Examined Positive Seroprevalence (%) χ2 value p-value Kunduz Kunduz-Center Male 77 12 15.58441558 0.5098 0.0361 Female 73 15 20.54794521 Dasht-e-Archi Male 77 11 14.28571429 0.0052 0.0302 Female 73 30 41.09589041 Imam Sahib Male 77 10 12.98701299 0.1713 0.0103 Female 73 17 23.28767123 Char Dara Male 77 4 5.194805195 0.2301 0.0016 Female 73 8 10.95890411 Takhar Taloqan Male 77 11 14.28571429 0.1079 0.0067 Female 73 20 27.39726027 Rustaq Male 77 19 24.67532468 8.125 0.015 Female 73 31 42.46575342 Khwaja Bahawodeen Male 77 7 9.090909091 0.1222 0.003 Female 73 14 19.17808219 Khwaja Ghar Male 77 3 3.896103896 0.1914 0.001 Female 73 7 9.589041096 Table 2.
Association of sera-molecular prevalence of CCHF within sex of animals in the Kunduz and Takhar provinces of Afghanistan.
-
Study province Study district Variables Examined Positive Seroprevalence (%) χ2 value p-value Kunduz Kunduz-Center < 6 months 20 3 15 1 0.0137 1 > Year 30 3 23.33333333 > 2 Year 40 7 25 2 > Year 60 14 35 Dasht-e-Archi < 6 months 20 3 15 1 0.027 1 > Year 30 7 10 > 2 Year 40 10 17.5 2 > Year 60 21 23.33333333 Imam Sahib < 6 months 20 2 10 1 0.012 1 > Year 30 5 16.66666667 > 2 Year 40 9 22.5 2 > Year 60 11 18.33333333 Char Dara < 6 months 20 1 5 1 0.007 1 > Year 30 3 10 > 2 Year 40 2 5 2 > Year 60 6 10 Takhar Taloqan < 6 months 20 2 10 1 0.016 1 > Year 30 5 16.66666667 > 2 Year 40 9 22.5 2 > Year 60 15 25 Rustaq < 6 months 20 5 25 1 0.035 1 > Year 30 10 33.33333333 > 2 Year 40 13 32.5 2 > Year 60 22 36.66666667 Khwaja Bahawodeen < 6 months 20 2 10 1 0.0103 1 > Year 30 3 10 > 2 Year 40 5 12.5 2 > Year 60 11 18.33333333 Khwaja Ghar < 6 months 20 1 5 1 0.006 1 > Year 30 2 6.666666667 > 2 Year 40 2 5 2 > Year 60 5 8.333333333 Table 3.
Association of sera-molecular prevalence of CCHF within age of animals in the Kunduz and Takhar provinces of Afghanistan.
-
Study province Study district Variables Examined Positive Seroprevalence (%) χ2 value p-value Kunduz Kunduz-Center Indigenous 140 26 18.57142857 0.5571 0.45 Exotic 10 1 10 Dasht-e-Archi Indigenous 140 39 27.85714286 0.6757 0.504 Exotic 10 2 20 Imam Sahib Indigenous 140 26 18.57142857 0.5571 0.45 Exotic 10 1 10 Char Dara Indigenous 140 12 8.571428571 0.3558 0.401 Exotic 10 0 0 Takhar Taloqan Indigenous 140 30 21.42857143 0.4654 0.465 Exotic 10 1 10 Rustaq Indigenous 140 47 33.57142857 0.8684 0.541 Exotic 10 3 30 Khwaja Bahawodeen Indigenous 140 20 14.28571429 0.7389 0.429 Exotic 10 1 10 Khwaja Ghar Indigenous 140 10 7.142857143 0.399 0.395 Exotic 10 0 0 Table 4.
Association of sera-molecular prevalence of CCHF within breed of animals in the Kunduz and Takhar provinces of Afghanistan.
-
Study province Study district Variables Examined Positive Seroprevalence (%) χ2 value p-value Kunduz Kunduz-Center Extensive 75 19 25.33333333 0.5086 0.007 Intensive 75 8 10.66666667 Dasht-e-Archi Extensive 75 29 38.66666667 0.0181 0.023 Intensive 75 12 16 Imam Sahib Extensive 75 22 29.33333333 0.0031 0.018 Intensive 75 5 6.666666667 Char Dara Extensive 75 10 13.33333333 0.026 0.003 Intensive 75 2 2.666666667 Takhar Taloqan Extensive 75 26 34.66666667 0.0005 0.029 Intensive 75 5 6.666666667 Rustaq Extensive 75 39 52 0.0005 0.07 Intensive 75 11 14.66666667 Khwaja Bahawodeen Extensive 75 17 22.66666667 0.0007 0.01 Intensive 75 4 5.333333333 Khwaja Ghar Extensive 75 9 12 0.0141 0.003 Intensive 75 1 1.333333333 Table 5.
Association of sera-molecular prevalence of CCHF with housing system of animals in the Kunduz and Takhar provinces of Afghanistan.
-
Study province Study district Variables Examined Positive Seroprevalence (%) χ2 value p-value Kunduz Kunduz-Center Stall feeding 75 6 8 0.0076 0.0145 Pasture grazing 75 21 28 Dasht-e-Archi Stall feeding 75 6 8 4.8928 0.064 Pasture grazing 75 35 46.66666667 Imam Sahib Stall feeding 75 3 4 0.0001 0.027 Pasture grazing 75 24 32 Char Dara Stall feeding 75 1 1.333333333 0.0053 0.005 Pasture grazing 75 11 14.66666667 Takhar Taloqan Stall feeding 75 5 6.666666667 0.0004 0.029 Pasture grazing 75 26 34.66666667 Rustaq Stall feeding 75 9 12 0.002 0.088 Pasture grazing 75 41 54.66666667 Khwaja Bahawodeen Stall feeding 75 3 4 0.002 0.013 Pasture grazing 75 18 24 Khwaja Ghar Stall feeding 75 2 2.666666667 0.066 0.001 Pasture grazing 75 8 10.66666667 Table 6.
Association of sera-molecular prevalence of CCHF with feeding system of animals in the Kunduz and Takhar provinces of Afghanistan.
-
Study province Study district Variables Examined Positive Seroprevalence (%) χ2 value p-value Kunduz Kunduz-Center Good 75 5 6.666666667 0.0024 0.018 Poor 75 22 29.33333333 Dasht-e-Archi Good 75 7 9.333333333 0.0001 0.056 Poor 75 34 45.33333333 Imam Sahib Good 75 4 5.333333333 0.0007 0.023 Poor 75 23 30.66666667 Char Dara Good 75 2 2.666666667 0.026 0.003 Poor 75 10 13.33333333 Takhar Taloqan Good 75 7 9.333333333 0.0052 0.019 Poor 75 24 32 Rustaq Good 75 12 16 0.0013 0.061 Poor 75 38 50.66666667 Khwaja Bahawodeen Good 75 4 5.333333333 0.0077 0.01 Poor 75 17 22.66666667 Khwaja Ghar Good 75 3 4 0.2205 0.0008 Poor 75 7 9.333333333 Table 7.
Association of sera-molecular prevalence of CCHF with hygenenic measures for animals in the Kunduz and Takhar provinces of Afghanistan.
-
Study province Study district Variables Examined Positive Seroprevalence (%) χ2 value p-value Kunduz Kunduz-Center Obese 50 15 44 5.9152 0.0002 Average 50 4 14 Emaciated 50 8 24 Dasht-e-Archi Obese 50 22 30 1.0036 0.001 Average 50 7 8 Emaciated 50 12 16 Imam Sahib Obese 50 16 32 1.3038 0.0004 Average 50 3 6 Emaciated 50 8 16 Char Dara Obese 50 7 14 7.6074 1.194 Average 50 1 2 Emaciated 50 4 8 Takhar Taloqan Obese 50 16 32 2.748 0.0003 Average 50 4 8 Emaciated 50 11 22 Rustaq Obese 50 17 34 2.386 0.0053 Average 50 6 12 Emaciated 50 27 54 Khwaja Bahawodeen Obese 50 11 22 2.4731 0.0001 Average 50 1 2 Emaciated 50 9 18 Khwaja Ghar Obese 50 4 8 0.0001 2.627 Average 50 1 2 Emaciated 50 5 10 Table 8.
Association of sera-molecular prevalence of CCHF with body condition score of animals in the Kunduz and Takhar provinces of Afghanistan.
-
Study province Study district Variables Examined Positive Seroprevalence (%) χ2 value p-value Kunduz Kunduz-Center Indigenous 75 19 25.33333333 0.0508 0.007 Exotic 75 8 10.66666667 Dasht-e-Archi Indigenous 75 32 42.66666667 0.0013 0.041 Exotic 75 9 12 Imam Sahib Indigenous 75 18 24 0.1103 0.005 Exotic 75 9 12 Char Dara Indigenous 75 8 10.66666667 0.2663 0.0008 Exotic 75 4 5.333333333 Takhar Taloqan Indigenous 75 24 32 0.0052 0.019 Exotic 75 7 9.333333333 Rustaq Indigenous 75 39 52 0.0005 0.0702 Exotic 75 11 14.66666667 Khwaja Bahawodeen Indigenous 75 18 24 0.002 0.013 Exotic 75 3 4 Khwaja Ghar Indigenous 75 8 10.66666667 0.0666 0.0018 Exotic 75 2 2.666666667 Table 9.
Association of sera-molecular prevalence of CCHF with tick infestation in animals in the Kunduz and Takhar provinces of Afghanistan.
Figures
(5)
Tables
(9)