-
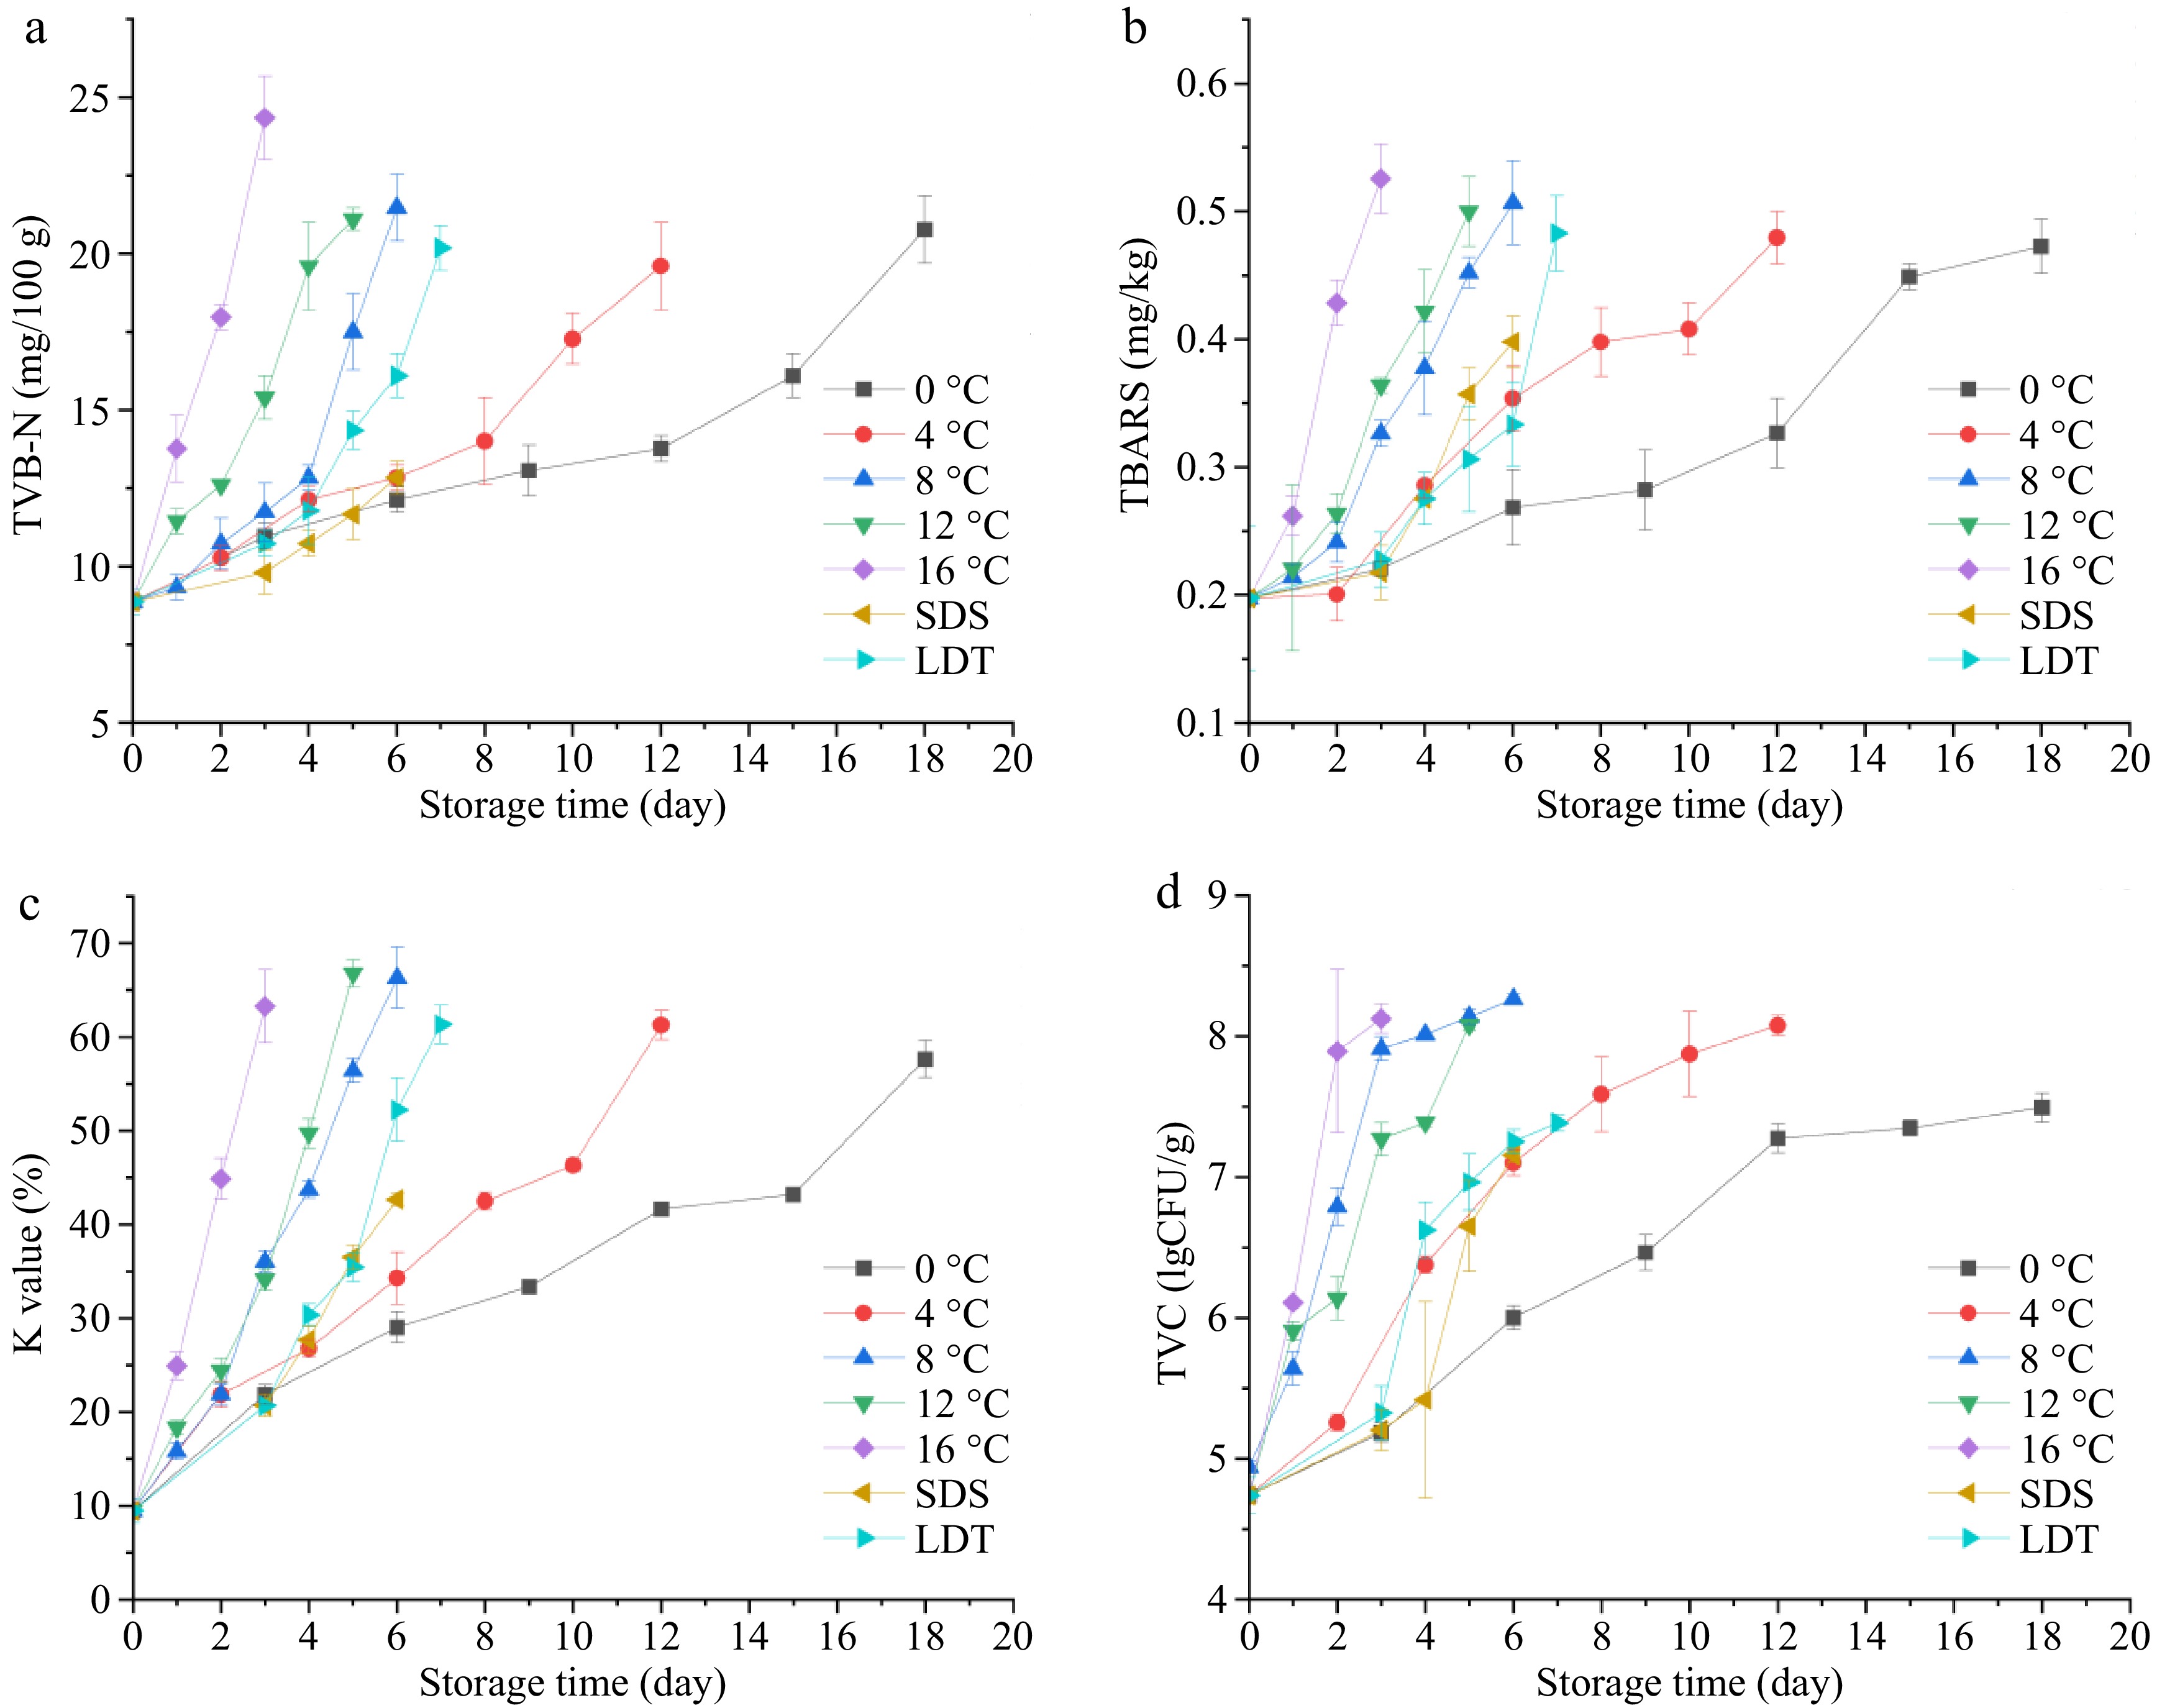
Figure 1.
Changes of (a) TVB-N, (b) TBARS, (c) K value, and (d) TVC of bighead carp under isothermal conditions (0, 4, 8, 12, and 16 °C) and the simulated cold chains (SDS and LDT cold chains). Note: SDS represents the supermarket direct sales cold chain; LDT represents the long distance transport cold chain.
-
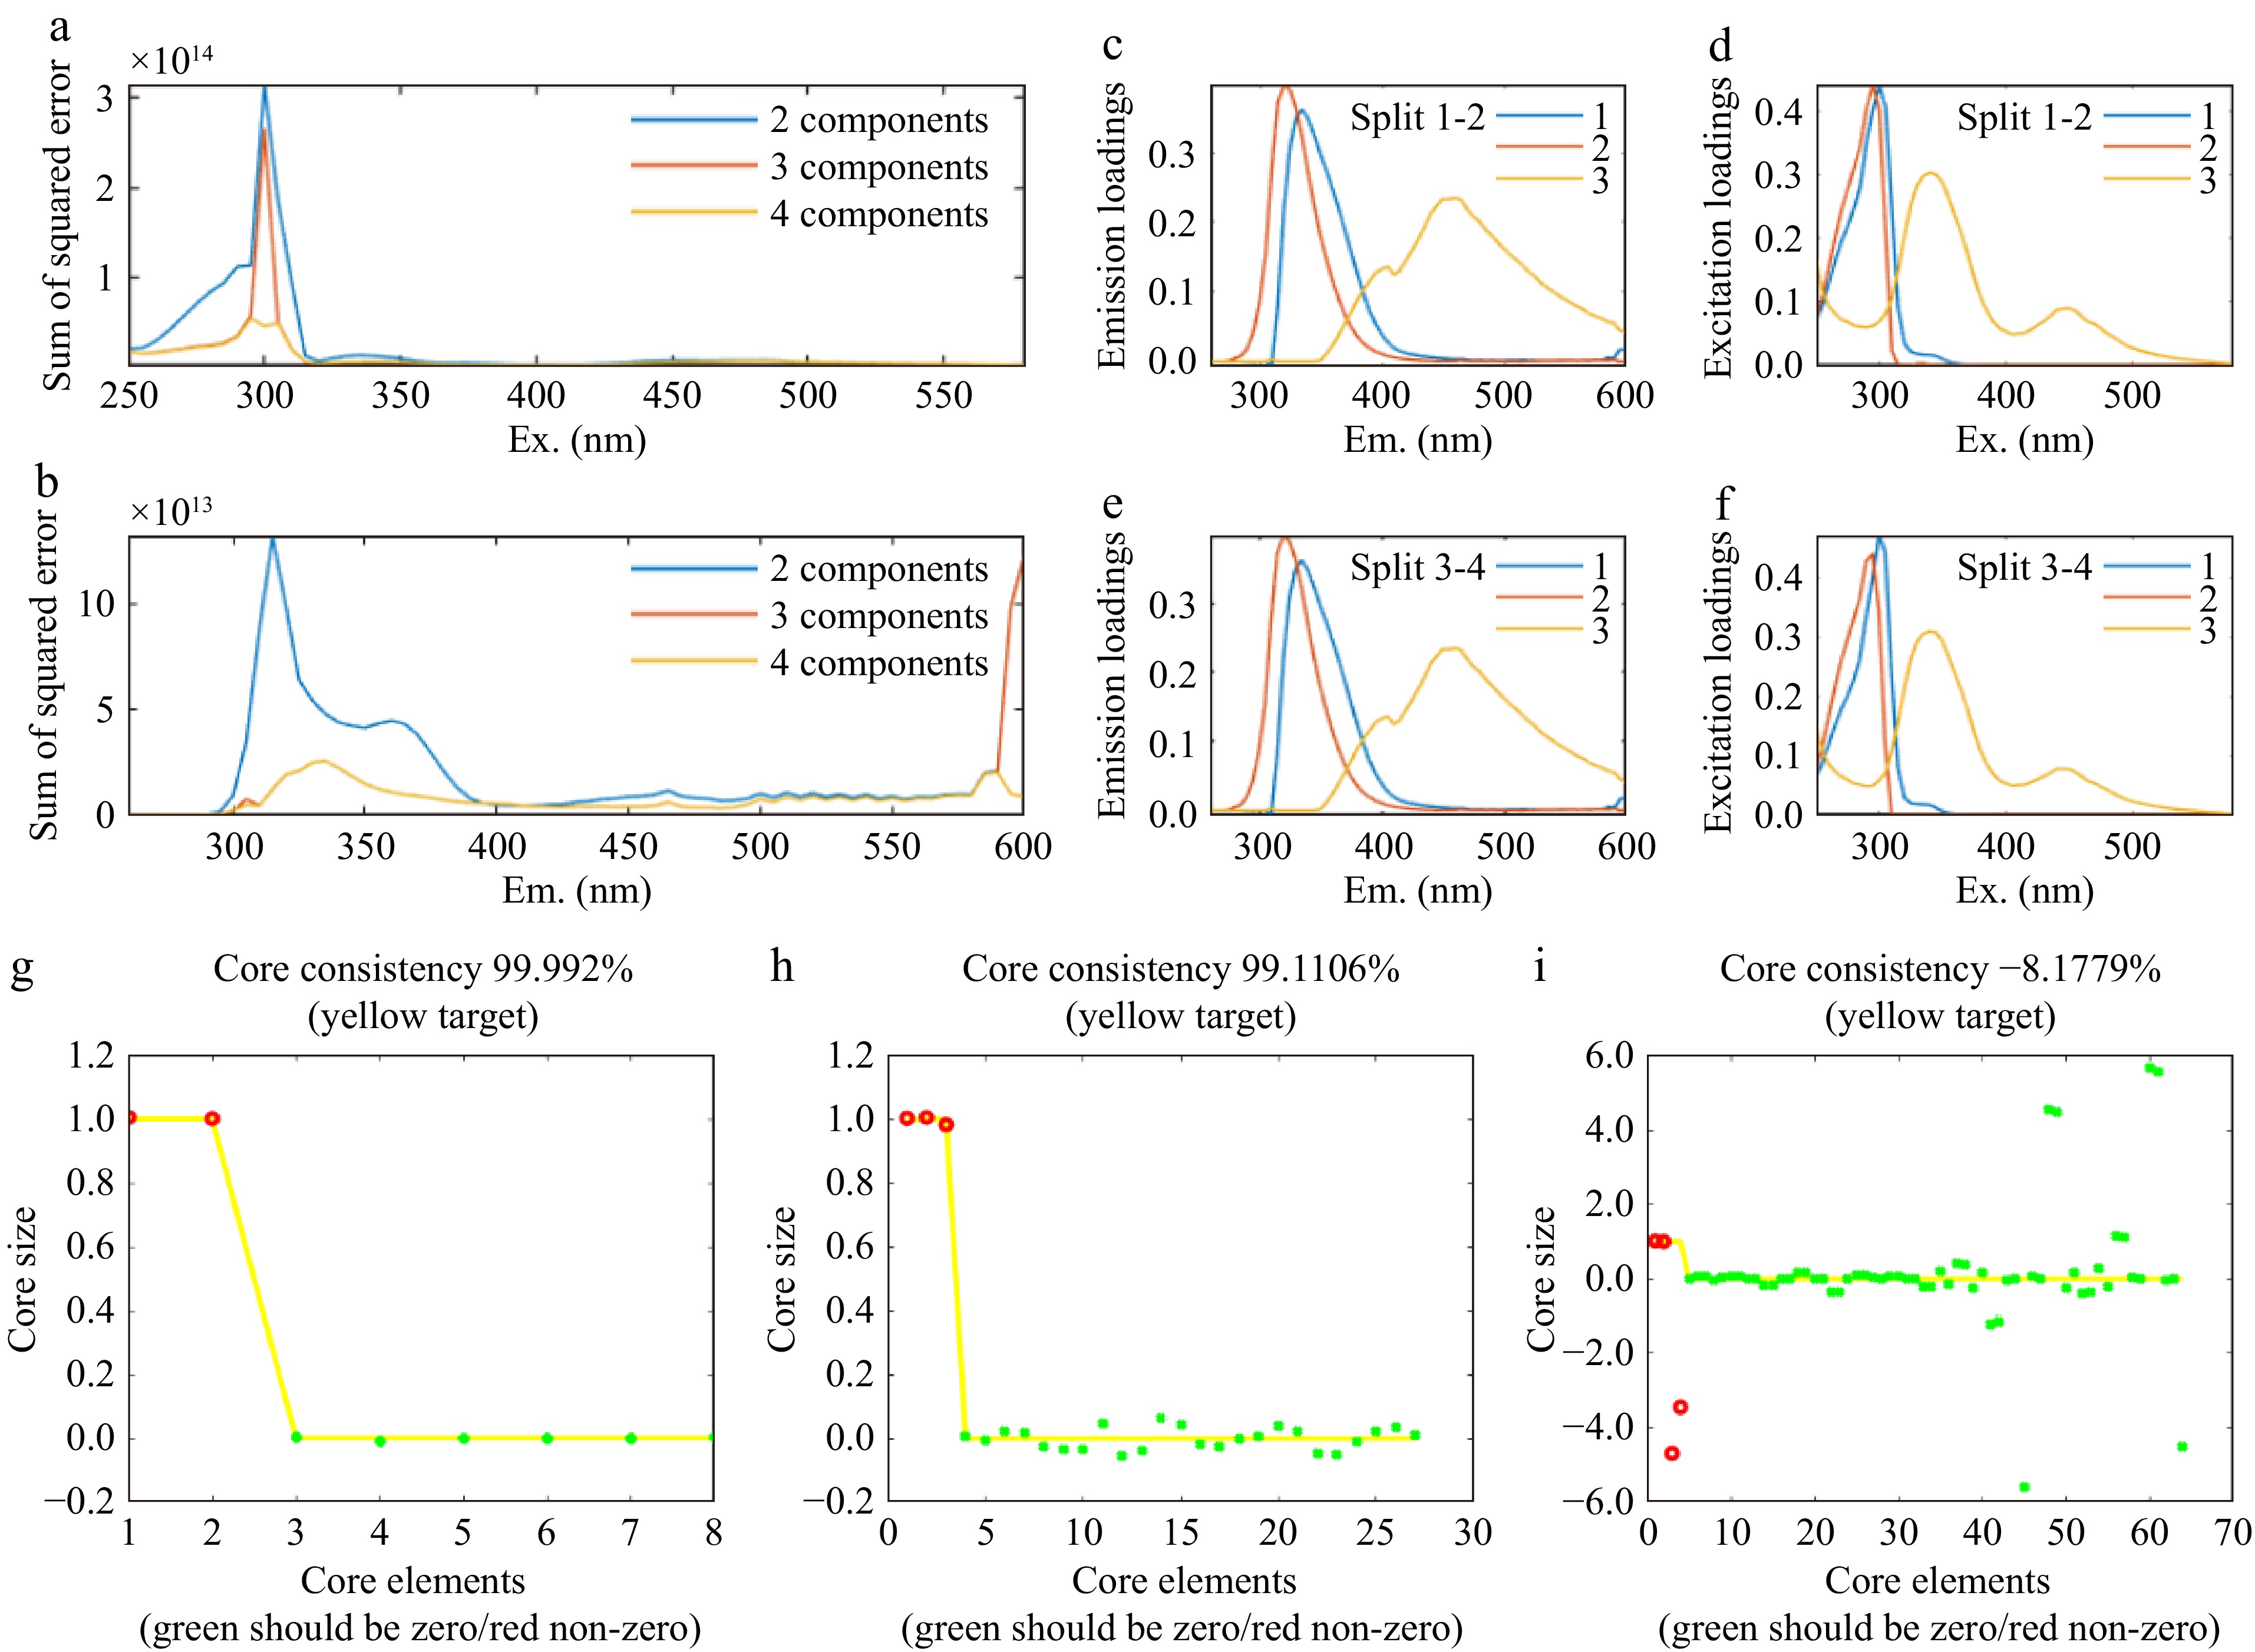
Figure 2.
PARAFAC analysis of fish fillets. The sum of squared error of (a) emission, (b) excitation, and wavelengths corresponding to the 2−4 component model in fish fillets. (c)−(f) Split half analysis for model validation of 3-component in fish fillets. (g) Core consistency diagnostic results of 2 components, (h) 3 components, and (i) 4 components in fish fillets. Note: (c)−(f) comparison of the excitation and emission loading changes of two split-half sets of fish fillets excitation emission matrices respectively. (g)−(i) the red dot represents the number of components, while the position of the green dot represents the degree of deviation from the yellow line parallel to the X-axis.
-
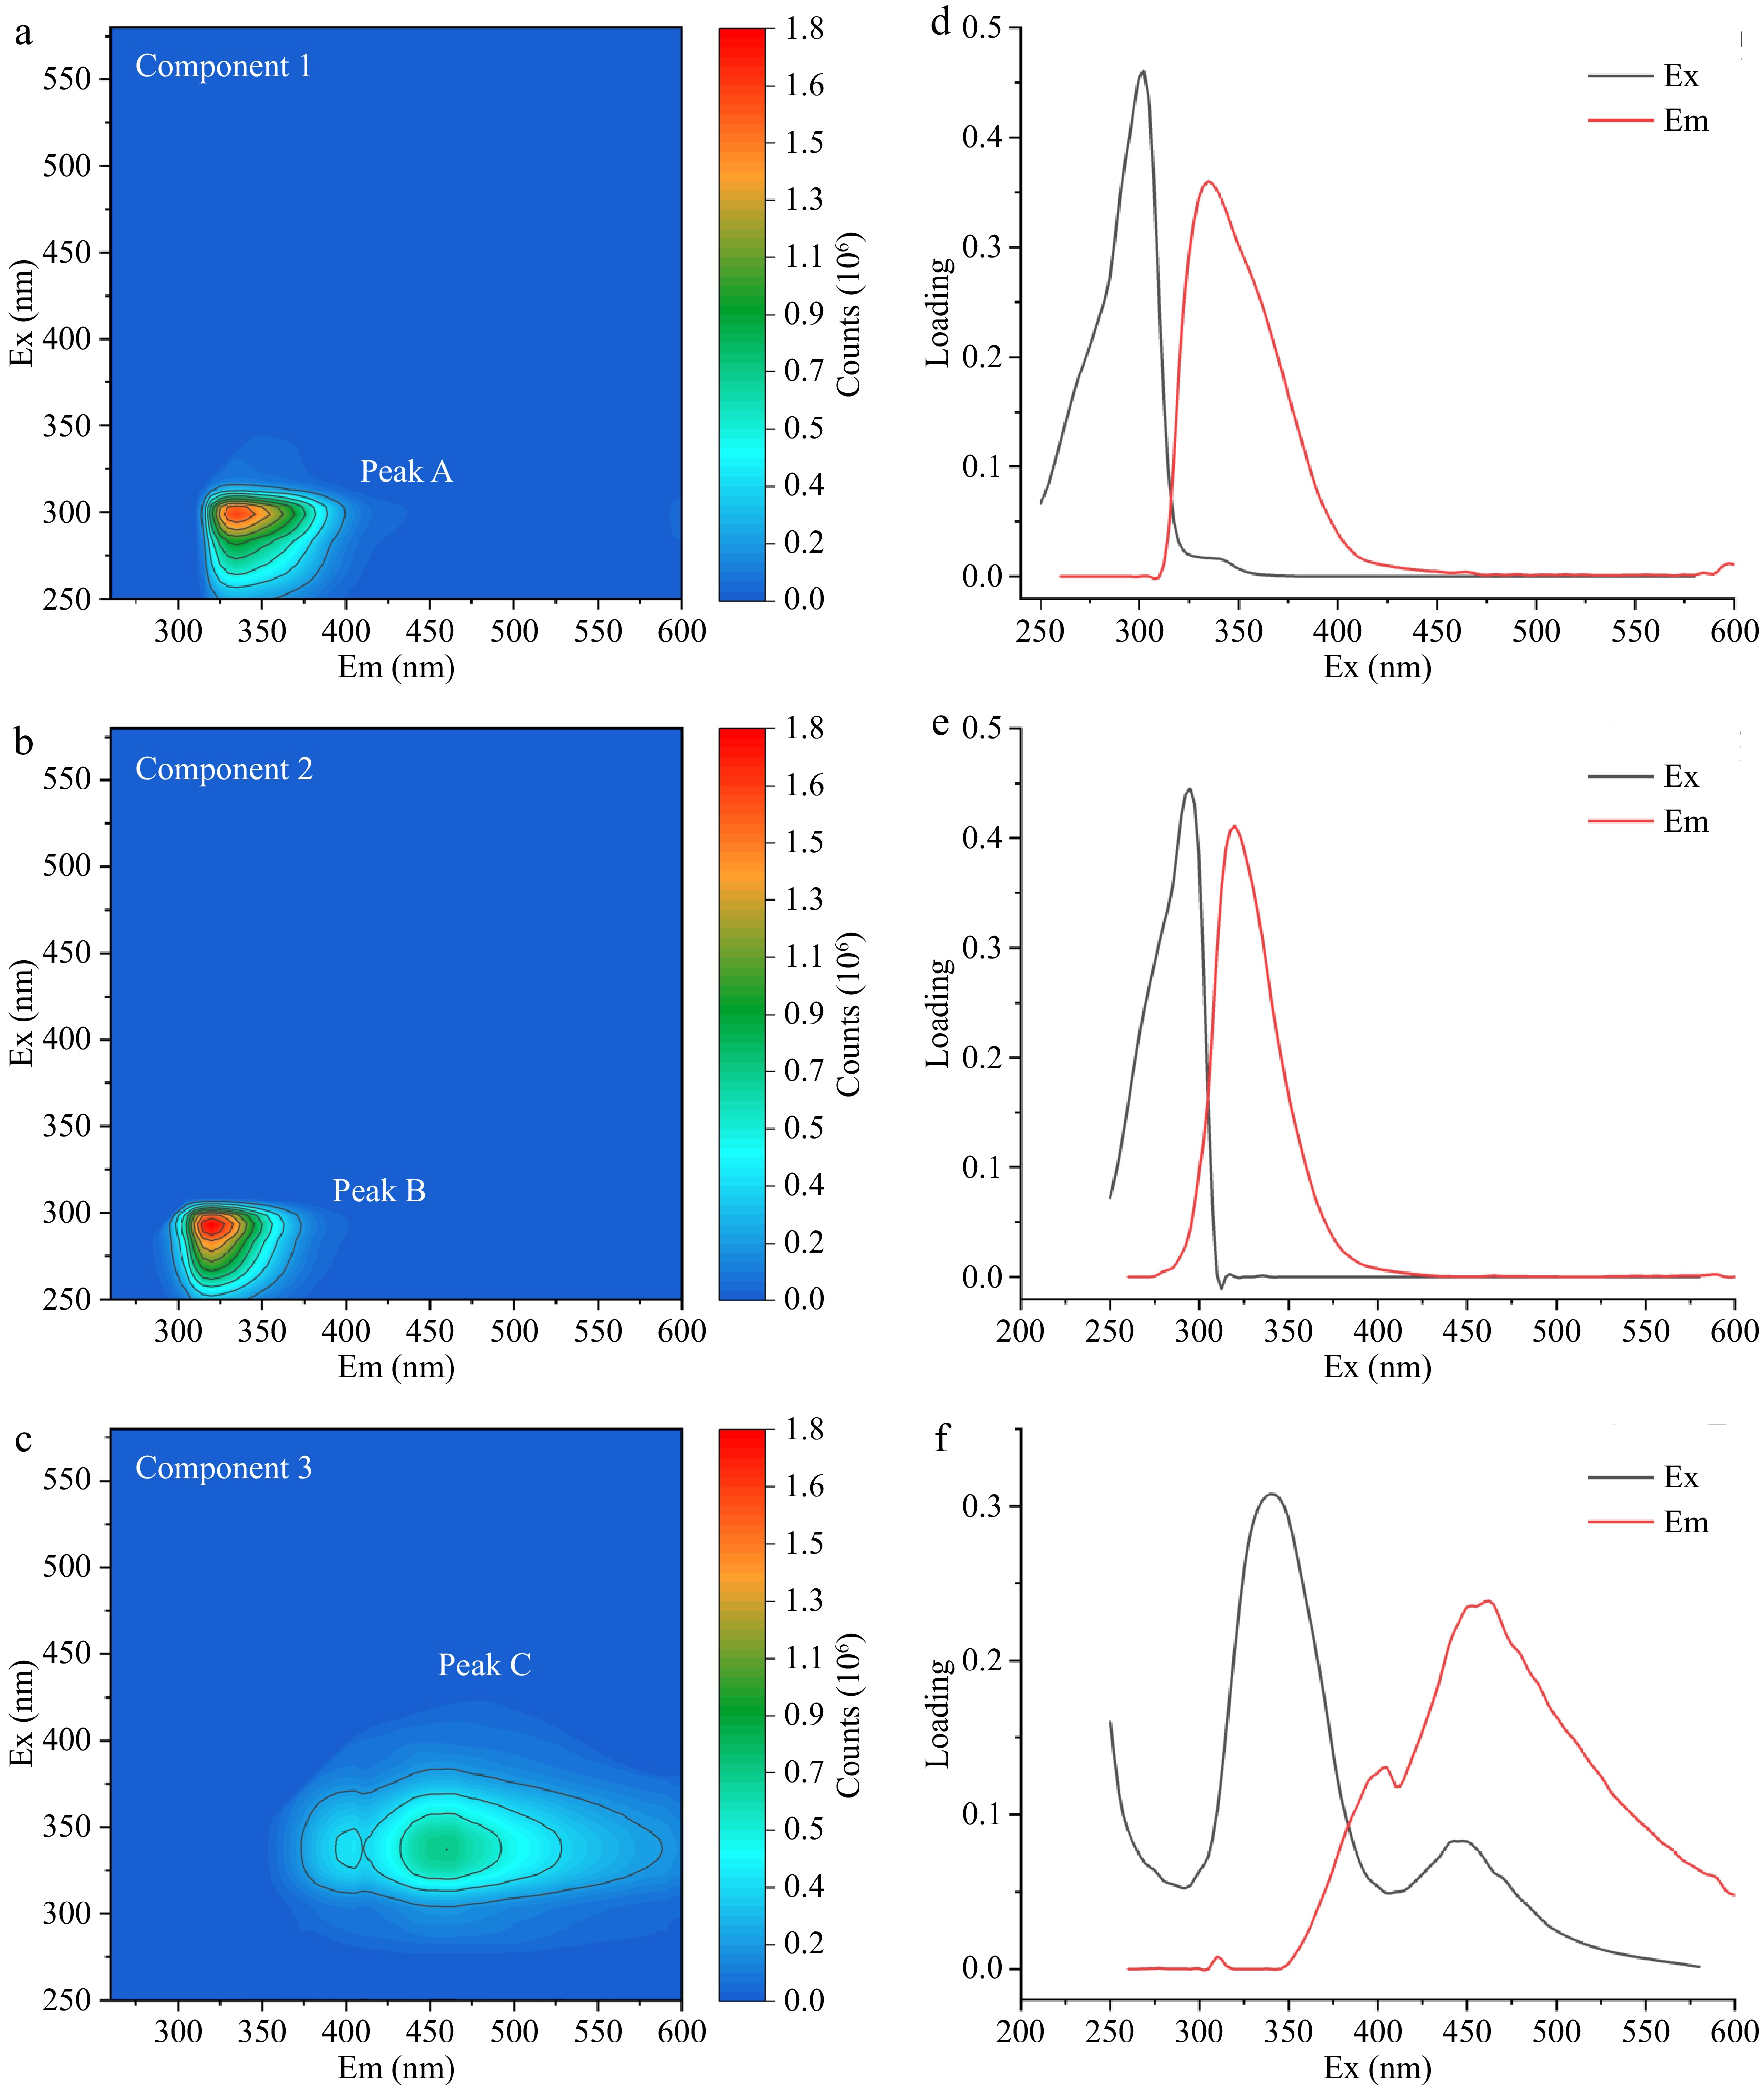
Figure 3.
Three fluorescence components peaks (a) A, (c) B, and (e) C in fish fillets and their corresponding excitation-emission wavelength loading diagram peaks (b) A, (d) B, and (f) C.
-
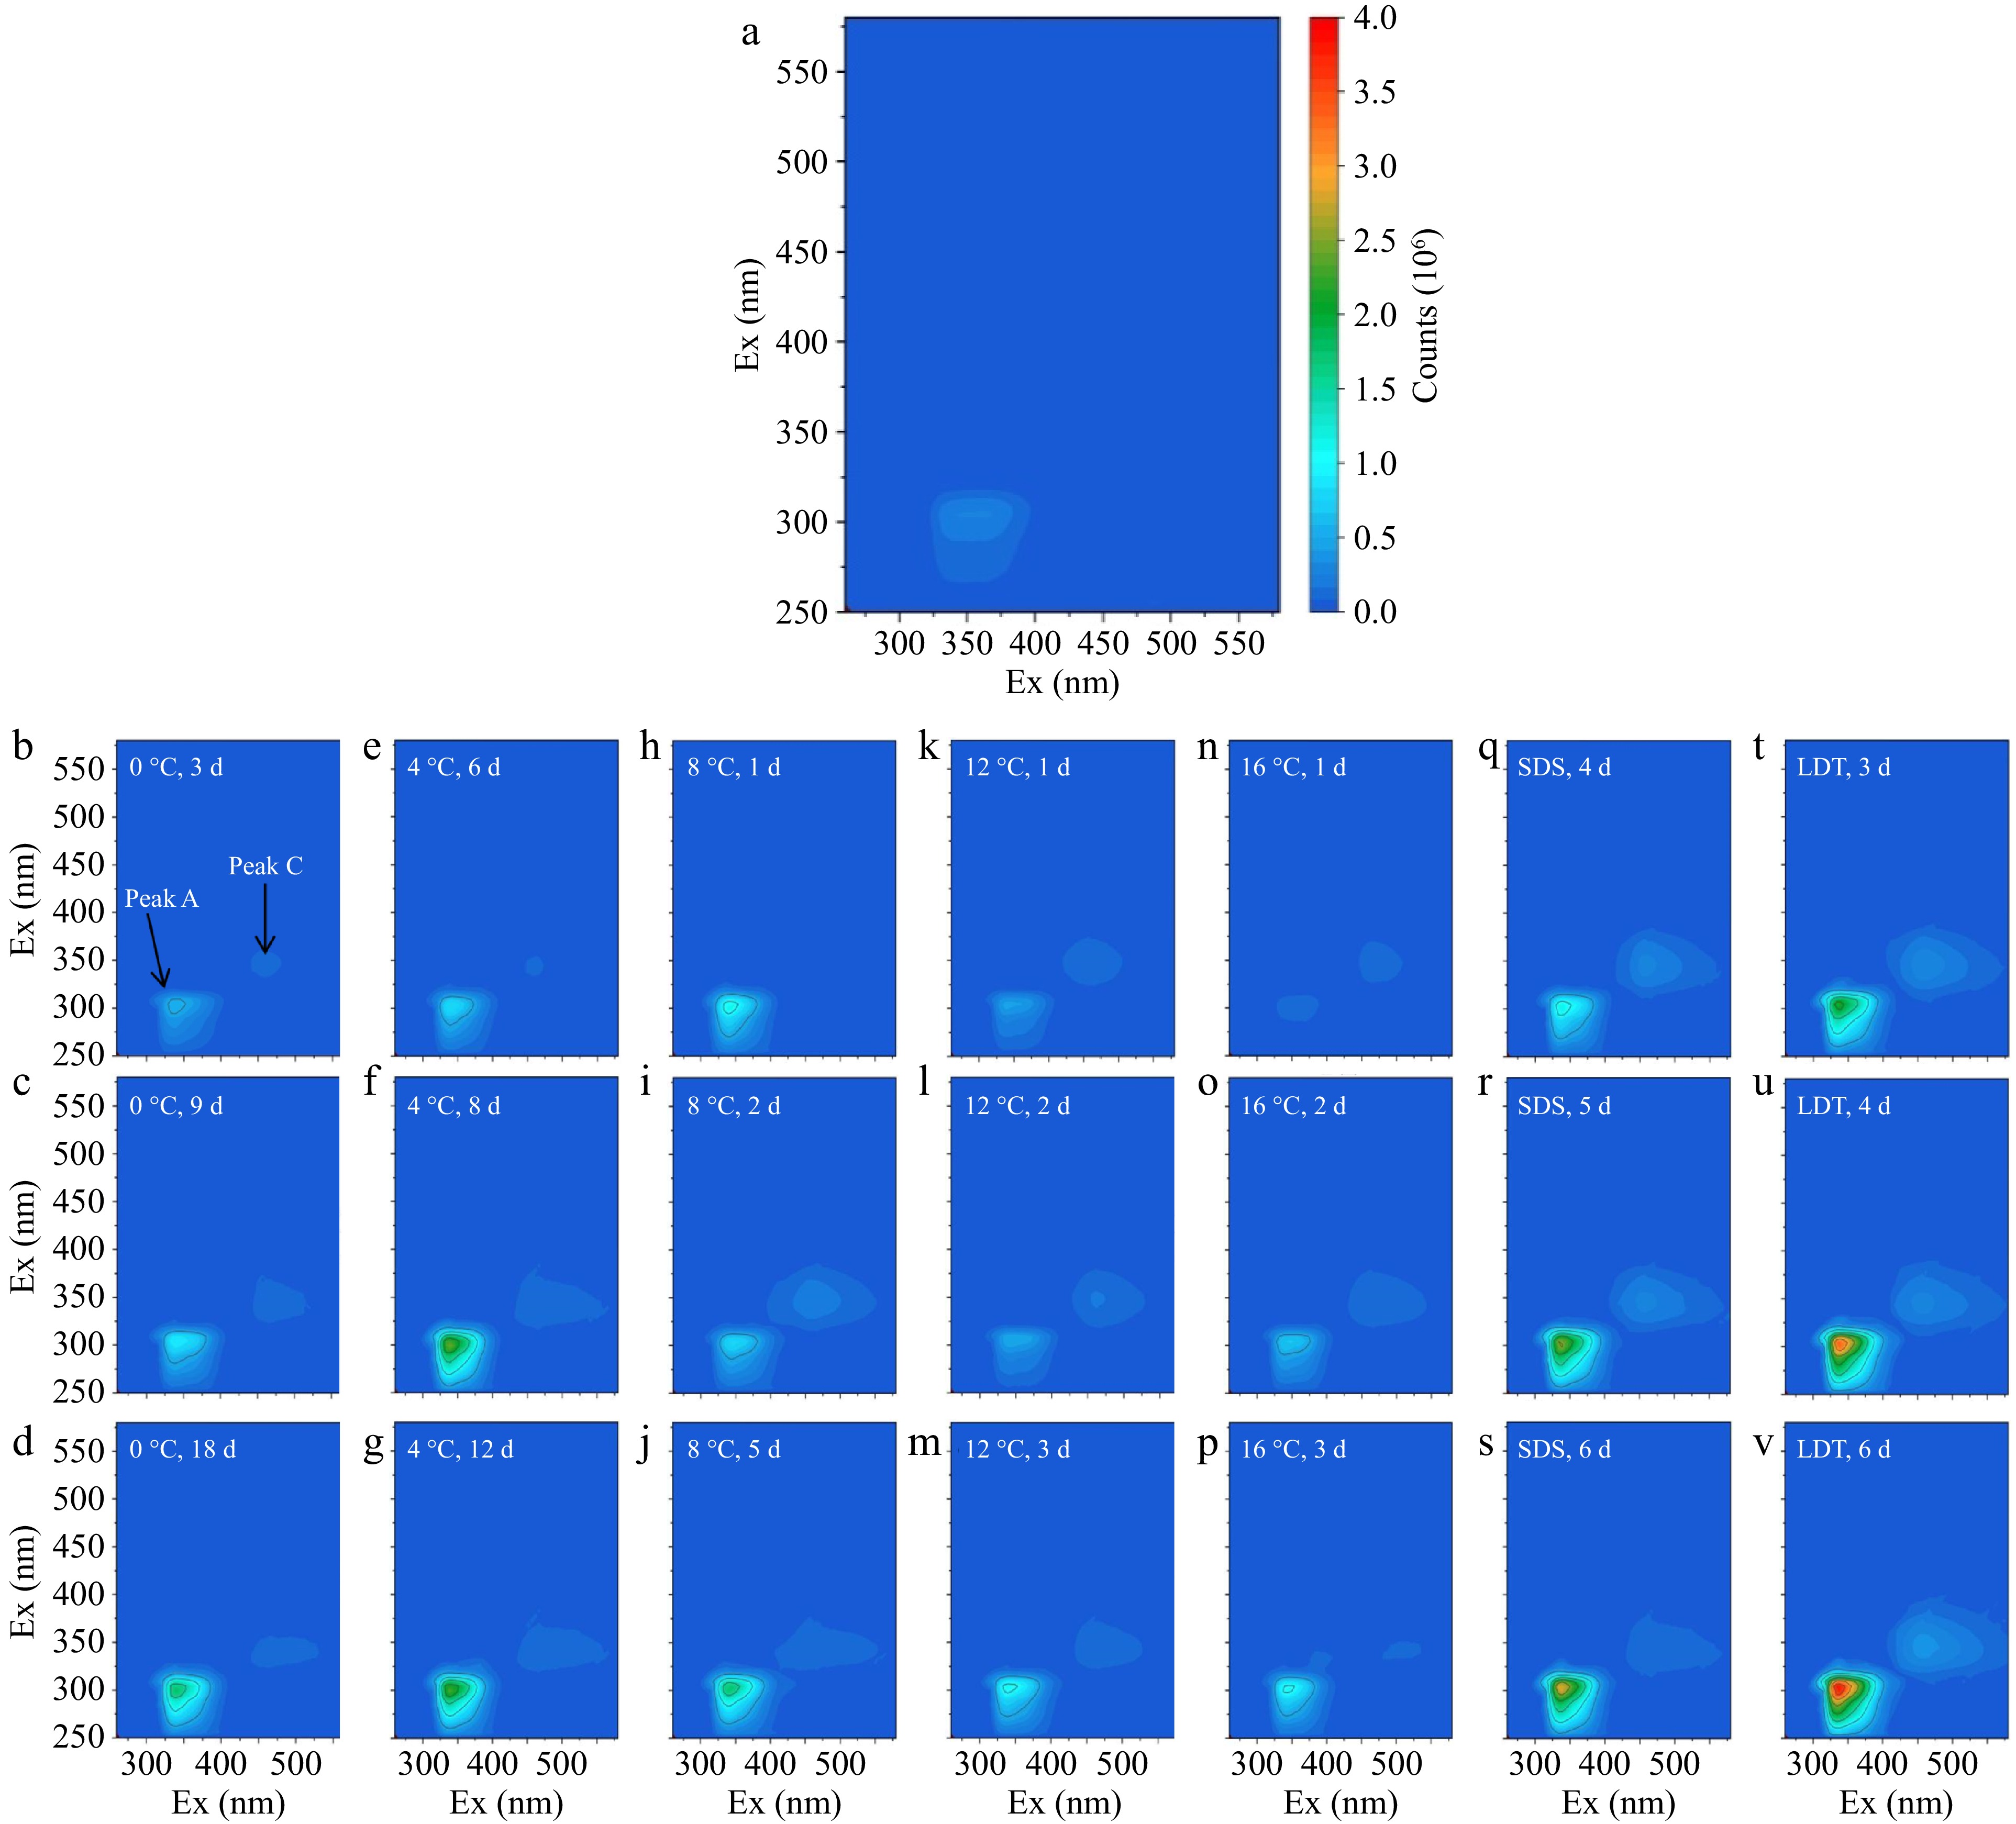
Figure 4.
Changes of fluorescent components in fish fillets under (a)−(p) different storage conditions (0, 4, 8, 12, and 16 °C), storage conditions in the (q)−(s) SDS, and (t)−(v) LDT cold chain.
-
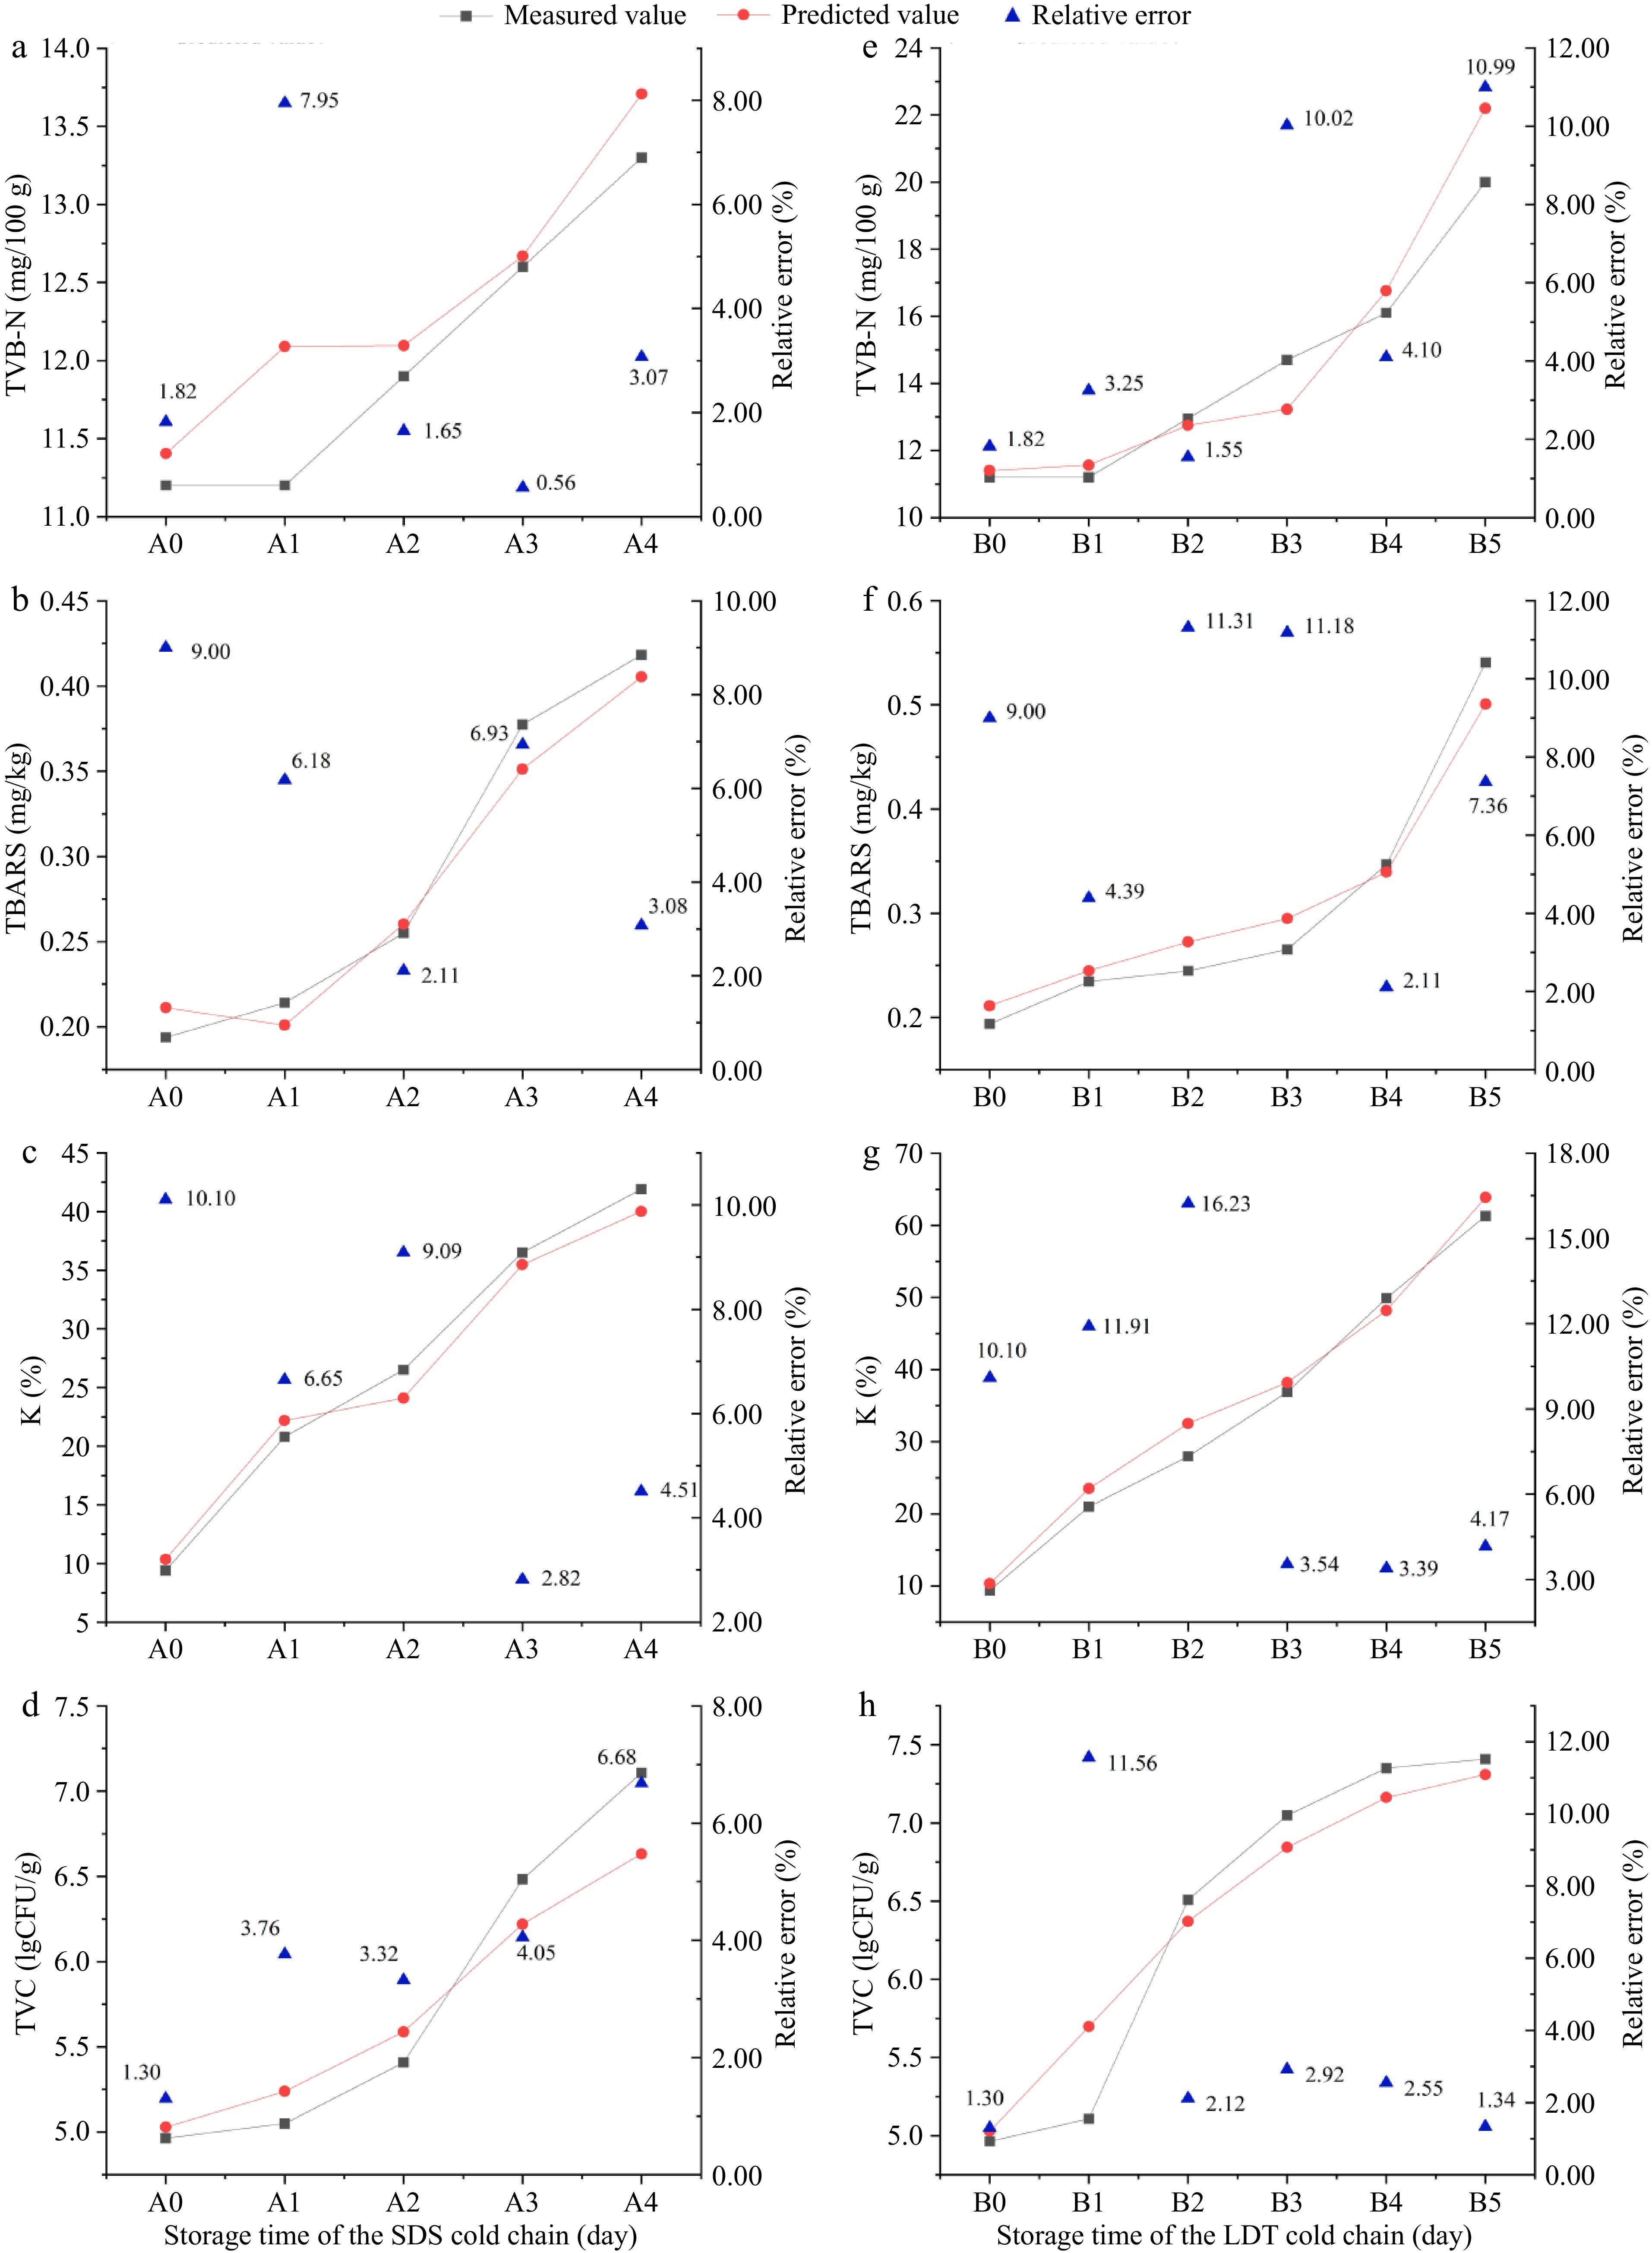
Figure 5.
Prediction of TVB-N, TBARS, K, and TVC values by the EM-LSTM model based on fish fillets in the (a)−(d) SDS, and (e)−(h) LDT cold chains. Note: A0, A1, A2, A3, and A4 in the figure correspond to five storage time points in the SDS cold chain respectively; B0, B1, B2, B3, B4, and B5 correspond to six storage time points in the LDT cold chain respectively.
-
Indicators R2 RMSE MAE MAPE MRE (%) TVB-N 0.8840 0.8887 0.6241 0.0425 4.25 TBARS 0.9581 0.0214 0.0188 0.0660 6.60 K value 0.9801 2.1773 1.9282 0.0750 7.50 TVC 0.9224 0.2740 0.2233 0.0372 3.72 R2, coefficient of determination; RMSE, root mean square error; MAE, mean absolute error; MAPE, mean absolute percentage error; MRE, mean relative error. Table 1.
Performance evaluation of four freshness indexes of bighead carp head predicted based on EEM-LSTM freshness prediction model of fish flesh in the SDS and LDT cold chains.
Figures
(5)
Tables
(1)