-
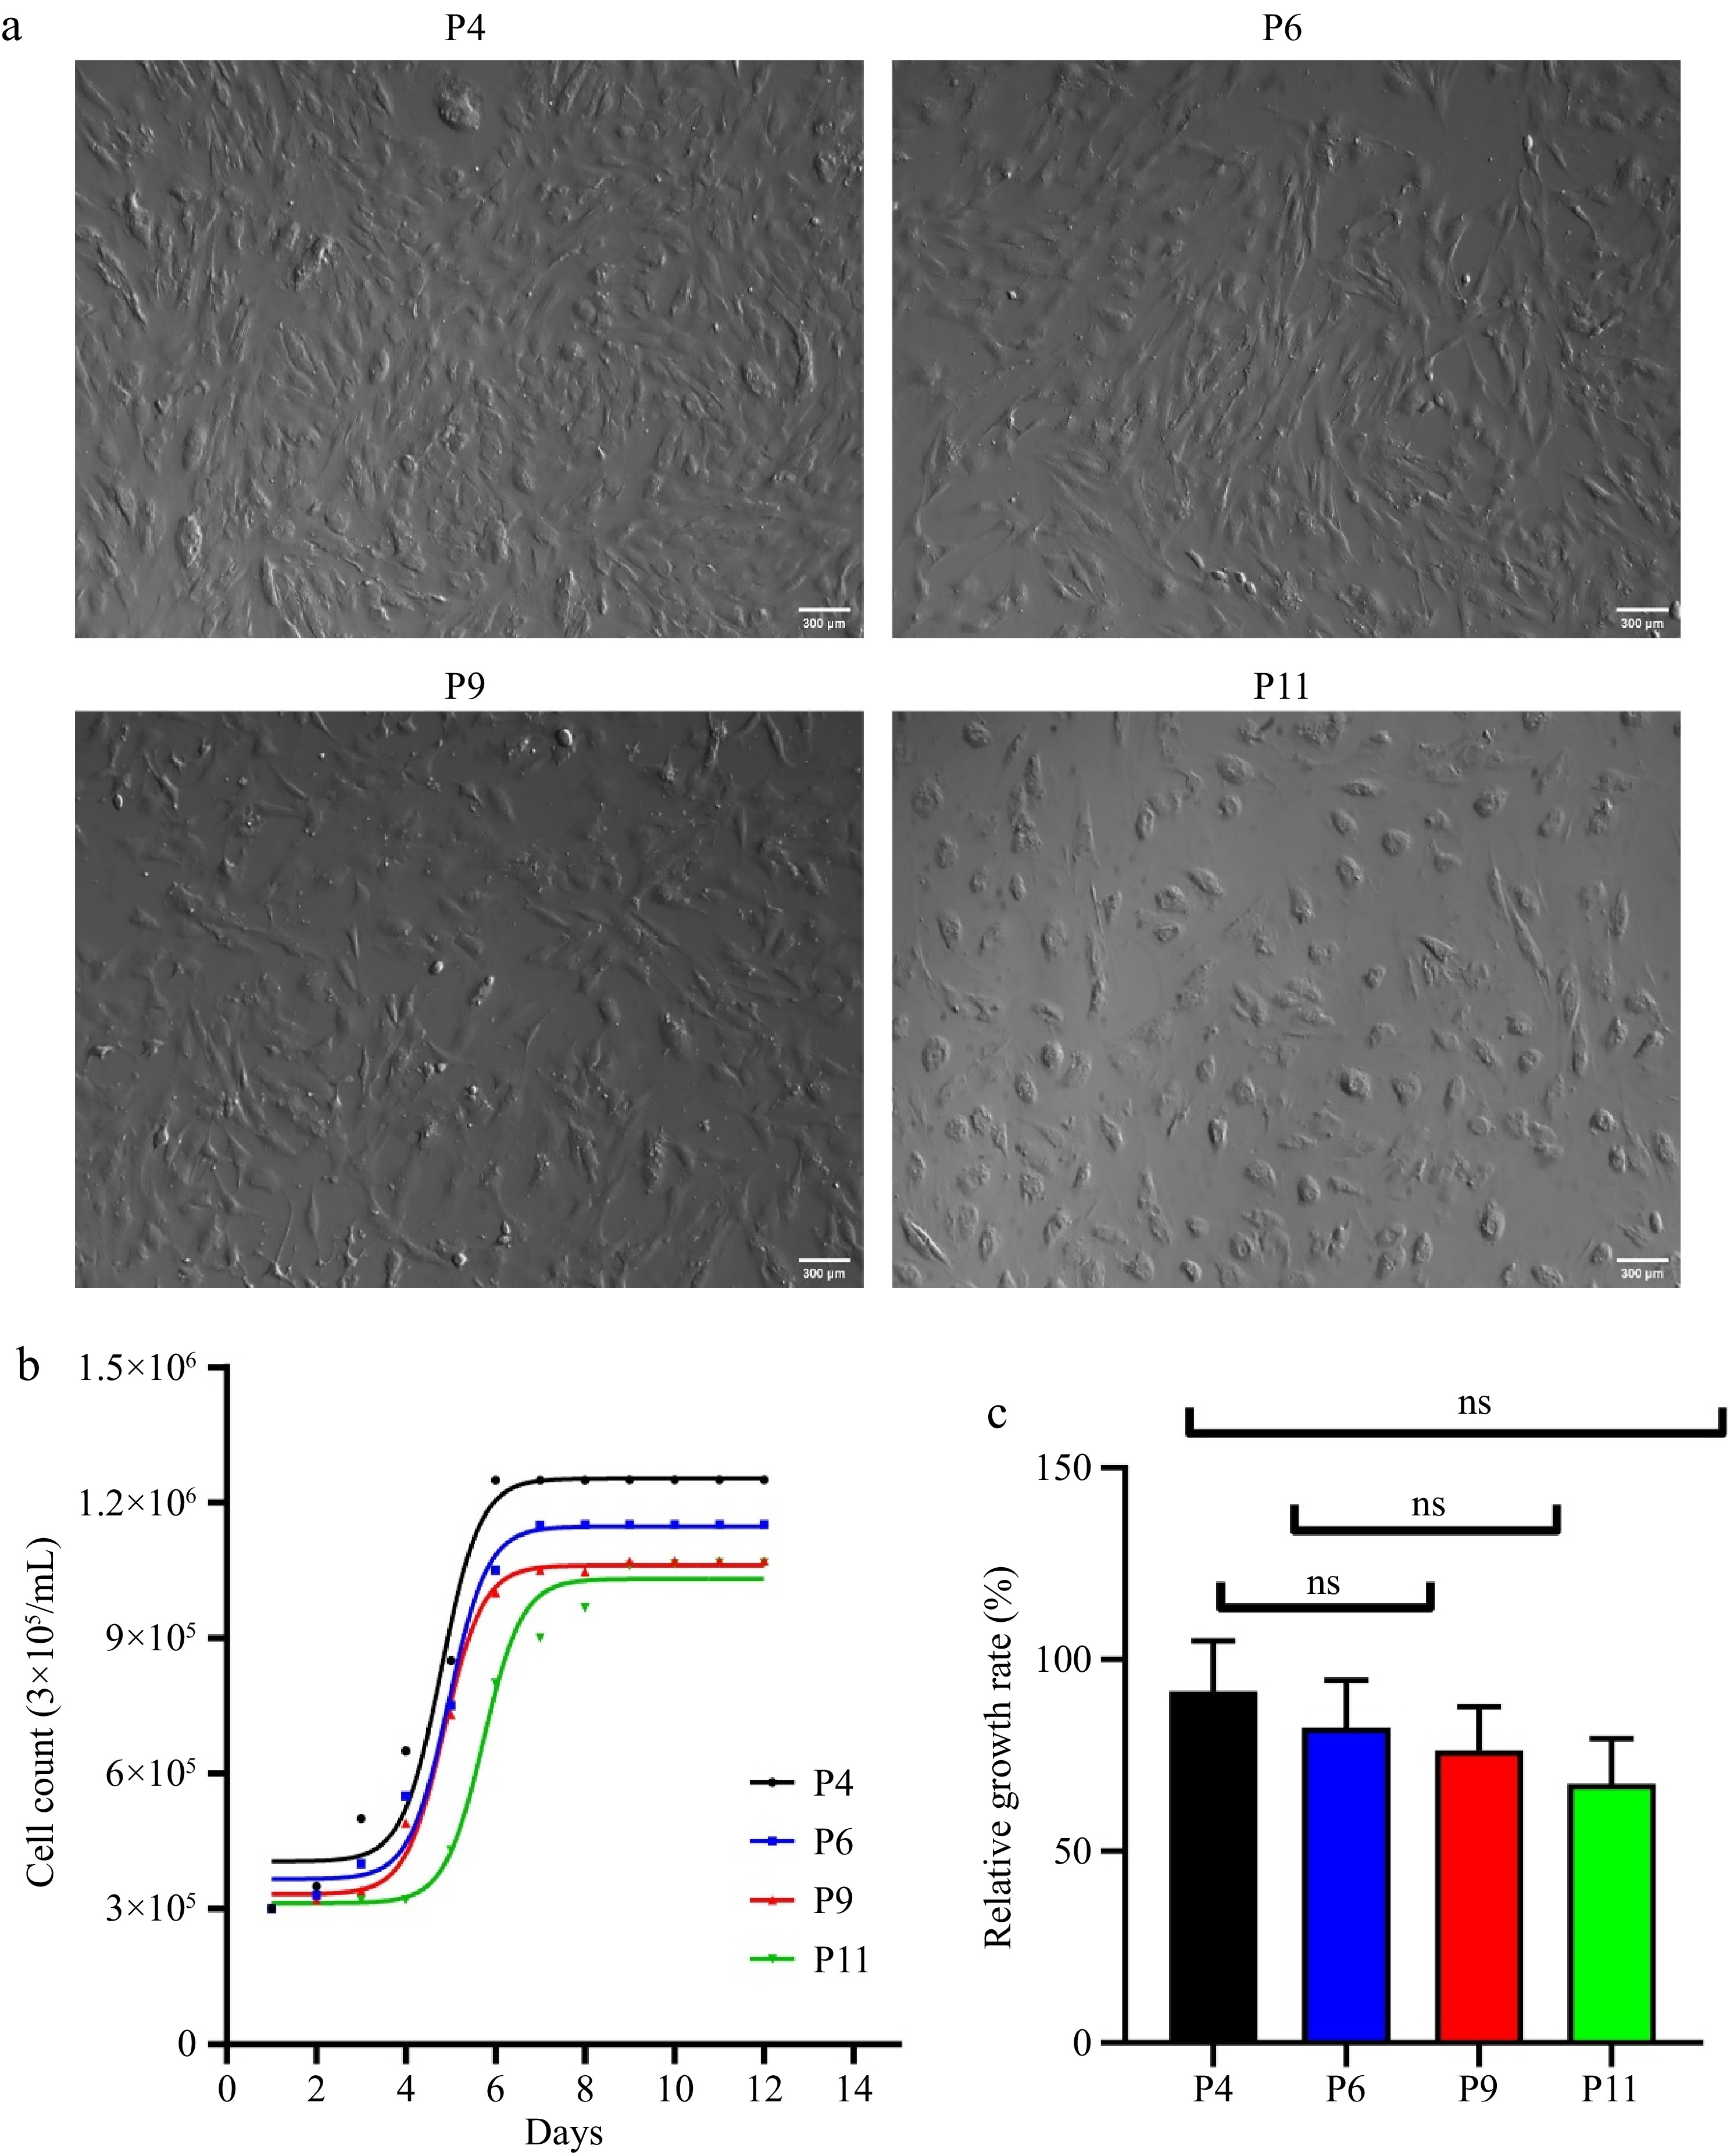
Figure 1.
Developmental status of pUC-MSC. (a) Cell morphology of pUC-MSC cultured at different passages (× 100) (bar = 300 μm); (b) Growth curve of pUC-MSC at passages 3, 6, and 9; (c) Relative growth rate. Different symbols (*, **, ***, ns) indicate significant differences among groups (p < 0.05).
-
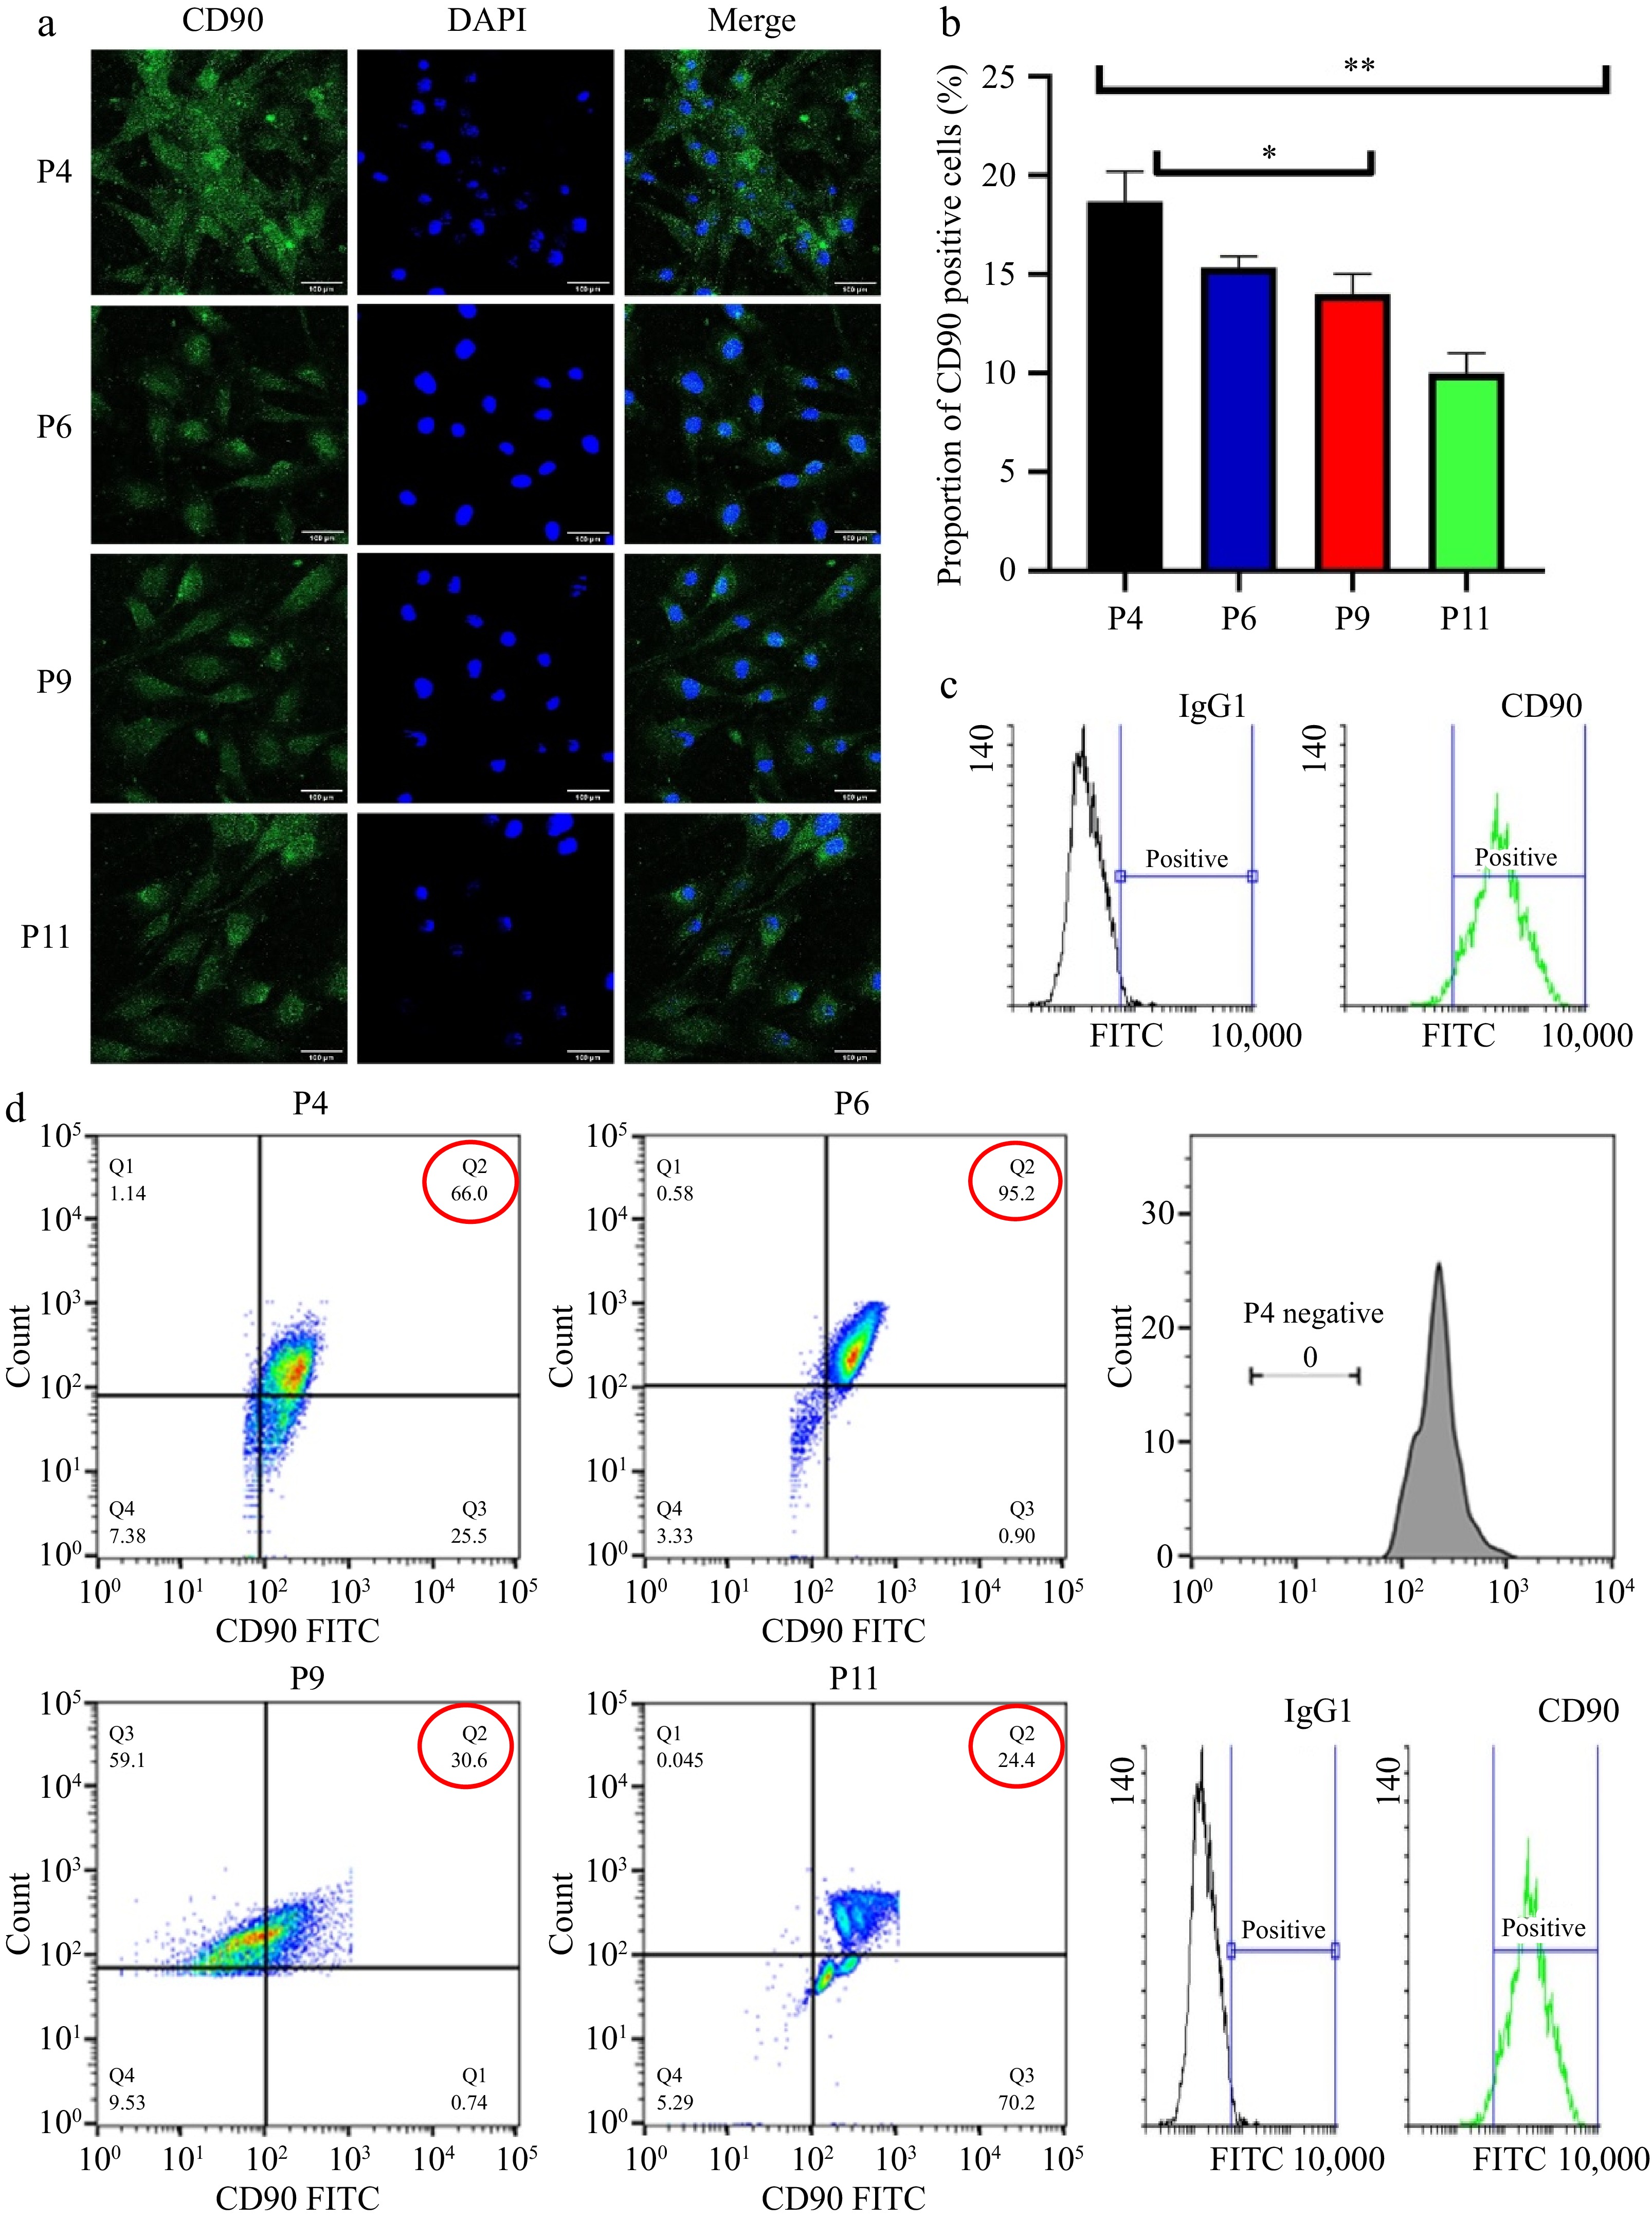
Figure 2.
Characterization pUC-MSC (a) Immunofluorescence and observation of cells incubated with CD90; DAPI is used for nuclear staining (b) Proportion of CD90 positive cells; (c) Flow cytometry for surface antigen marker (bar = 100 μm). Different symbols (*, **, ***, ns) indicate significant differences among groups (p < 0.05). (d) Flow cytometry analysis of pUC-MSCs; Dot-plot analysis expressing positive MSC-specific antigens CD90.
-
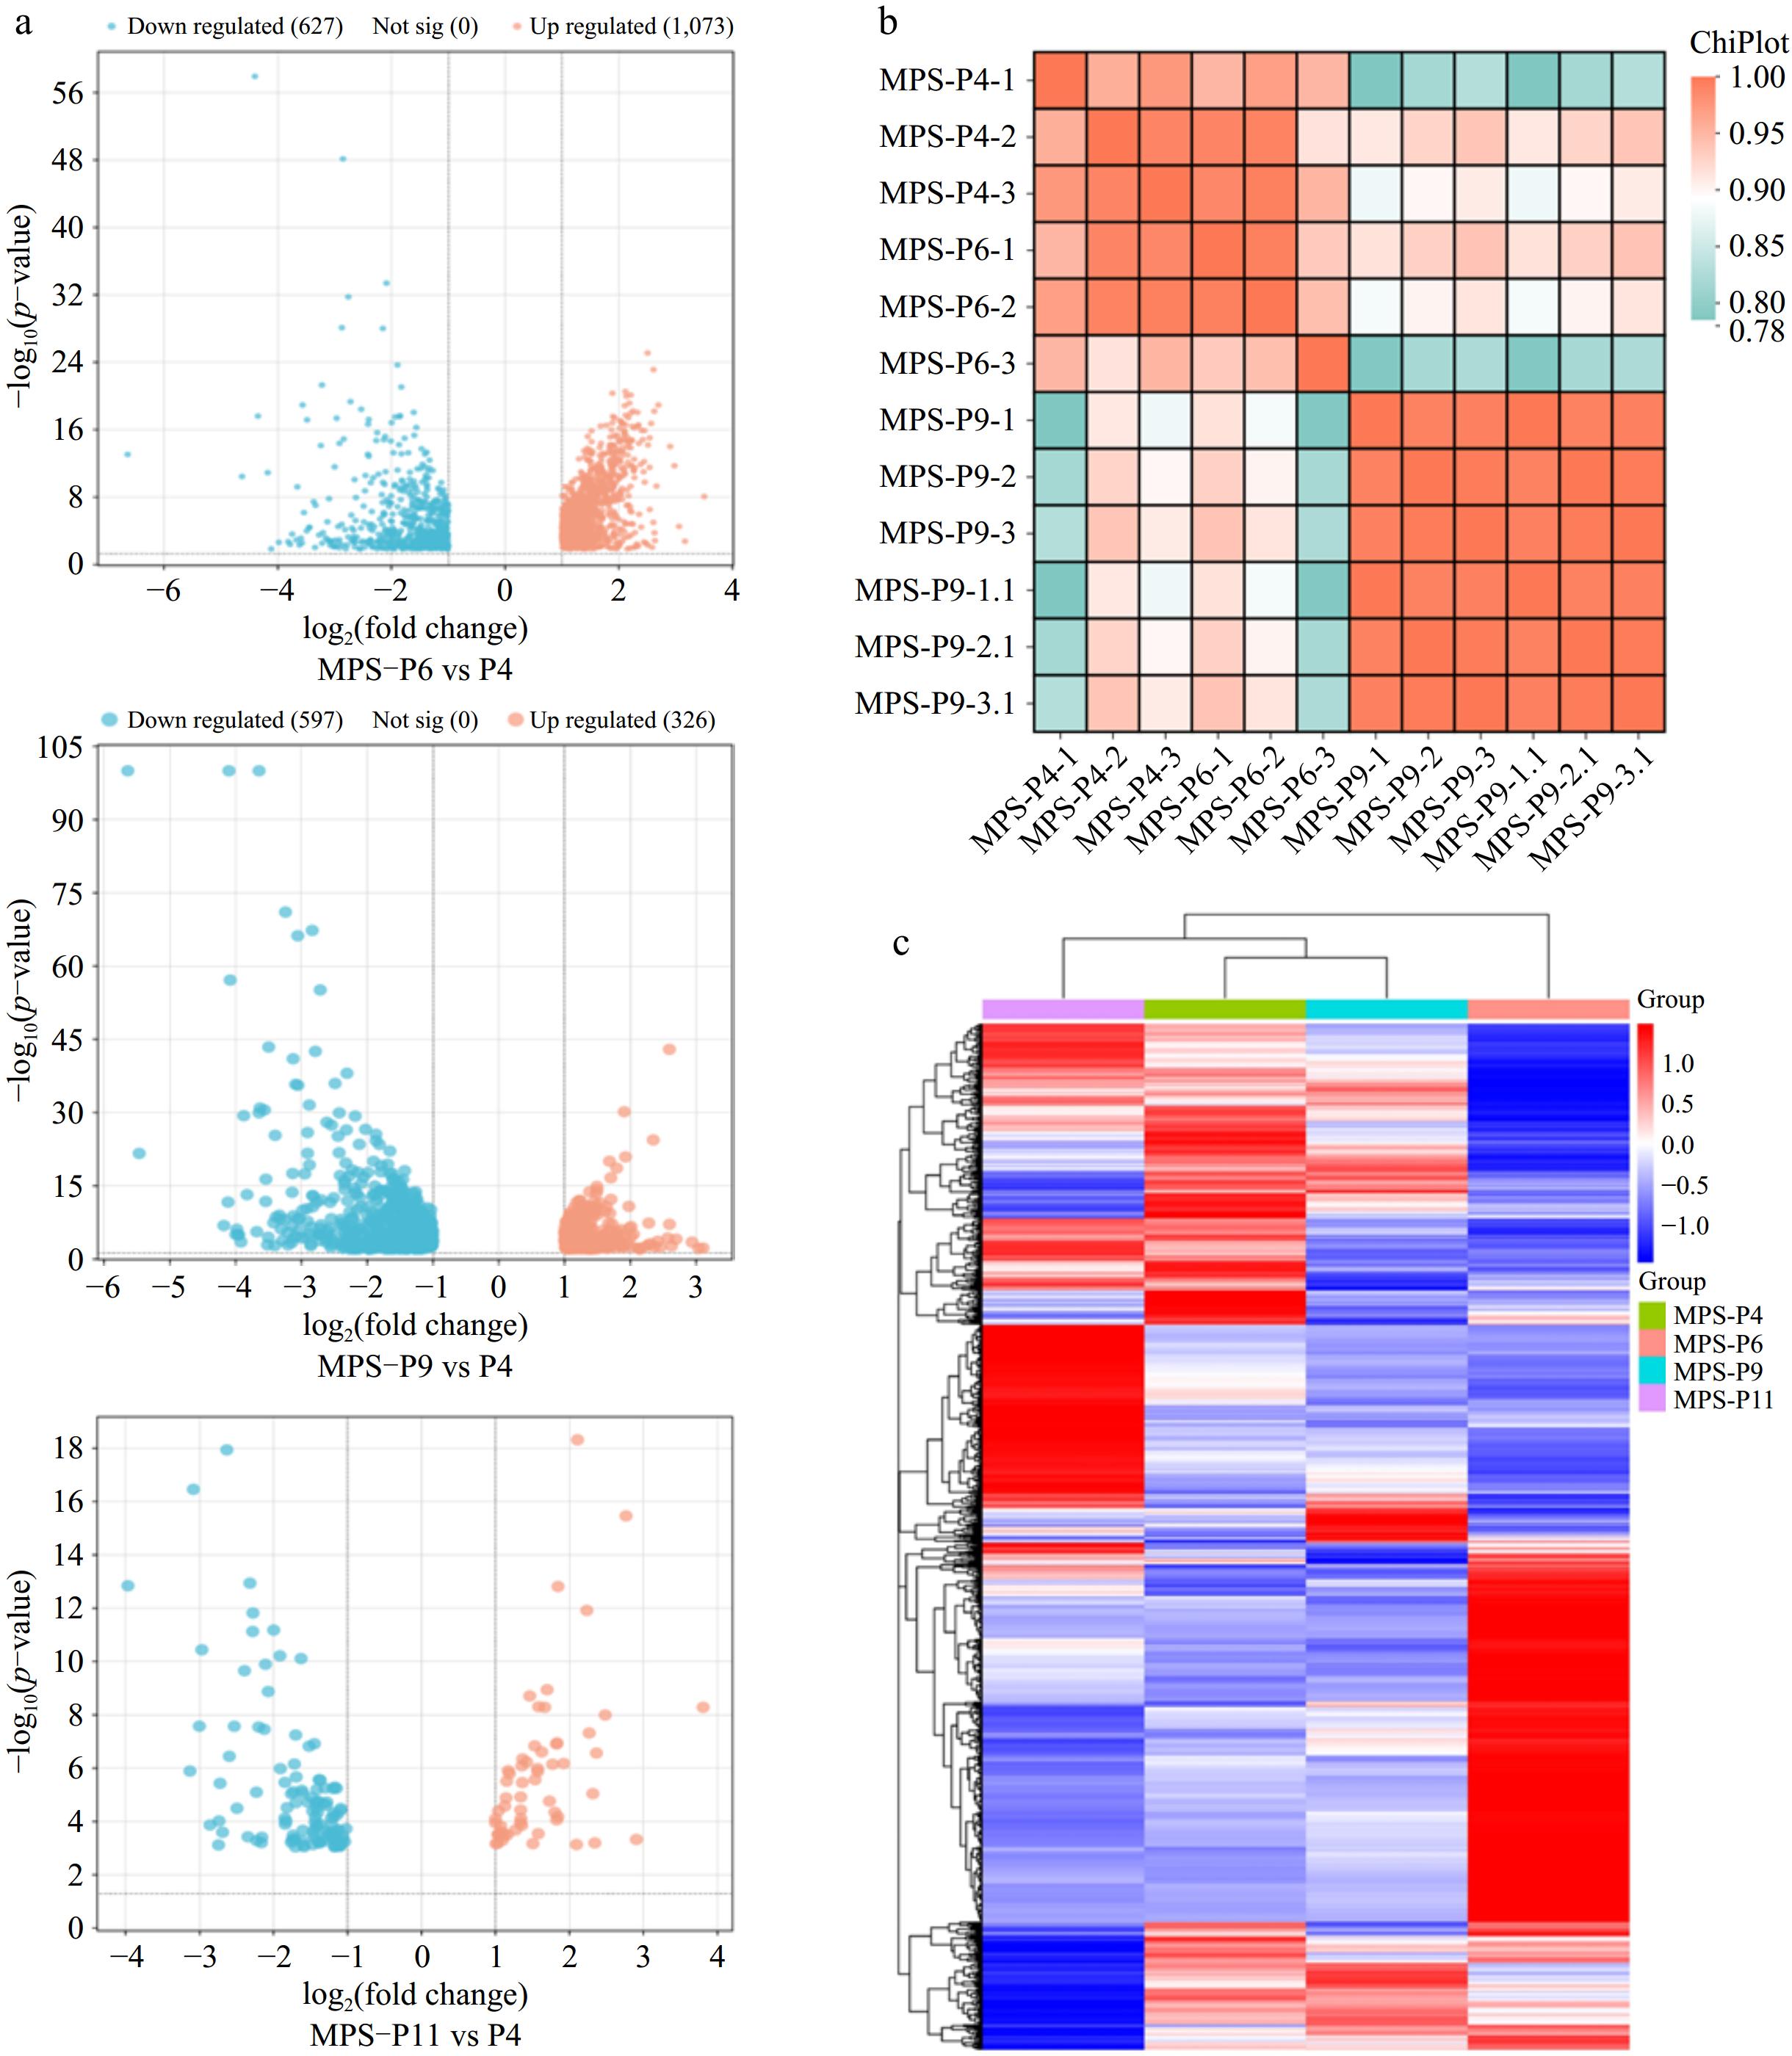
Figure 3.
The overall distribution of transcripts in three data sets. (a) Pearson correlation heatmap showing the correlation between all sample data sets. (b) Volcano plot of significant DEGs detected from three data sets. (c) Heatmaps show the overall distribution of DEGs in respective data sets.
-
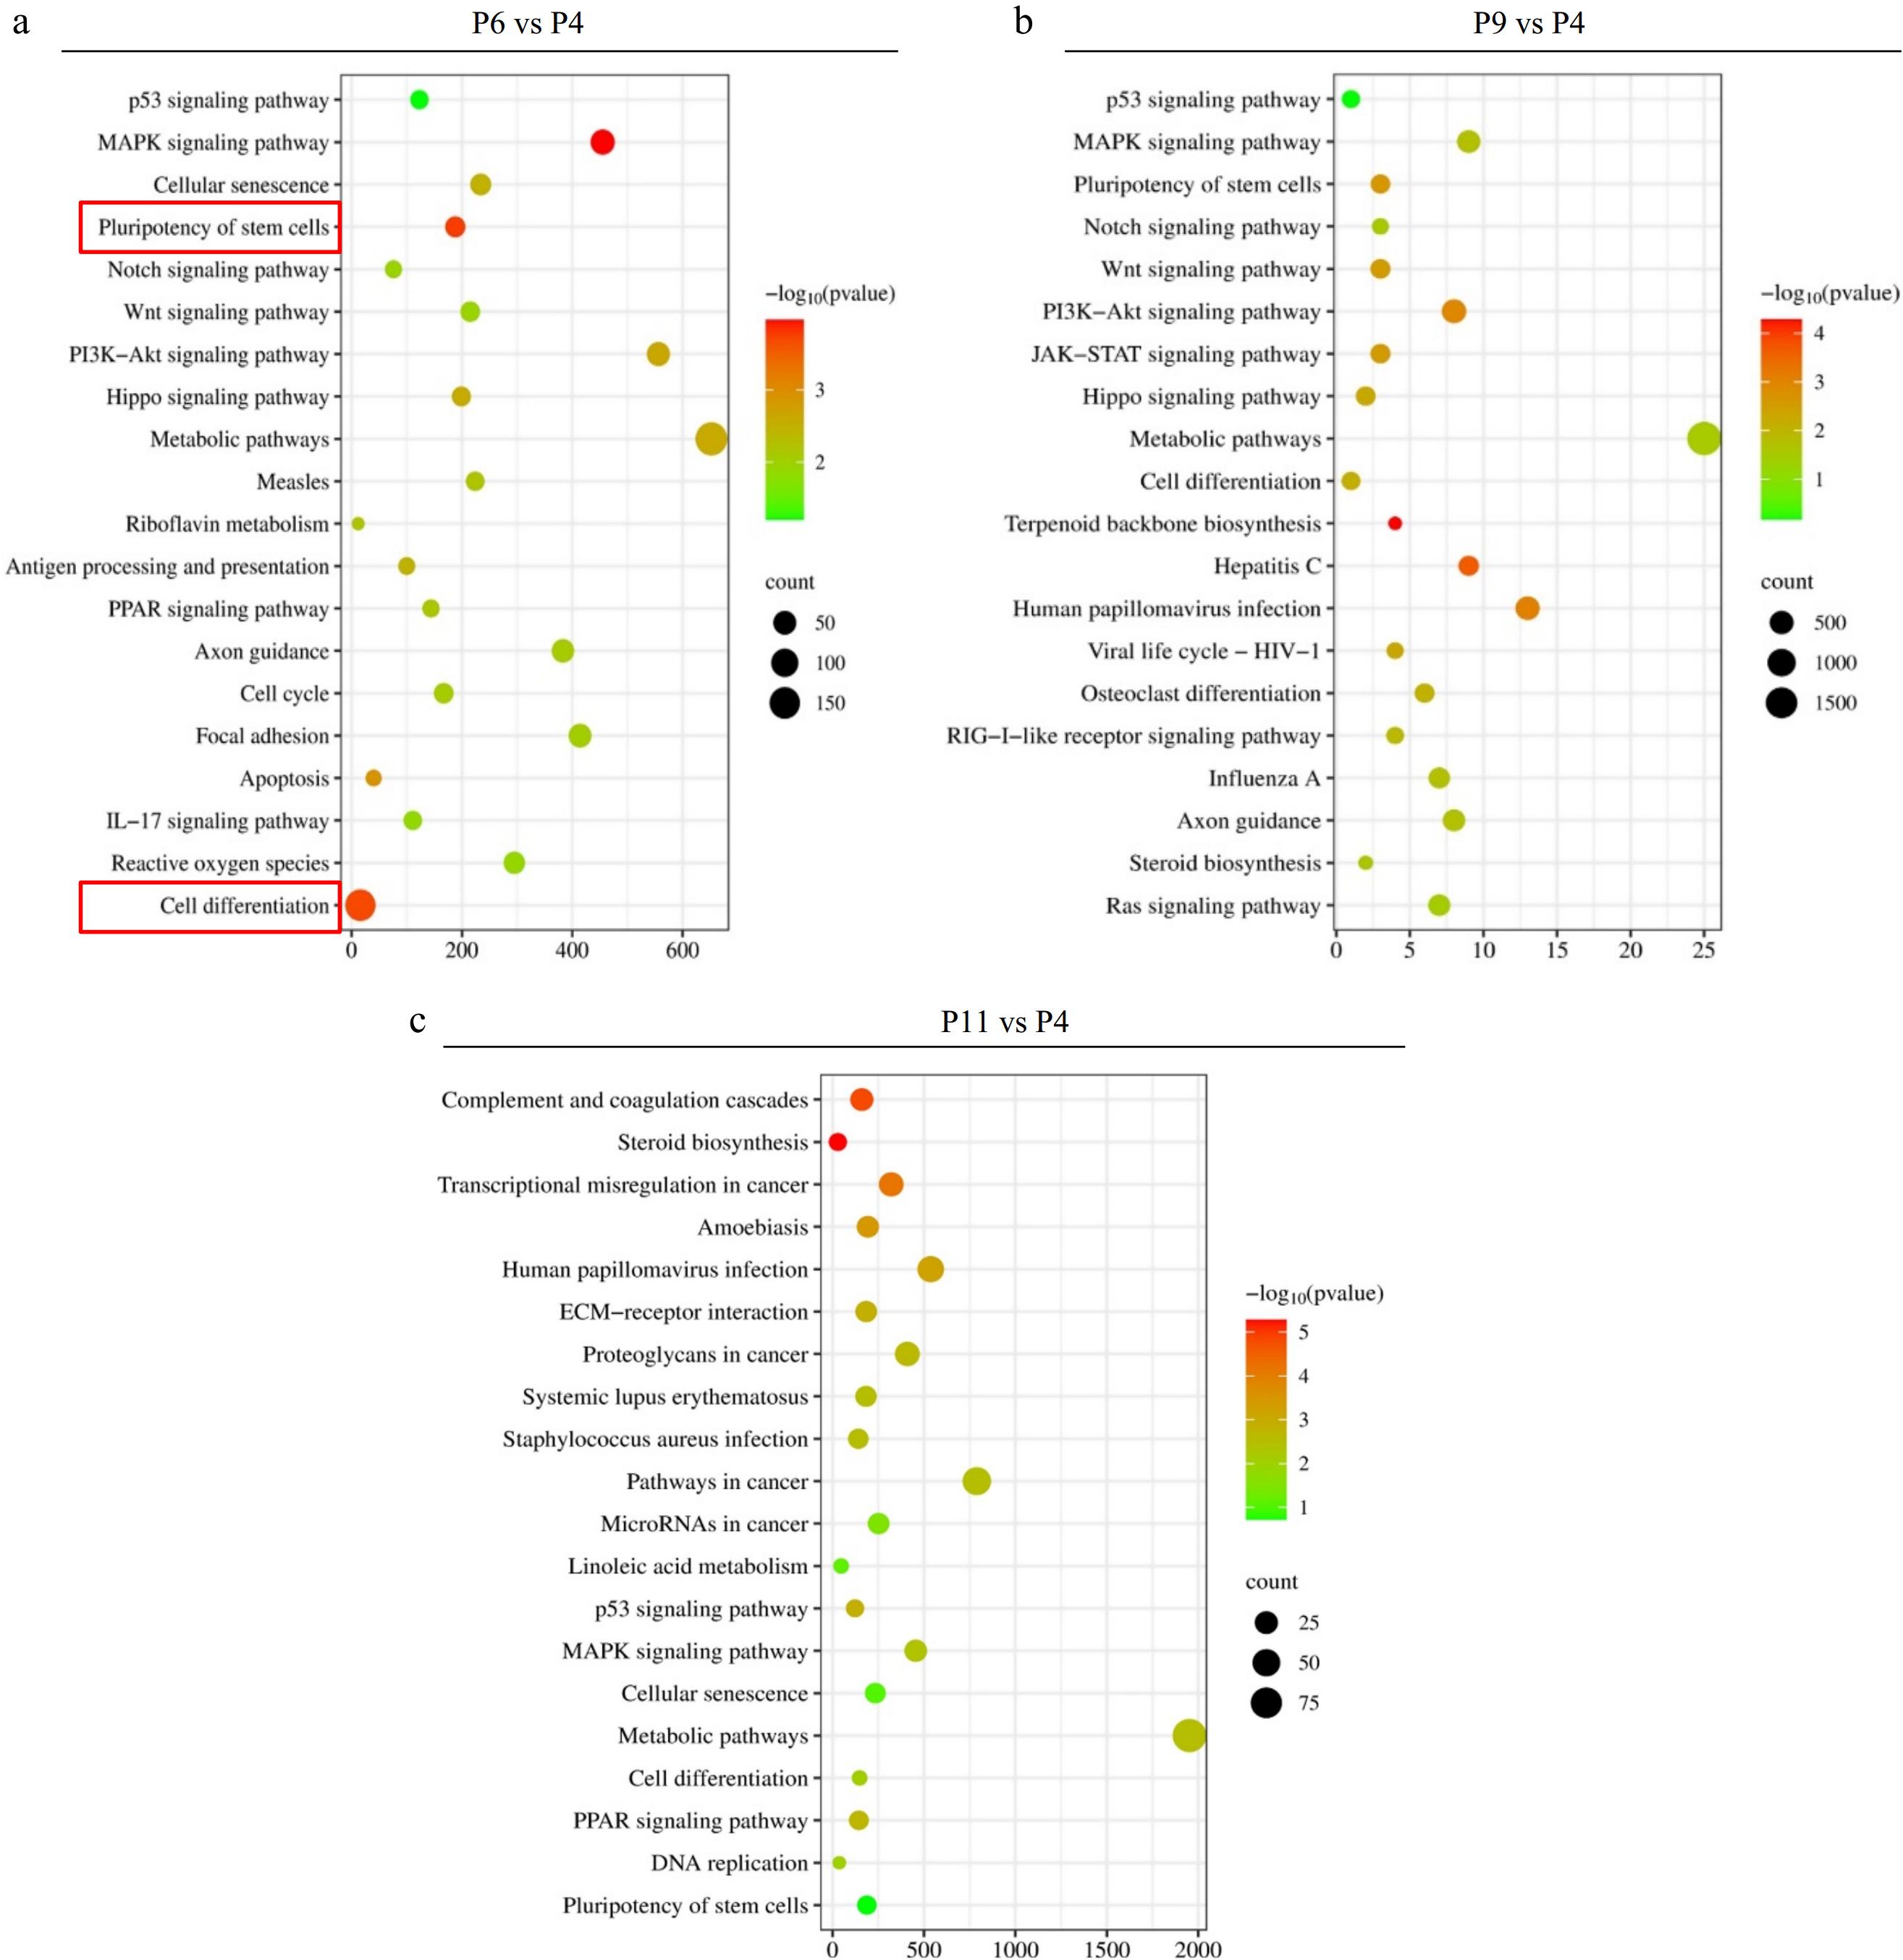
Figure 4.
KEGG enrichment analysis of DEGs in the different comparison groups, where the X-axis represents DEG’s numbers and the Y-axis represents the pathway. (a) P6 vs P4, (b) P9 vs P4, and (v) P11 vs P4.
-
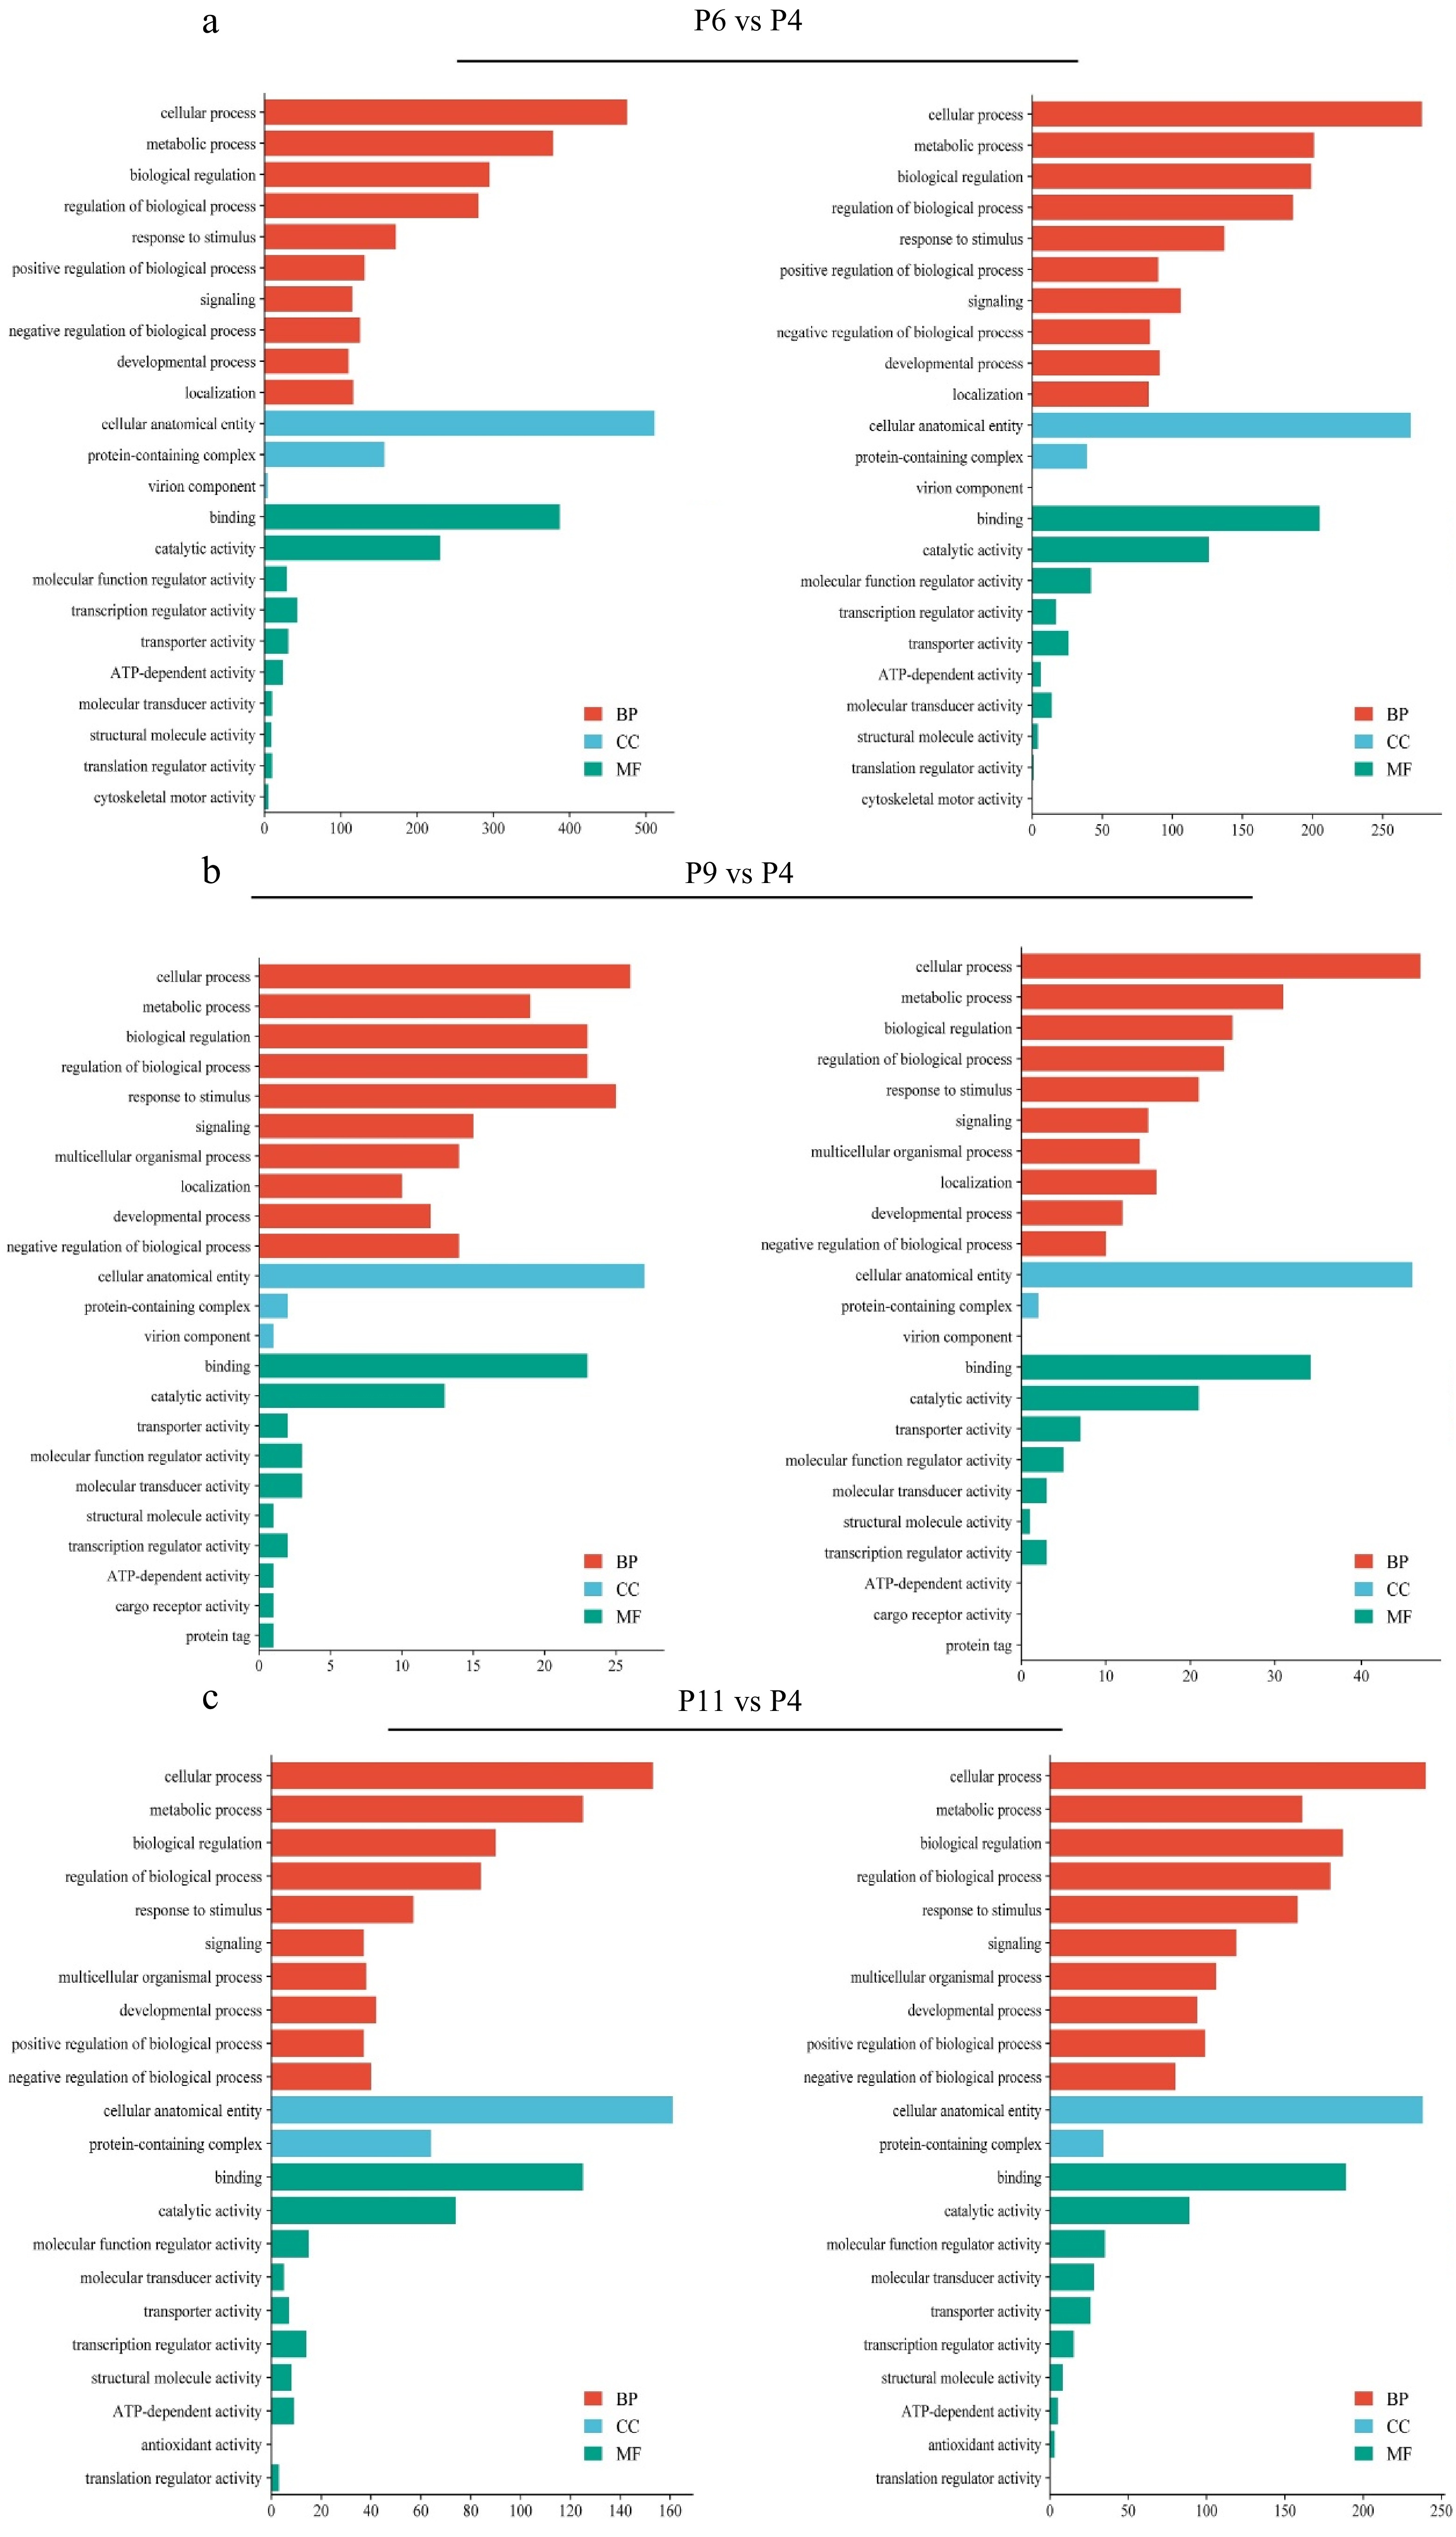
Figure 5.
GO enrichment analysis of DEGs in different comparison group, where the X-axis represents the number of DEGs and the Y-axis represents different GO terms. (a) P6 vs P4, (b) P9 vs P4, and (c) P11 vs P4.
-
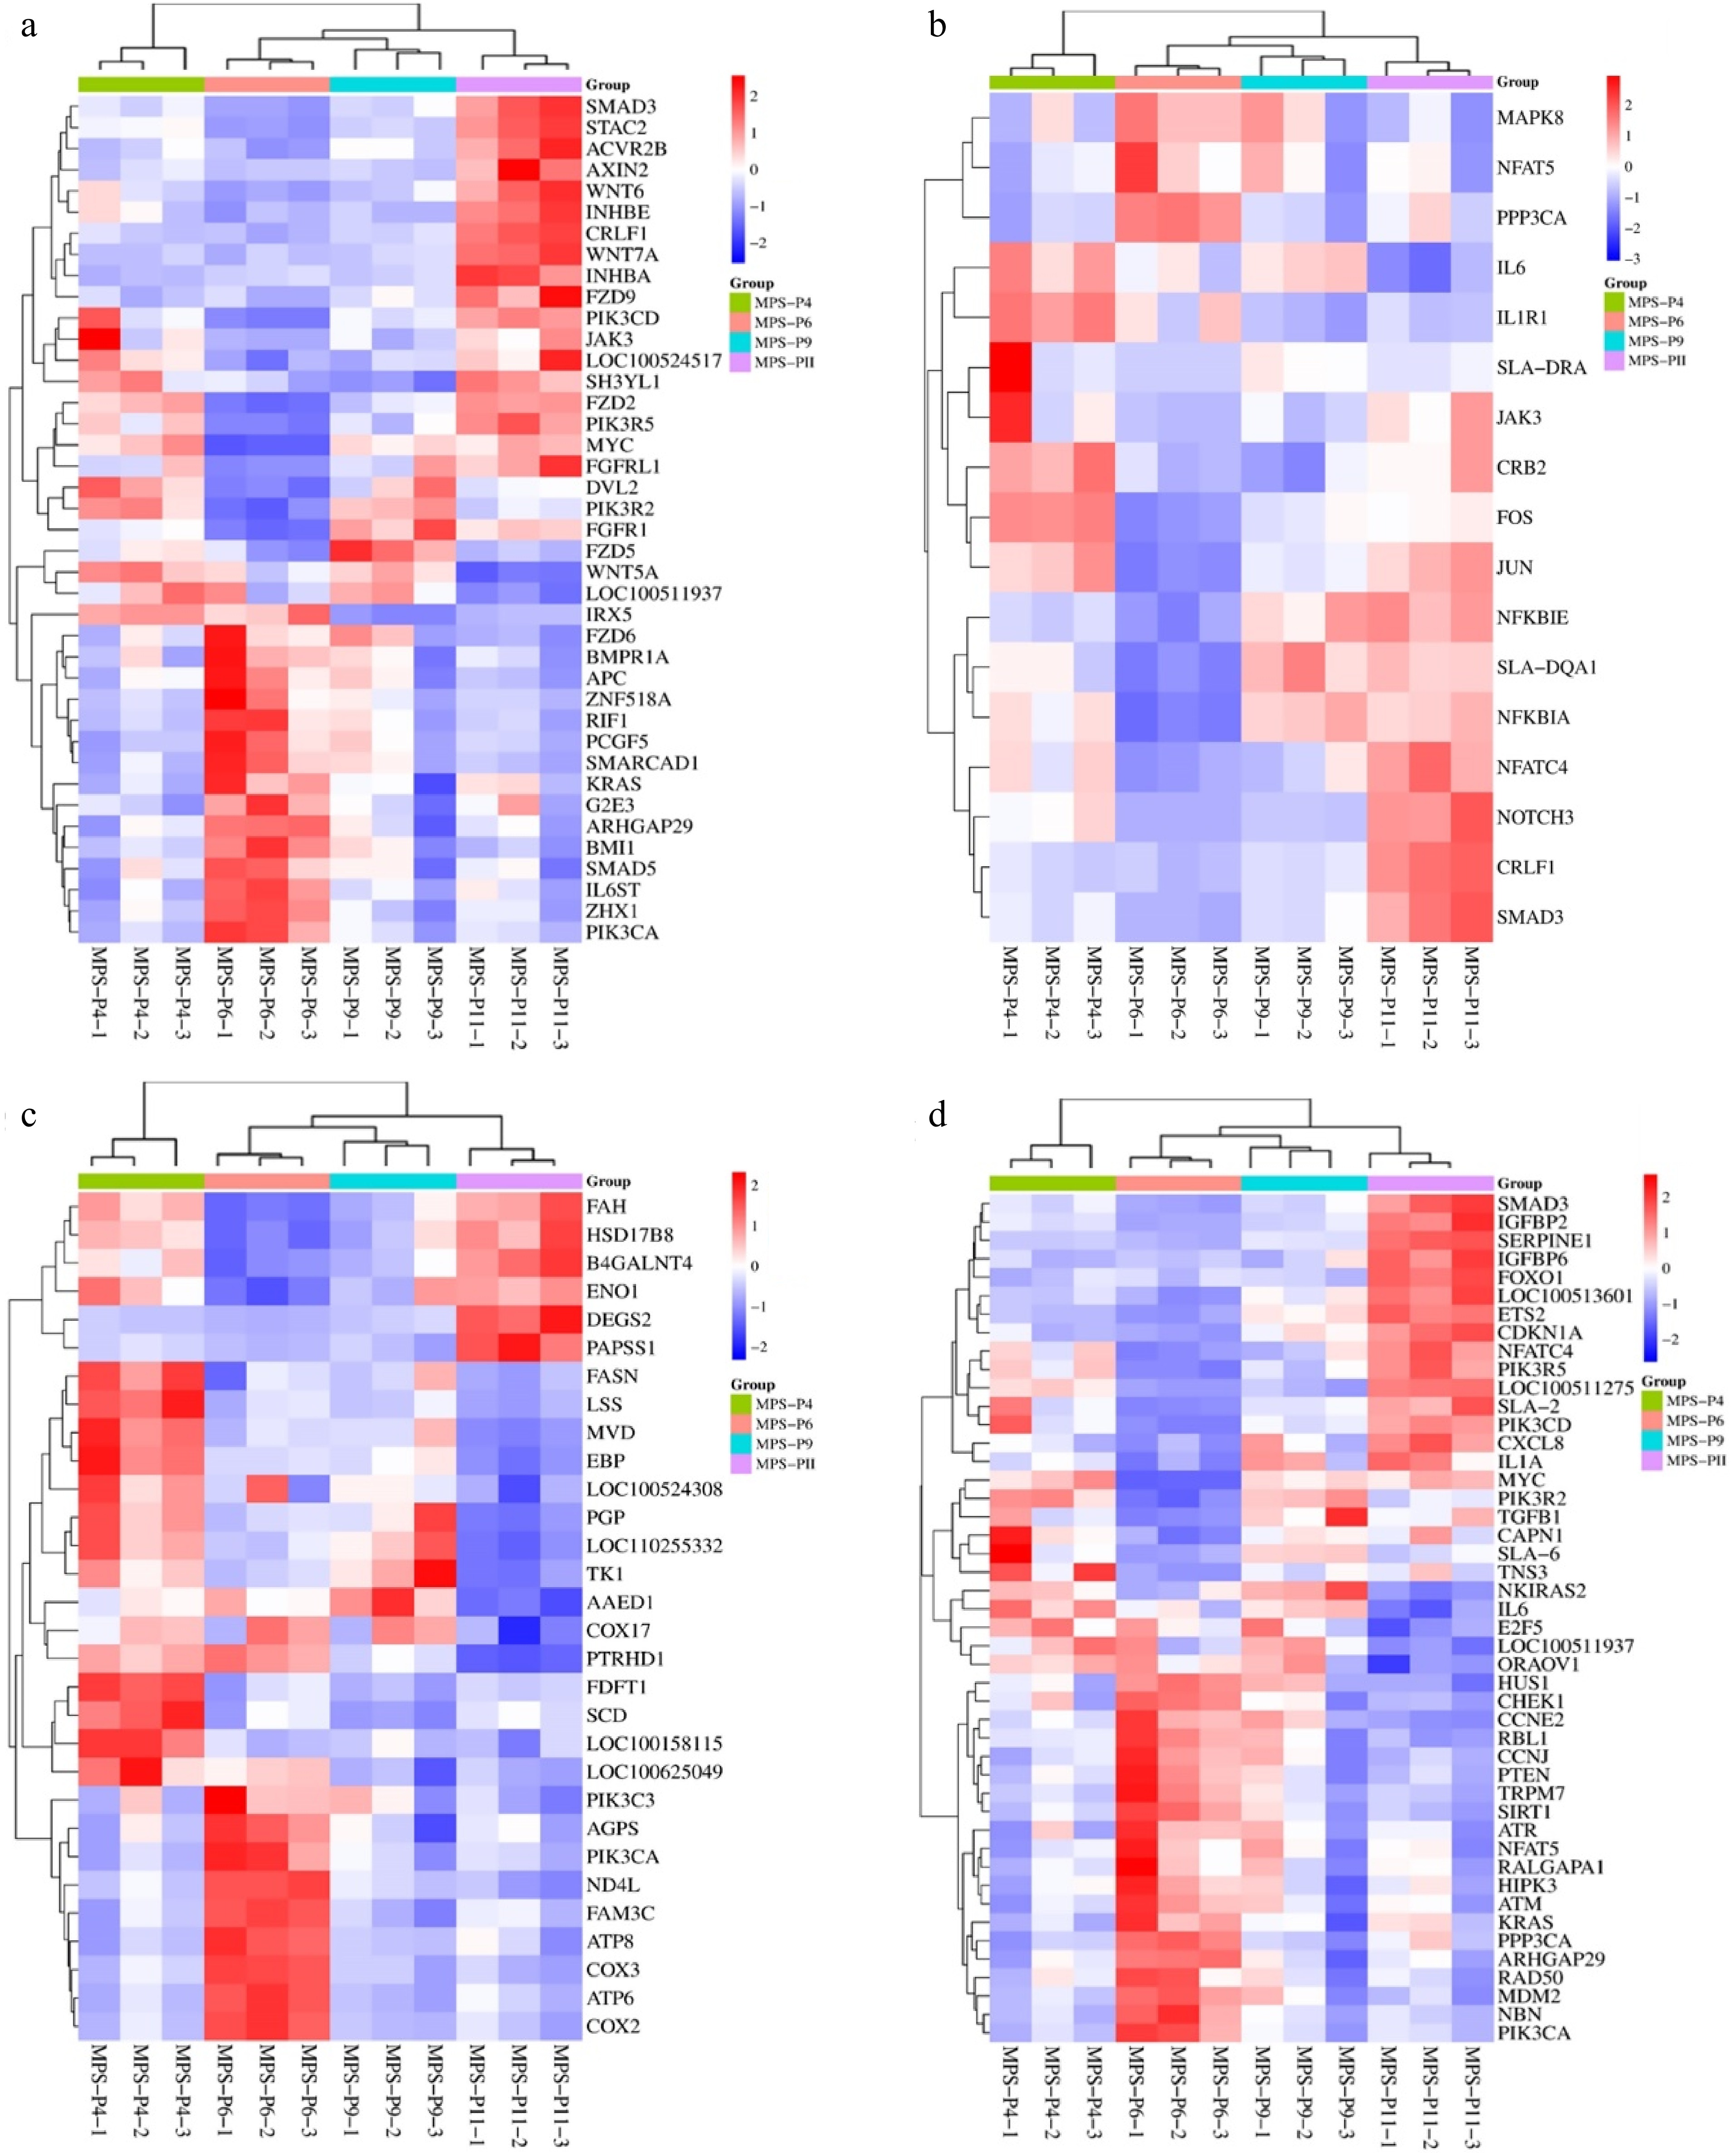
Figure 6.
Comparison of P4, P6, P9, and P11 transcriptome profiles. The cluster heatmap analysis of differentially expressed related to (a) stemness, (b) cell differentiation, (c) metabolic pathways, and (d) cells cellular senescence.
-
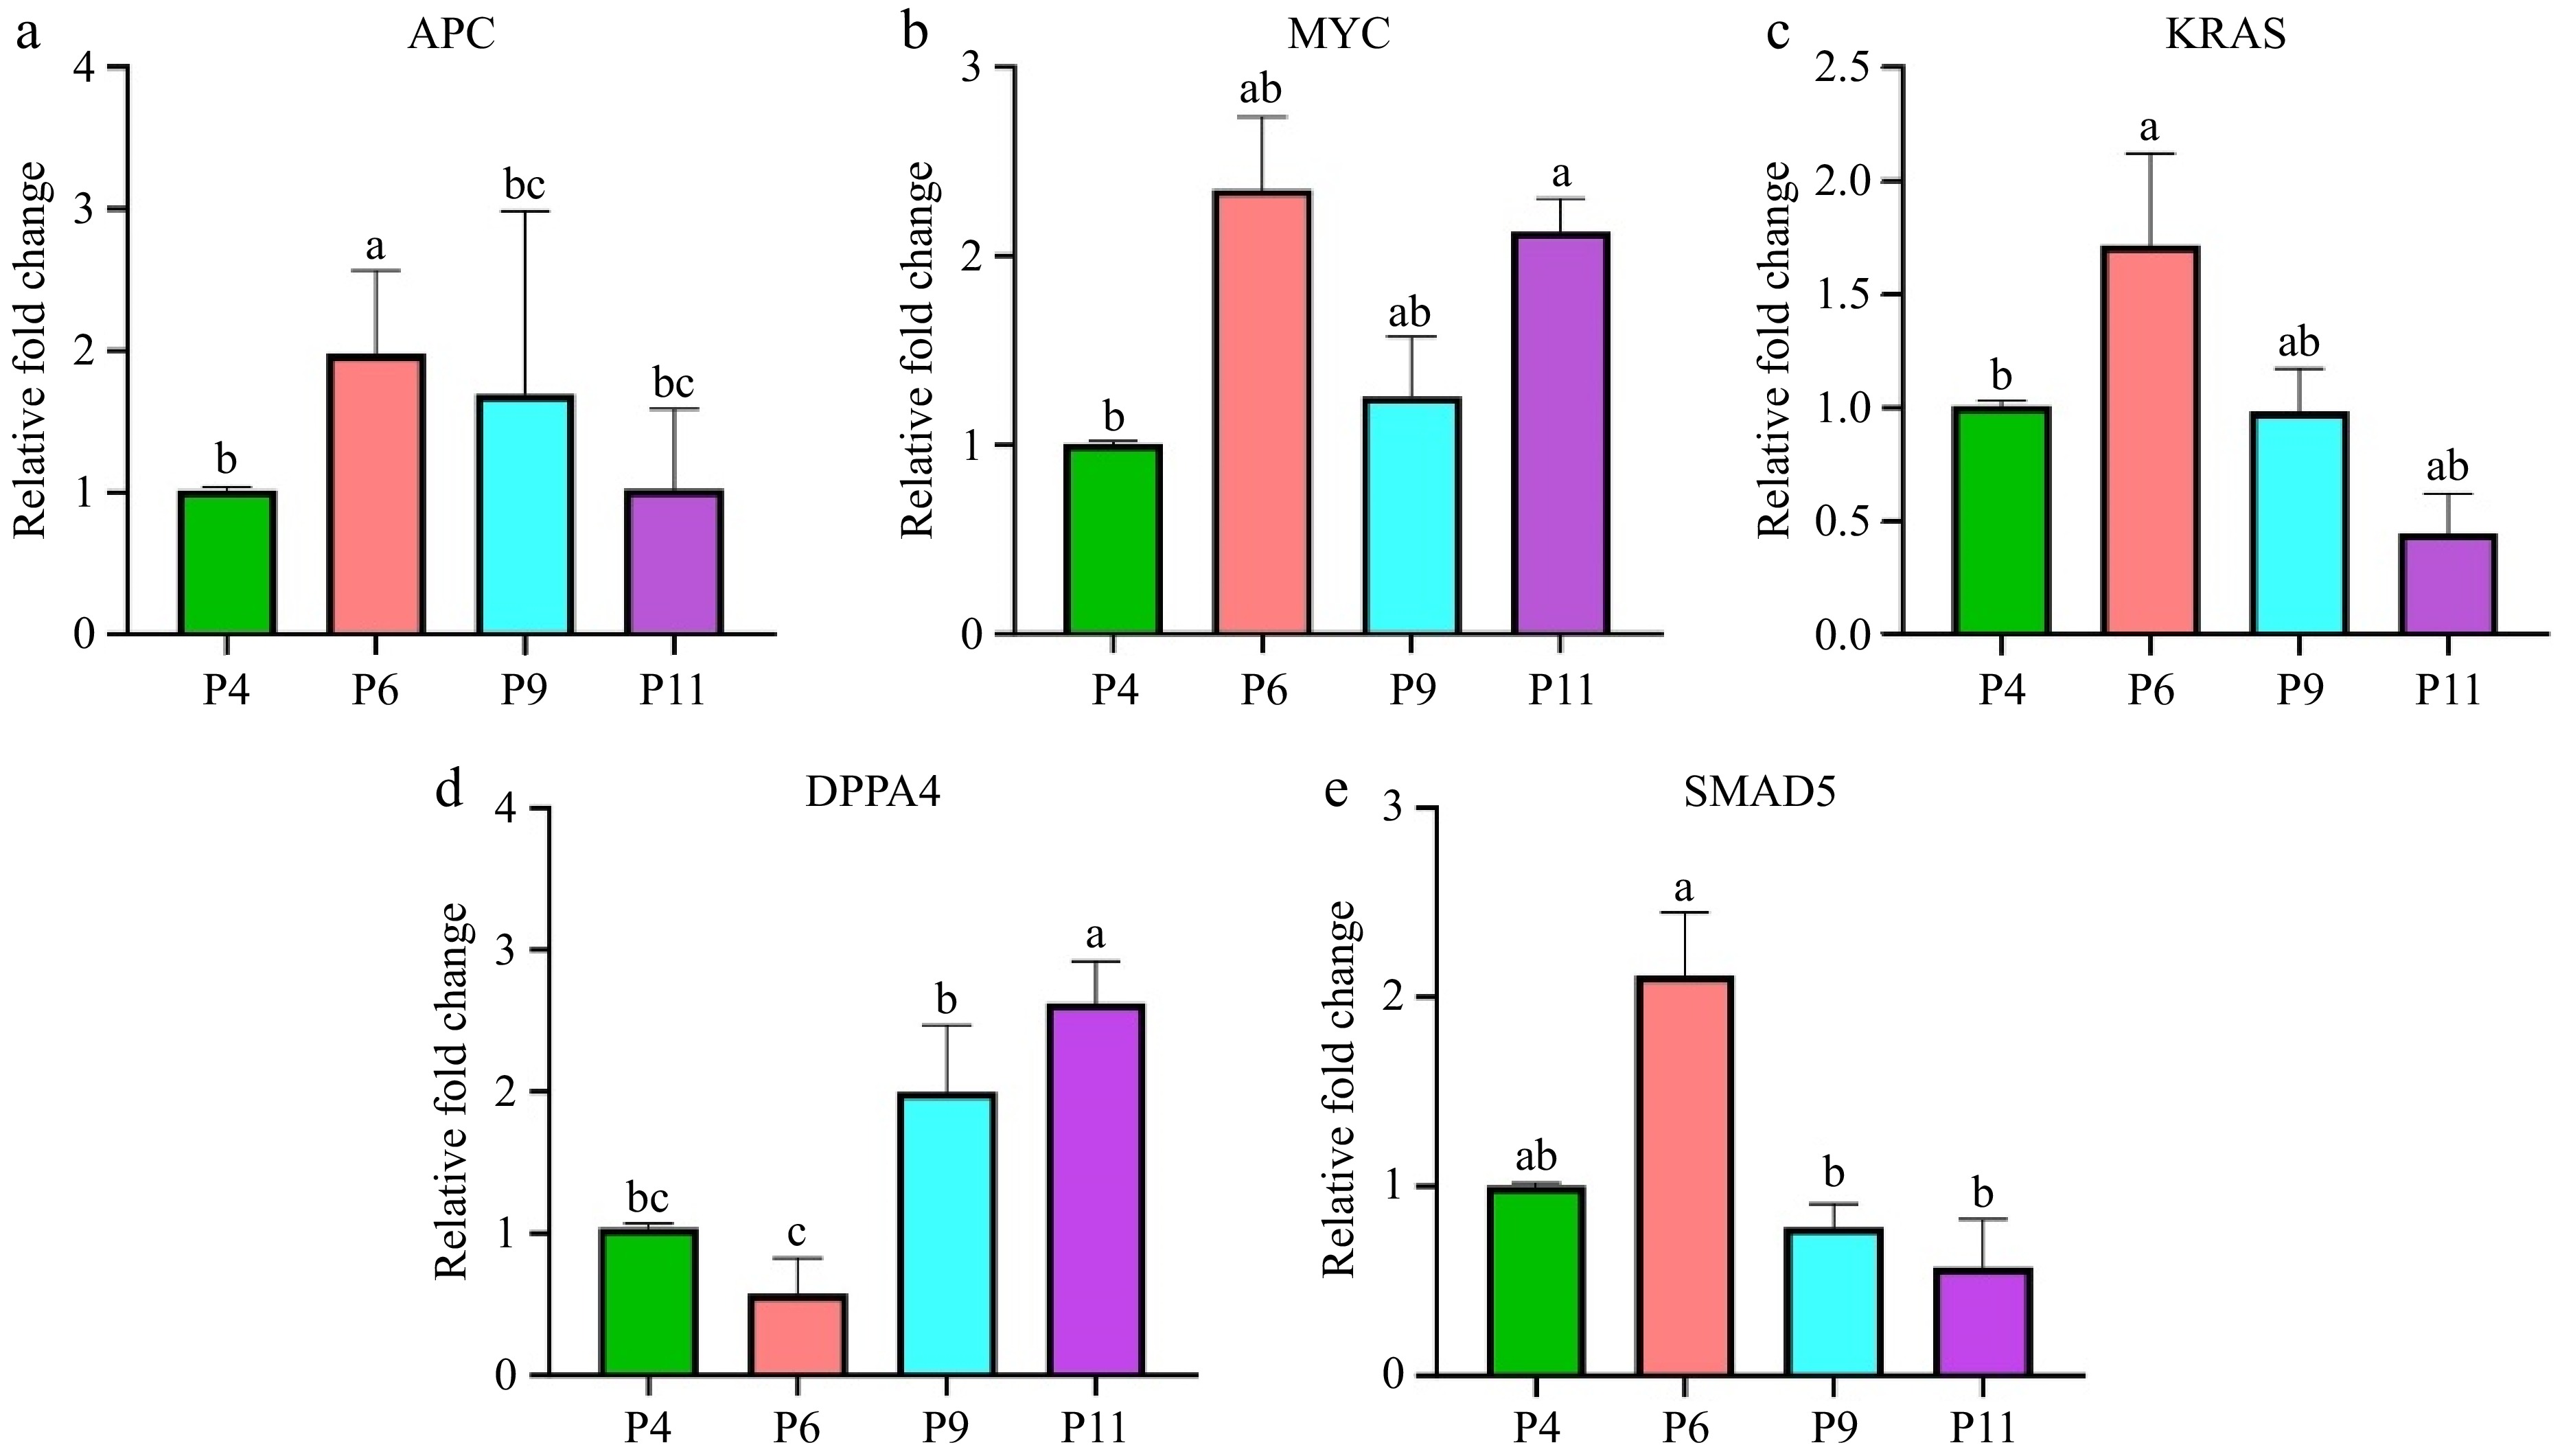
Figure 7.
Expression levels of pluripotency-related genes in pUC-MSC at P4, P6, P9, and P11. (a) APC, (b) MYC, (c) KRAS, (d) DPPA4, (e) SMAD5. Different symbols (a, b, c, d) which are on the top of each column indicate significant differences among groups (p < 0.05).
-
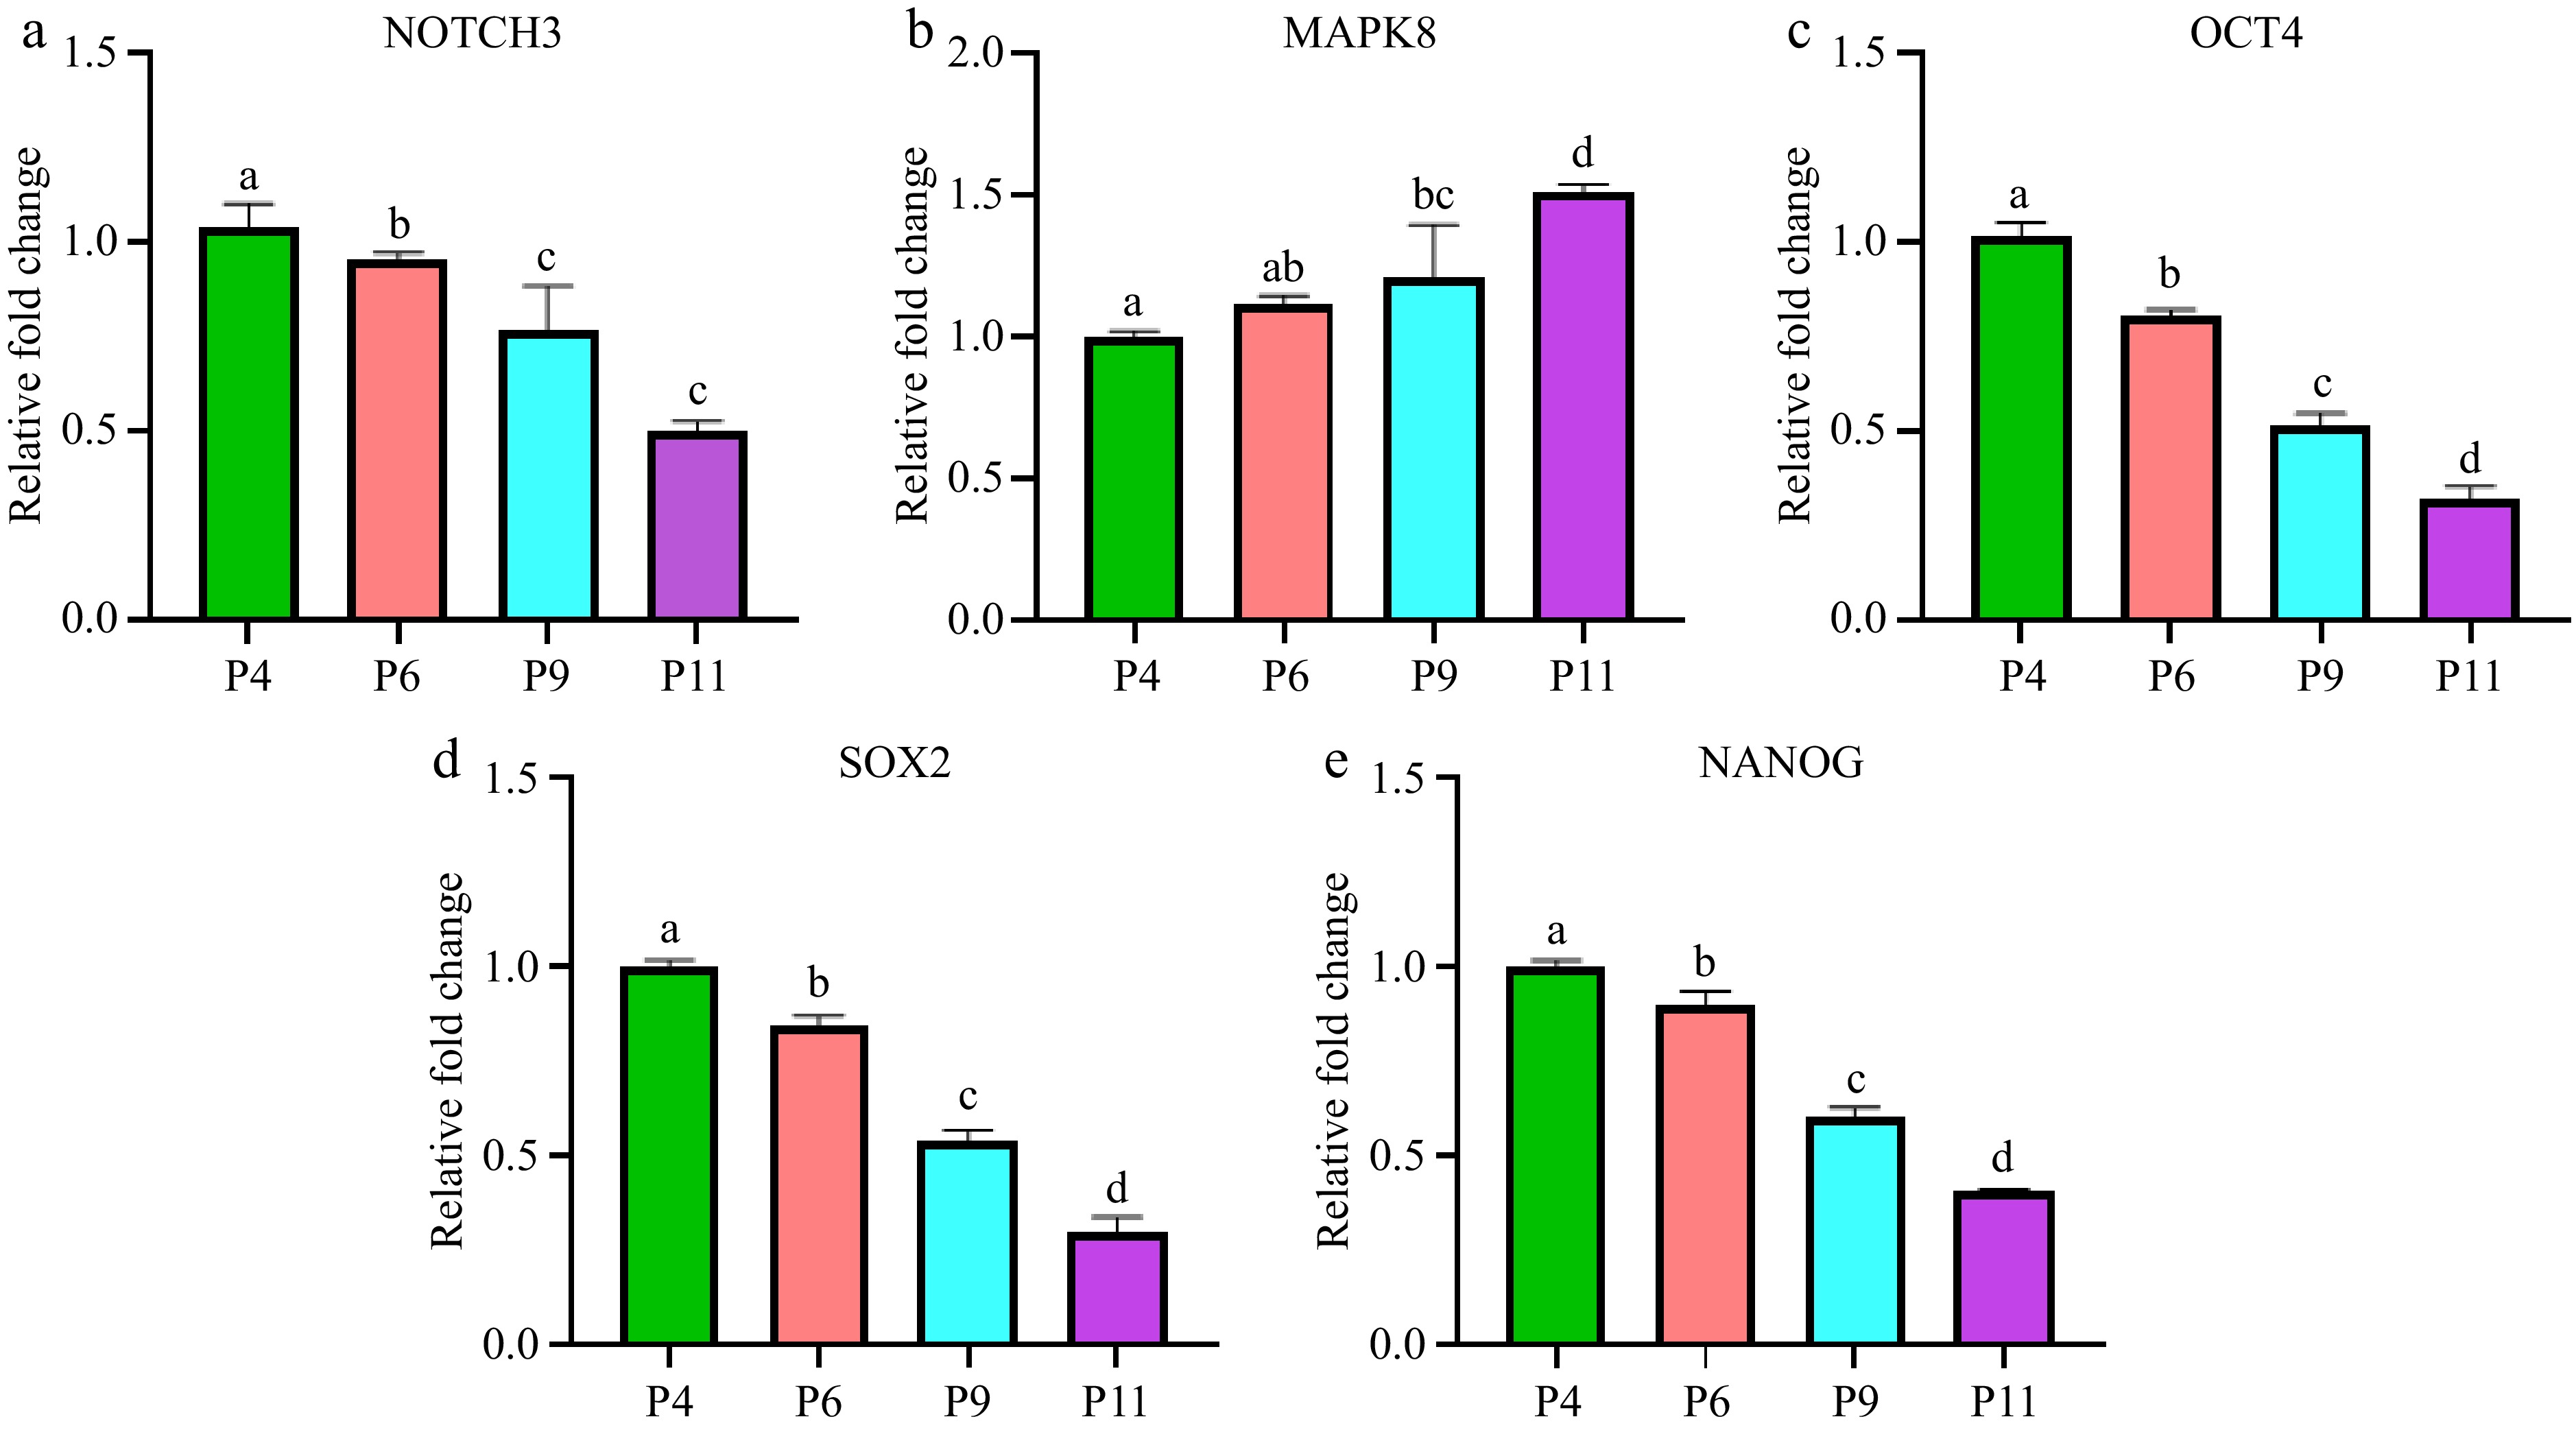
Figure 8.
Expression levels of differentiation related genes in pUC-MSC at P4, P6, P9, and P11. (a) NOTCH3, (b) MAPK8, (c) OCT4, (d) SOX2, (e) NANOG. Different symbols (a, b, c, d) which are on the top of each column indicate significant differences among groups (p < 0.05).
-
Gene name Gene ID Primer sequence Product length (bp) MYC NM_001005154.1 F: AGCACAATTATGCAGCGCCC 80 R: GACCCTGCCACTGTCCAACT KRAS XM_013993793.2 F: GGGAGAGAGGCCTGCTGAAA 71 R: ACTCTTGCCTACGCCACCAG APC NM_001206430.1 F: TGGCAACTTCGGGTAACGGT 99 R: GCCTTCGAGGAGCAGAGTGT DPPA4 XM_005654065.3 F: ACCGGCCAACCTGATTCACA 81 R: TCCAGTTTCCGGCCTTTGGT GAPDH XM043245356.3 F: TCGGAGTGAACGGATTTGGC R: TGCCGTGGGTGGAATCATAC NOTCH3 XM_021083631.1 F: ATGGTCTTCCCTTACCACCG 108 R: ACGGTTGTCAATCTCCAGCA MAPK8 XM_021073087.1 F: CAGTCTCCACCGCCTAGGTT 75 R: GATCCCTCGCTGCTACCTGG OCT4 MF955857.1 F: GGCTCCCCCATGCATTCAAA 80 R: TCTCTCCCTAGCTCACCCCTT SOX2 NM_001123197.1 F: GAGCGCCCTGCAGTACAACT 87 R: CCCTGCTGCGAGTAGGACAT NANOG EF522119.1 F: ACGGTGGACCTGCAAGTAGT 92 R: GCTGCTGAGTAACCCAGACT Table 1.
Primer sequences of target genes in qRT-PCR.
-
Sample Reads number Base number (bp) Q20 (%) Q30 (%) MPS-P4-1 39,132,268 5,830,212,150 98.22 94.95 MPS-P4-2 39,384,712 5,894,408,375 98.41 95.34 MPS-P4-3 39,323,628 5,887,845,684 98.31 95.17 MPS-P6-1 39,279,880 5,877,249,370 98.17 94.75 MPS-P6-2 39,267,936 5,879,963,739 98.17 94.79 MPS-P6-3 39,248,876 5,872,768,921 98.12 94.67 MPS-P9-1 39,230,388 5,870,955,649 98.06 94.53 MPS-P9-2 39,317,102 5,885,981,291 98.3 95.12 MPS-P9-3 39,102,492 5,853,218,947 98.18 94.91 MPS-P11-1 39,078,322 5,849,103,924 98.25 94.97 MPS-P11-2 39,196,888 5,868,142,702 98.02 94.32 MPS-P11-3 38,951,882 5,831,153,453 98.32 95.18 Table 2.
Mapping results with pig genome.
Figures
(8)
Tables
(2)