-
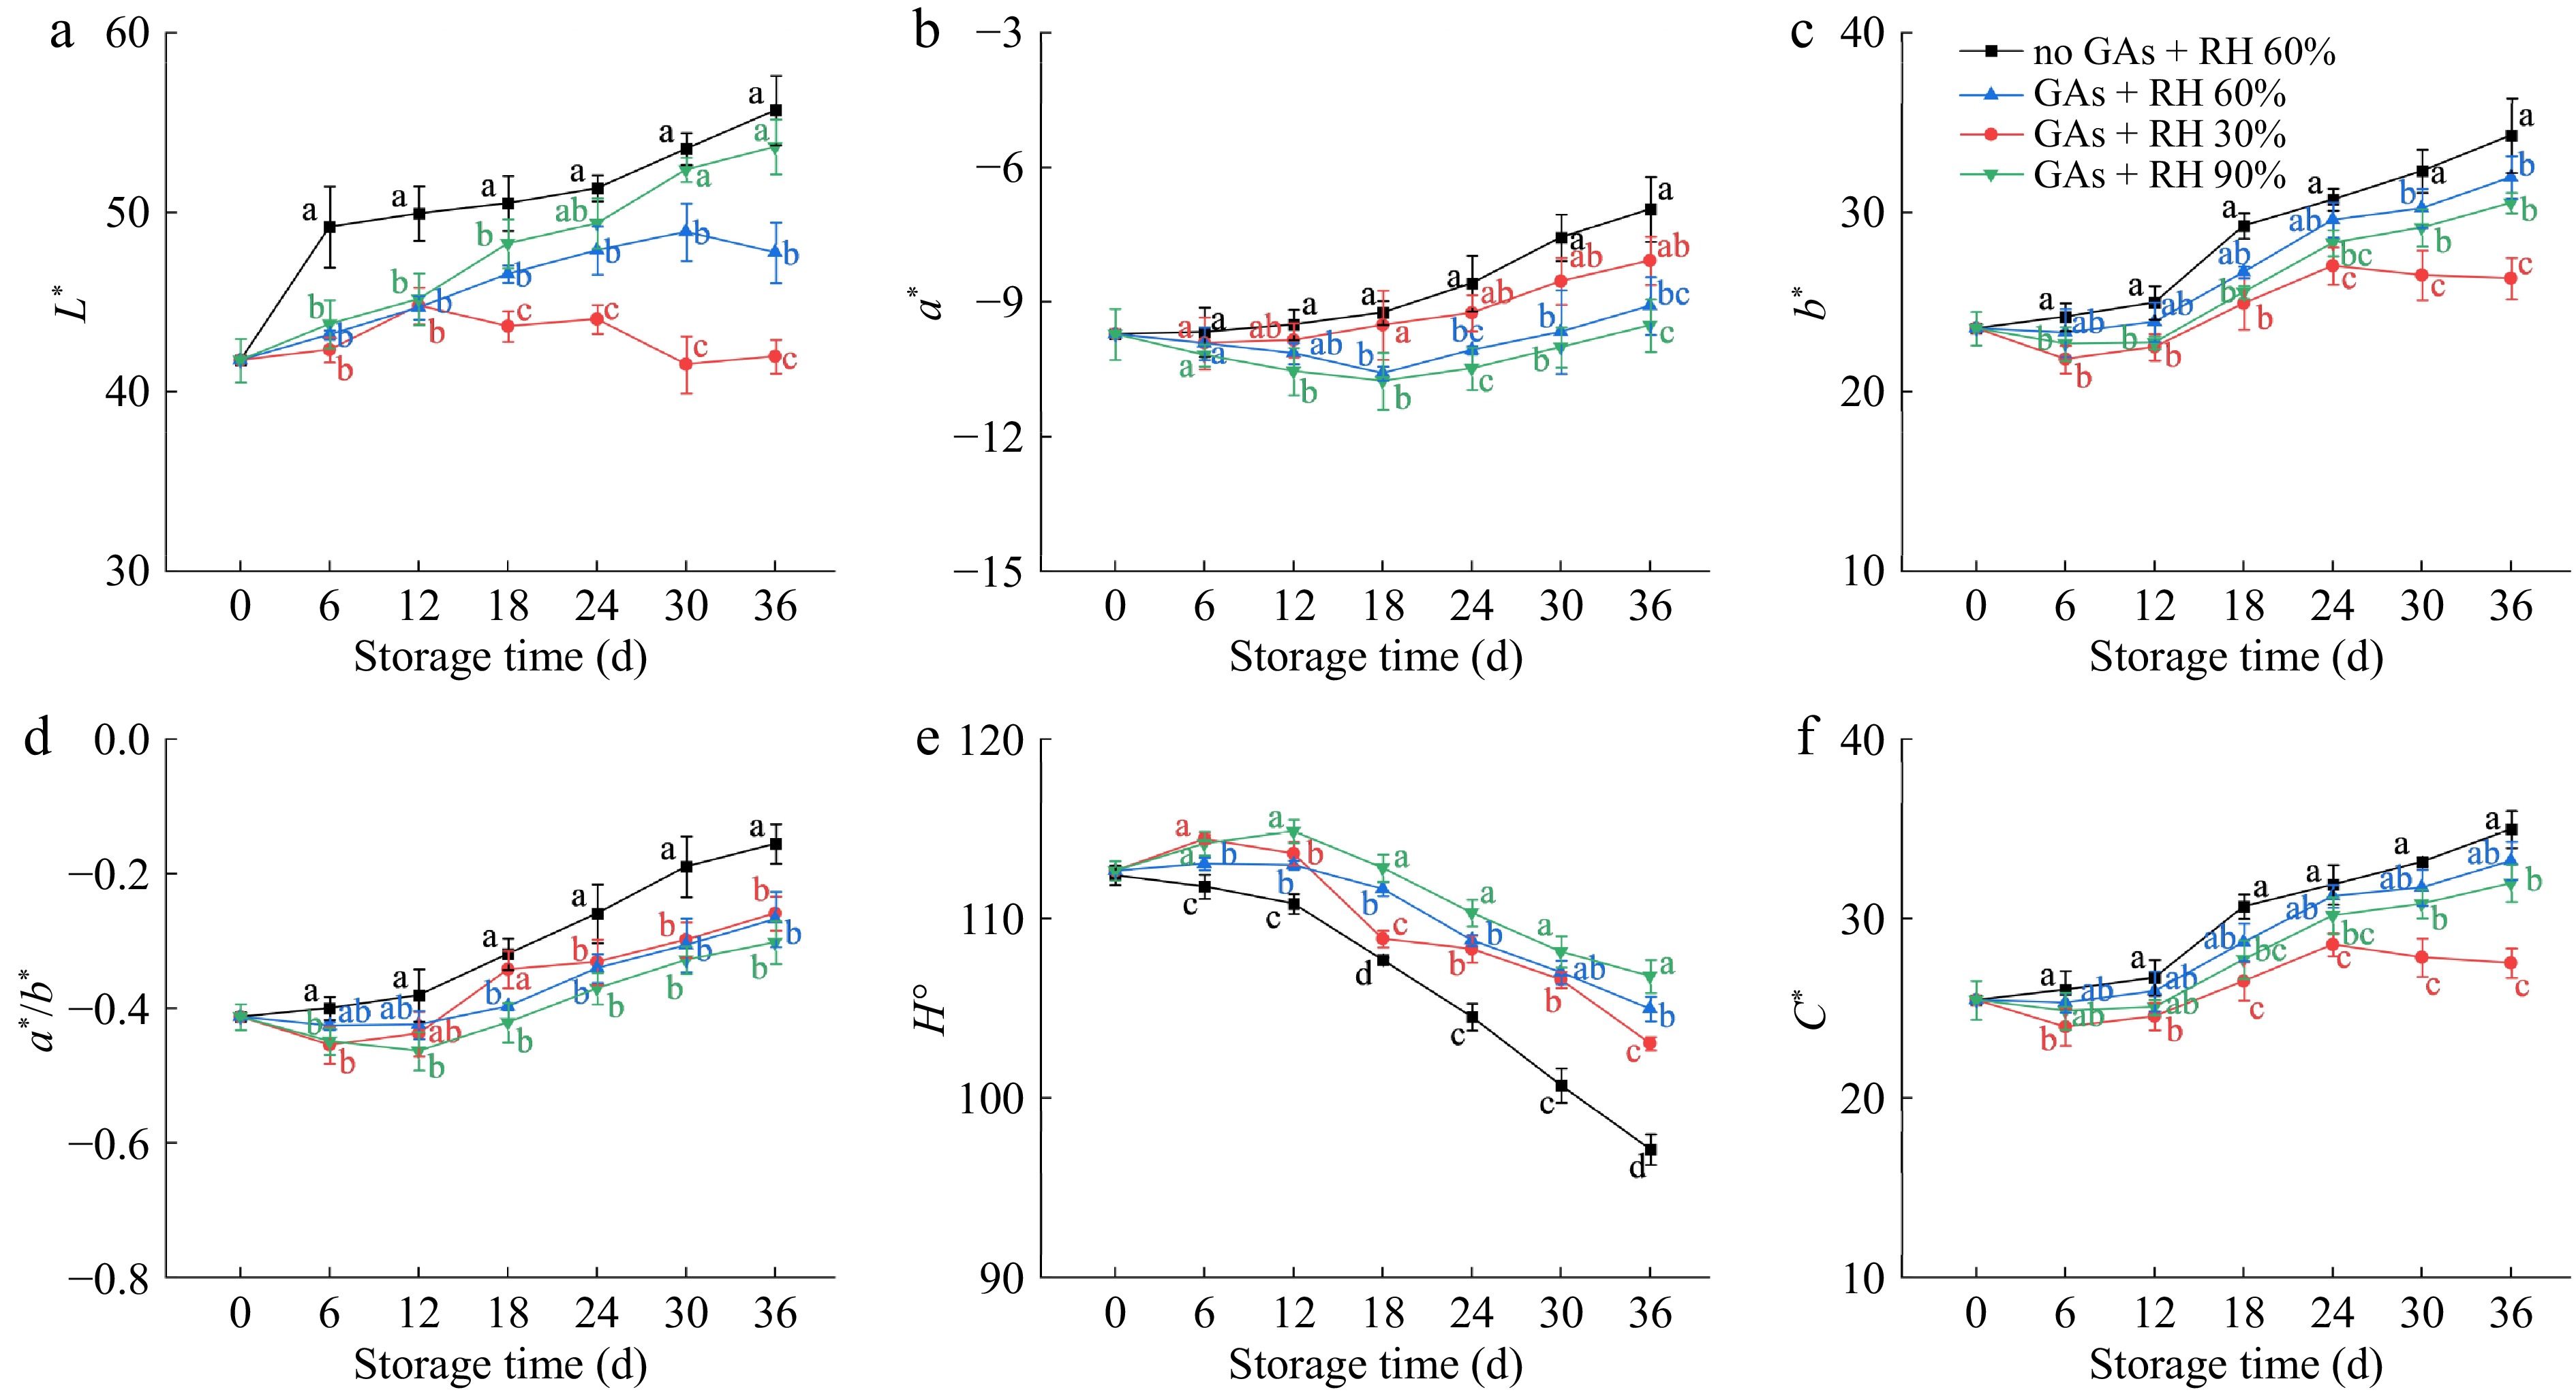
Figure 1.
Fruit color attributes of the pericarp of lemons treated with GAs + RH 30%, GAs + RH 60%, GAs + RH 90%, and the no GAs + RH 60% 3 during storage at 14 ± 1°C for 36 d. (a) L*; (b) a*; (c) b*; (d) a*/b*; (e) H°; (f) C*. Different letters denote significant differences between four treatments within each time interval (p ≤ 0.05).
-
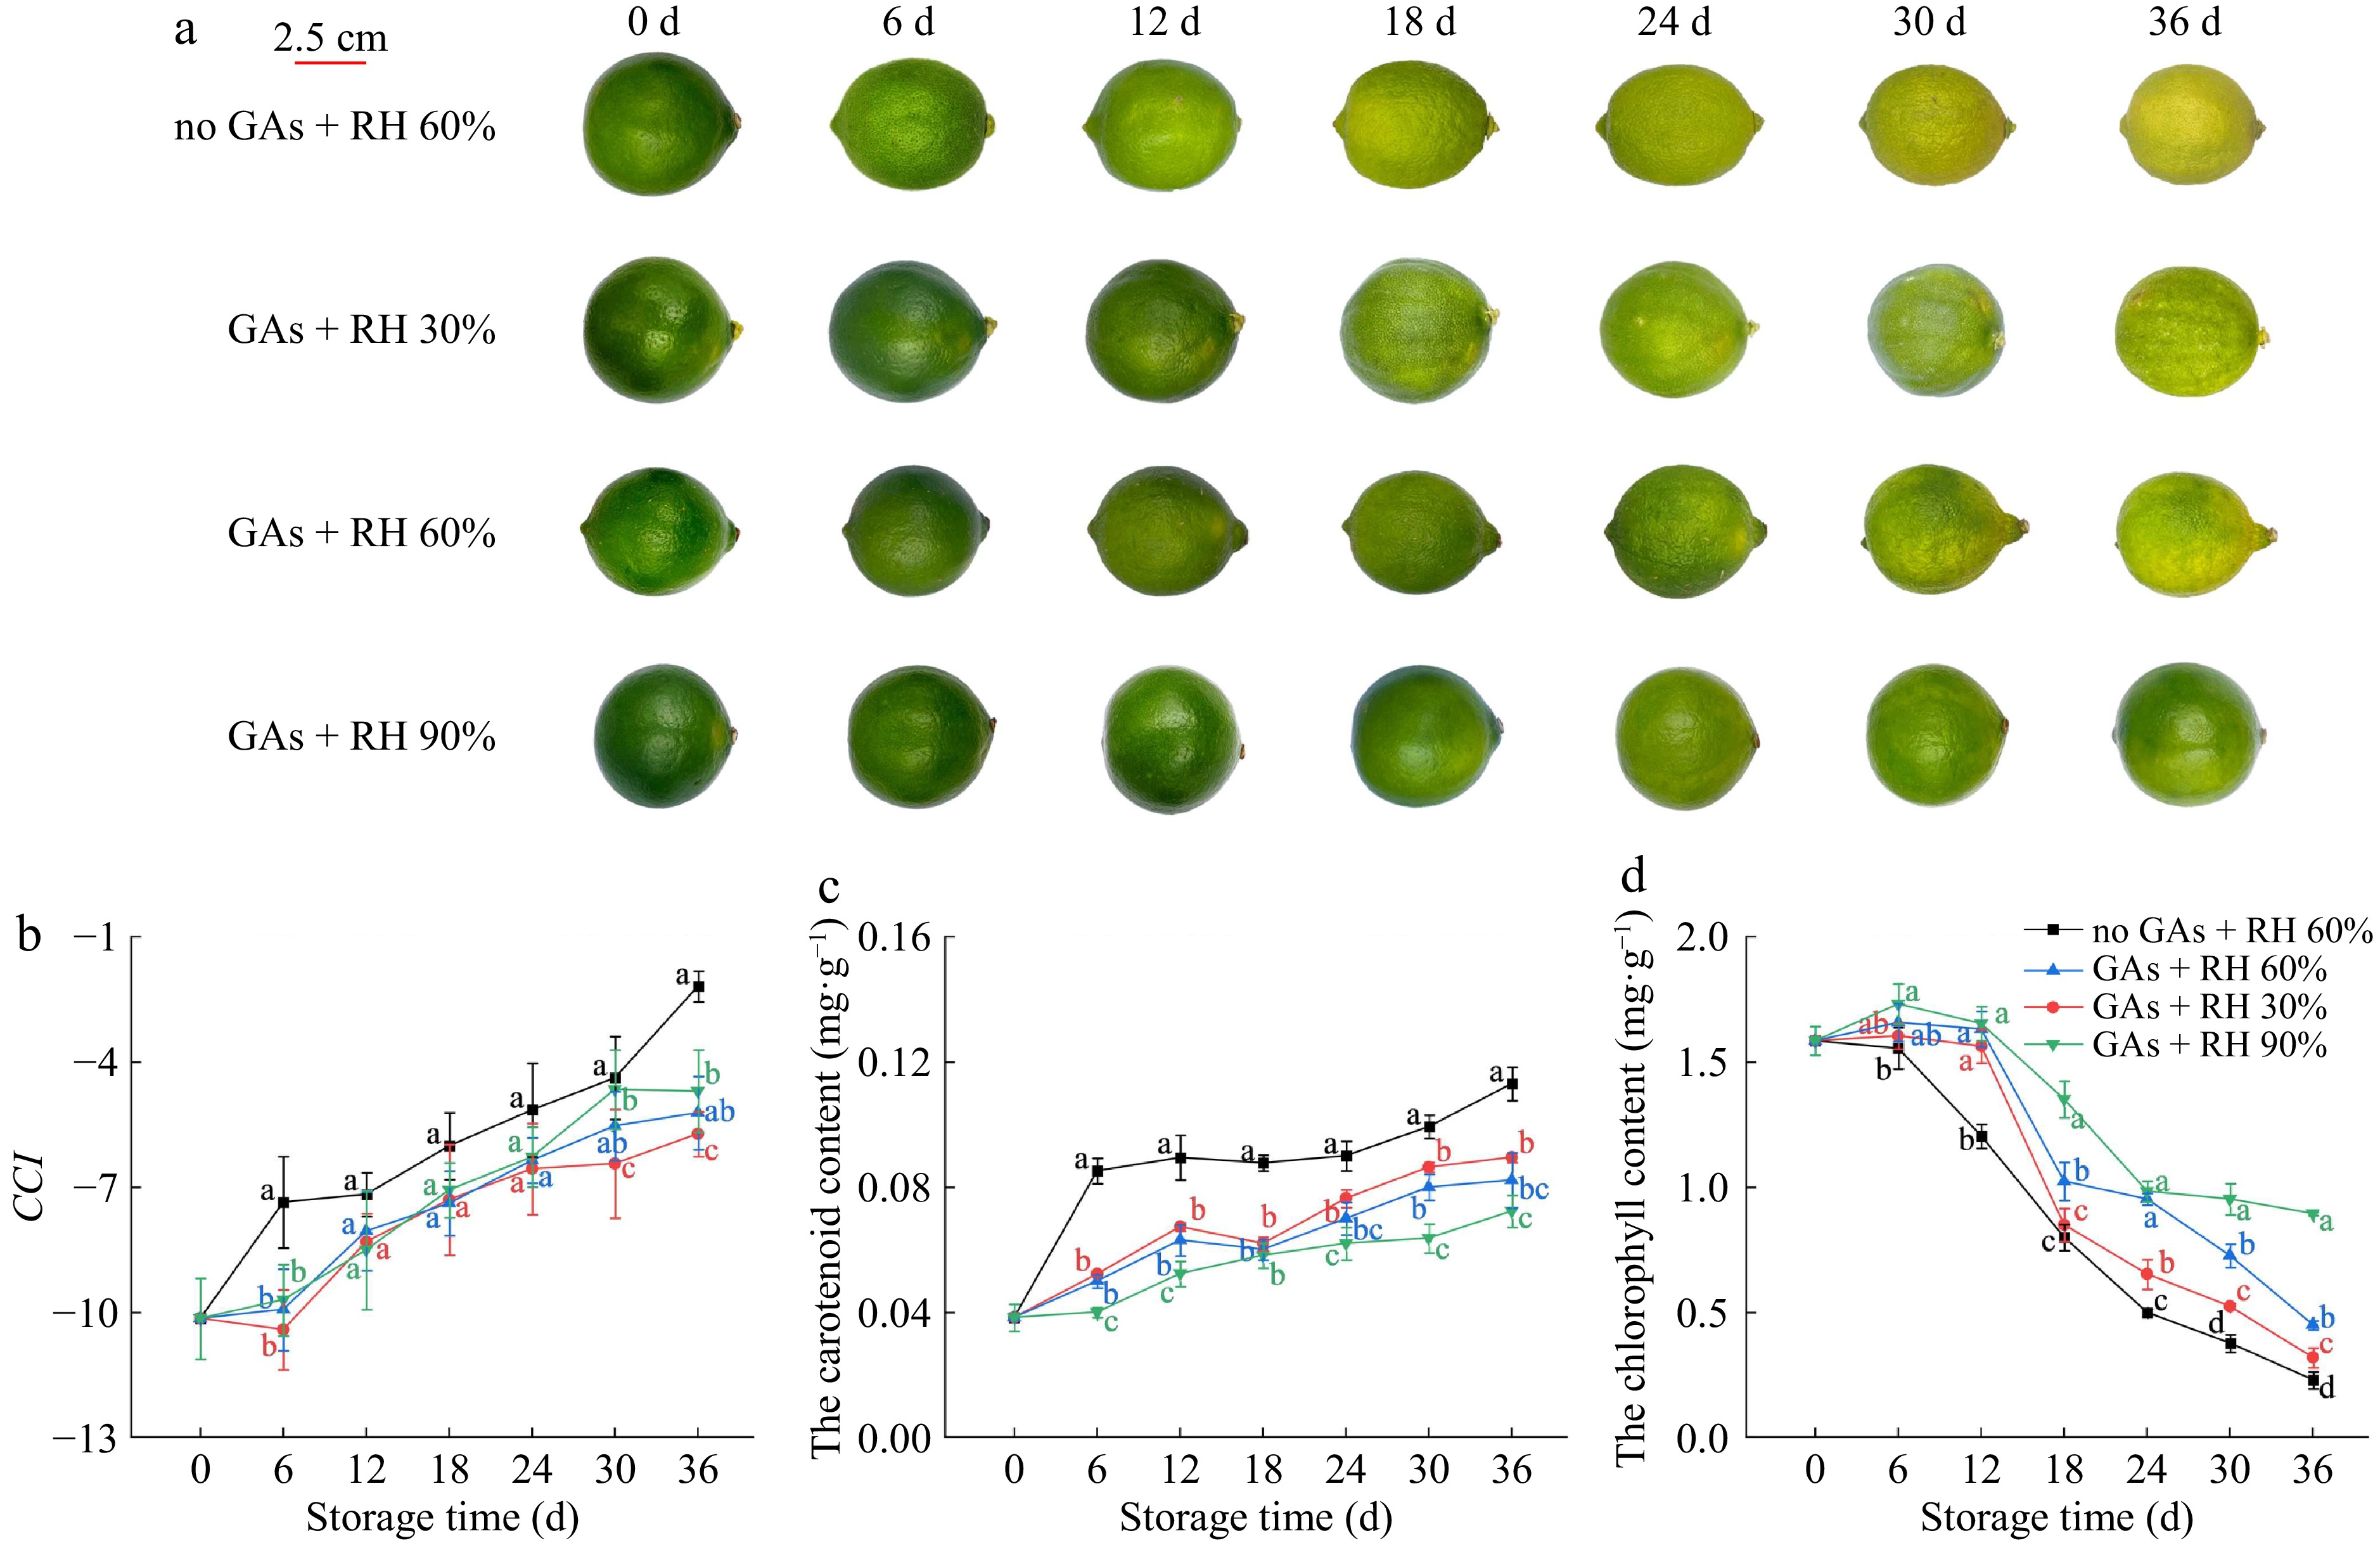
Figure 2.
The visual appearance and the relationship between color parameter and pigment content of lemons treated with GAs + RH 30%, GAs + RH 60%, GAs + RH 90%, and the no GAs + RH 60% during storage at 14 ± 1 °C for 36 d. (a) Photographs of lemons; (b) CCI; (c) the carotenoid content; (d) the chlorophyll content. Different letters indicate significant differences (p ≤ 0.05) compared with the control group under the same storage time. The scale bar of (a) is 2.5 cm.
-
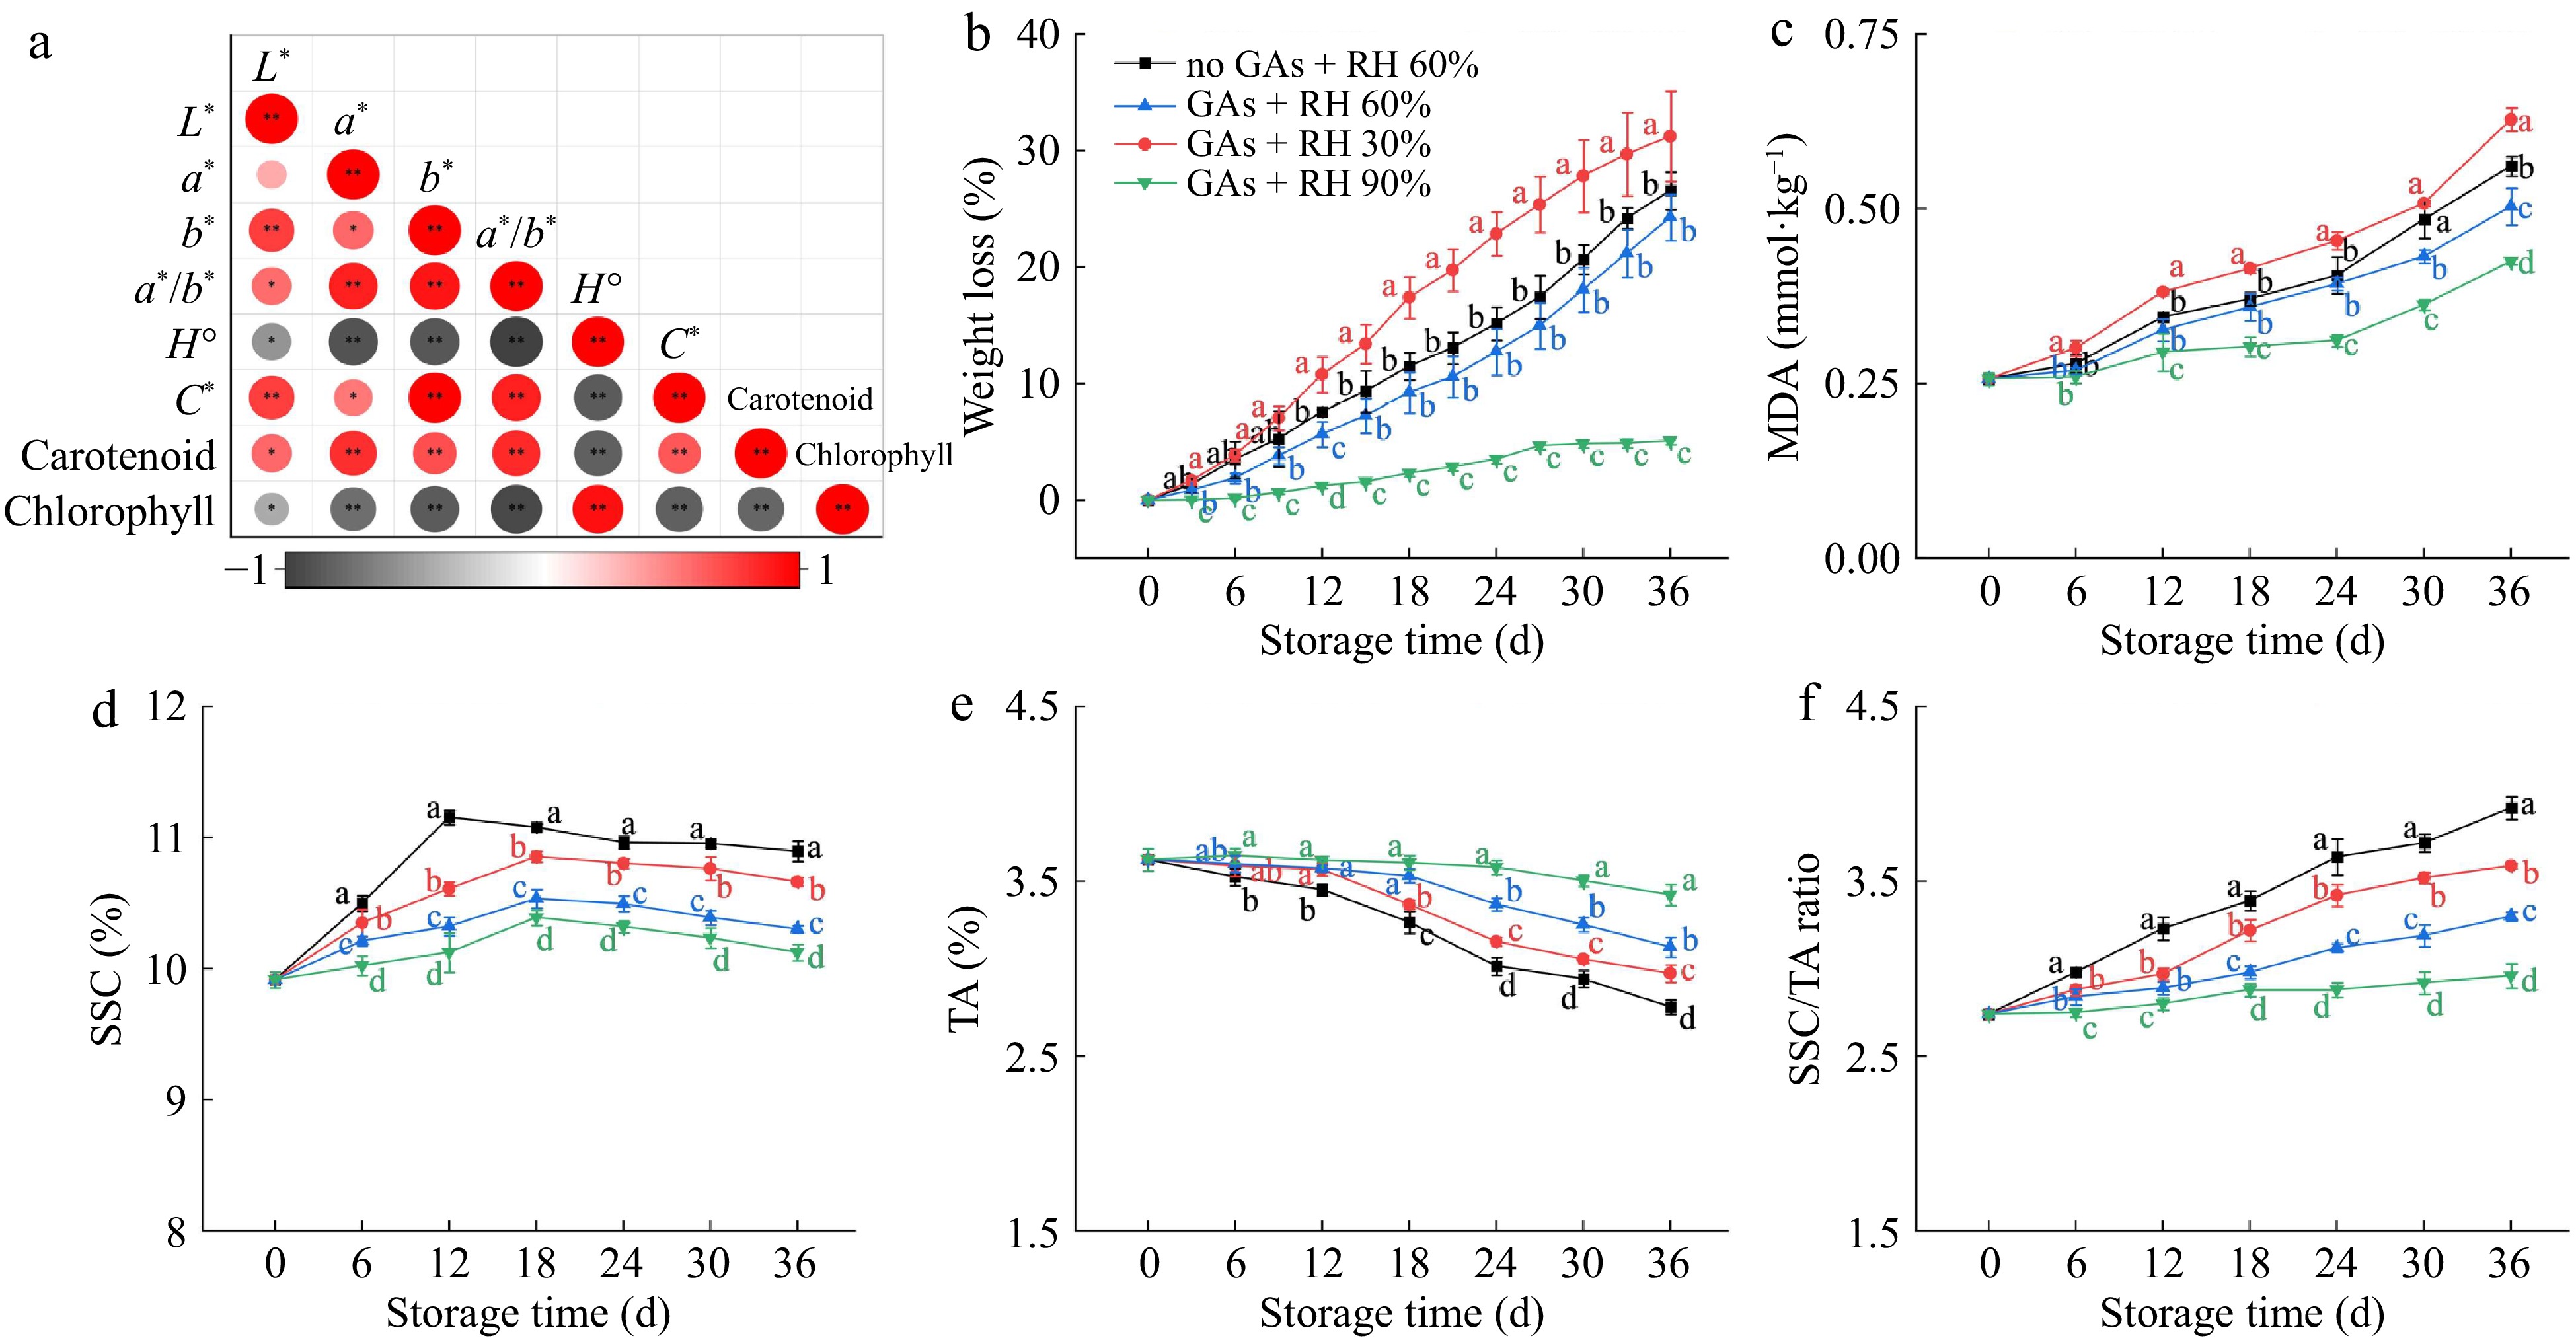
Figure 3.
Quality attributes of lemons treated with GAs + RH 30%, GAs + RH 60%, GAs + RH 90%, and no + RH 60% during storage at 14 ± 1 °C for 36 d. (a) Correlation analysis of color attributes includes L*, a*, b*, a*/b*, H°, C*, the carotenoid content, and the chlorophyll content. The red and grey colored dots respectively represent positive and negative correlations, * p ≤ 0.05, ** p ≤ 0.01. (b) Weight loss; (c) MDA content; (d) SSC; (e) TA; (f) SSC/TA ratio. Different letters indicate significant differences (p ≤ 0.05) compared with the control group under the same storage time.
-
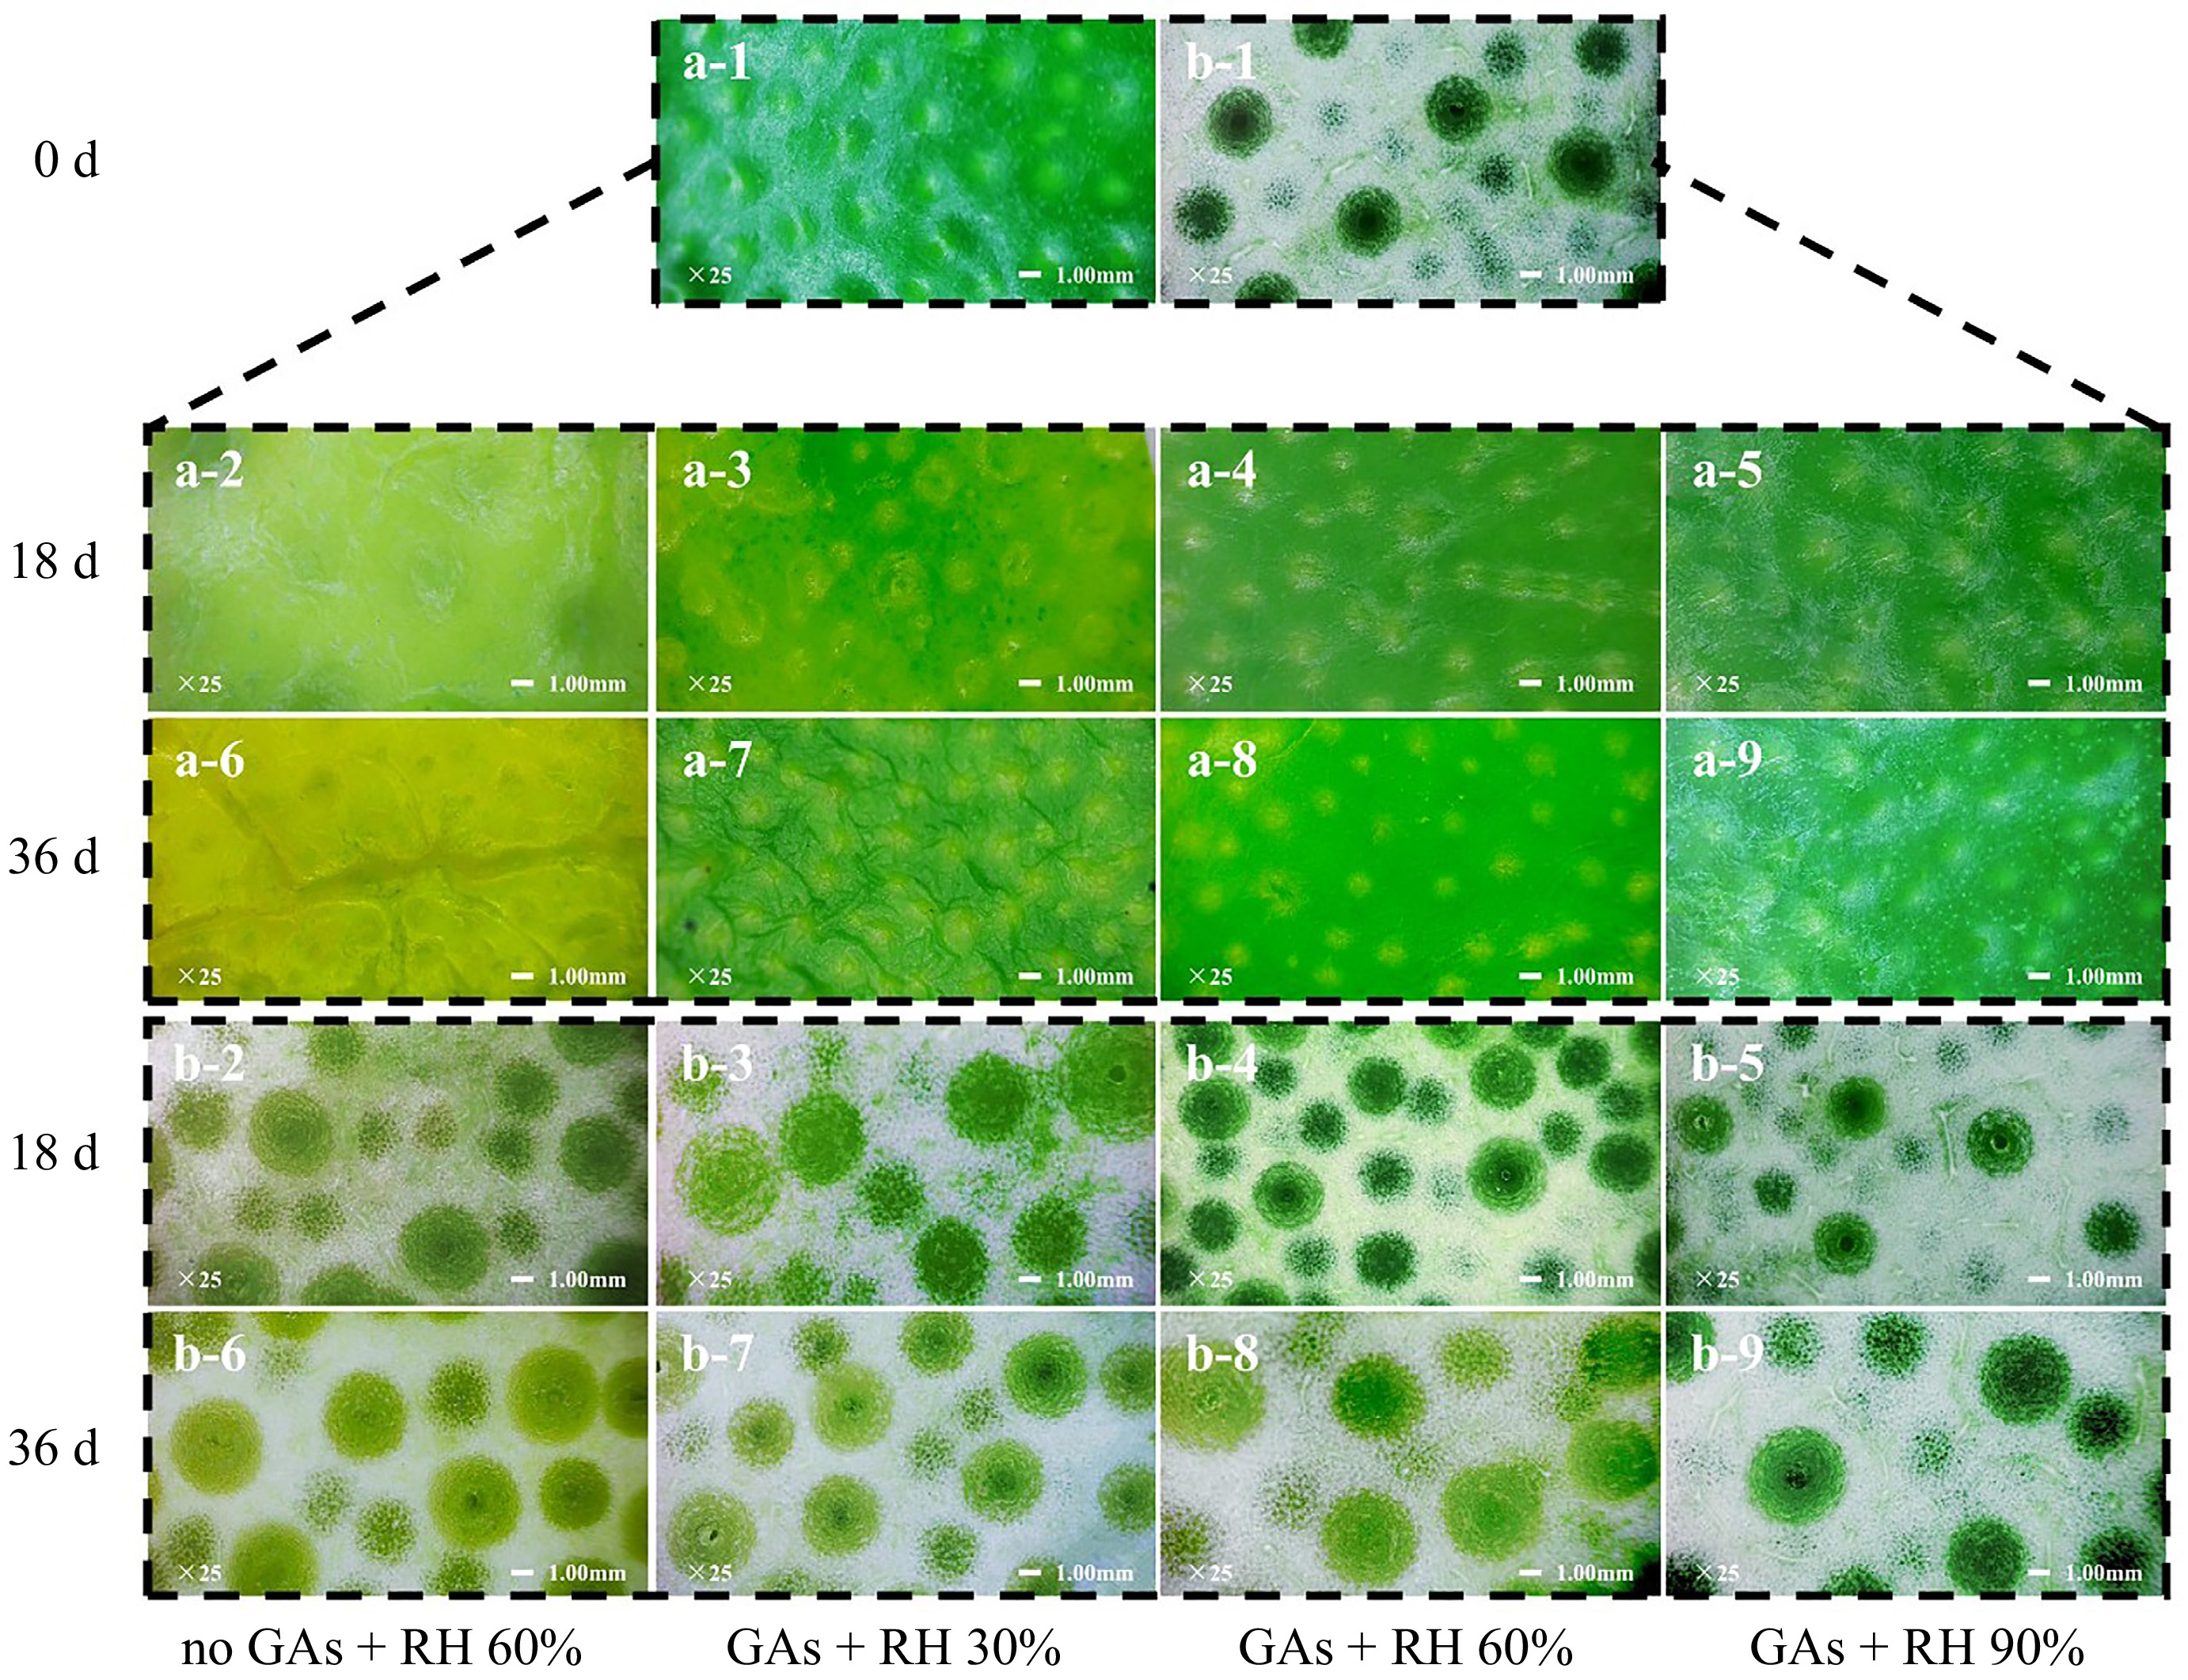
Figure 4.
Microscopic structures of flavedo treated with GAs + RH 30%, GAs + RH 60%, GAs + RH 90%, and no GAs + RH 60% during storage at 14 ± 1 °C for 36 d. (a-1) 25× (bar = 1 mm) the outer side and (b-1) 25× (bar = 1 mm) the inner side of the flavedo on 0 d; (a-2)−(a-5) 25× (bar = 1 mm) the outer side and (b-2)−(b-5) 25× (bar = 1 mm) the inner side of the flavedo on 18 d; (a-6)−(a-9) 25× (bar = 1 mm) the outer side and (b-6)−(b-9) 25× (bar = 1 mm) the inner side of the flavedo on 36 d.
-
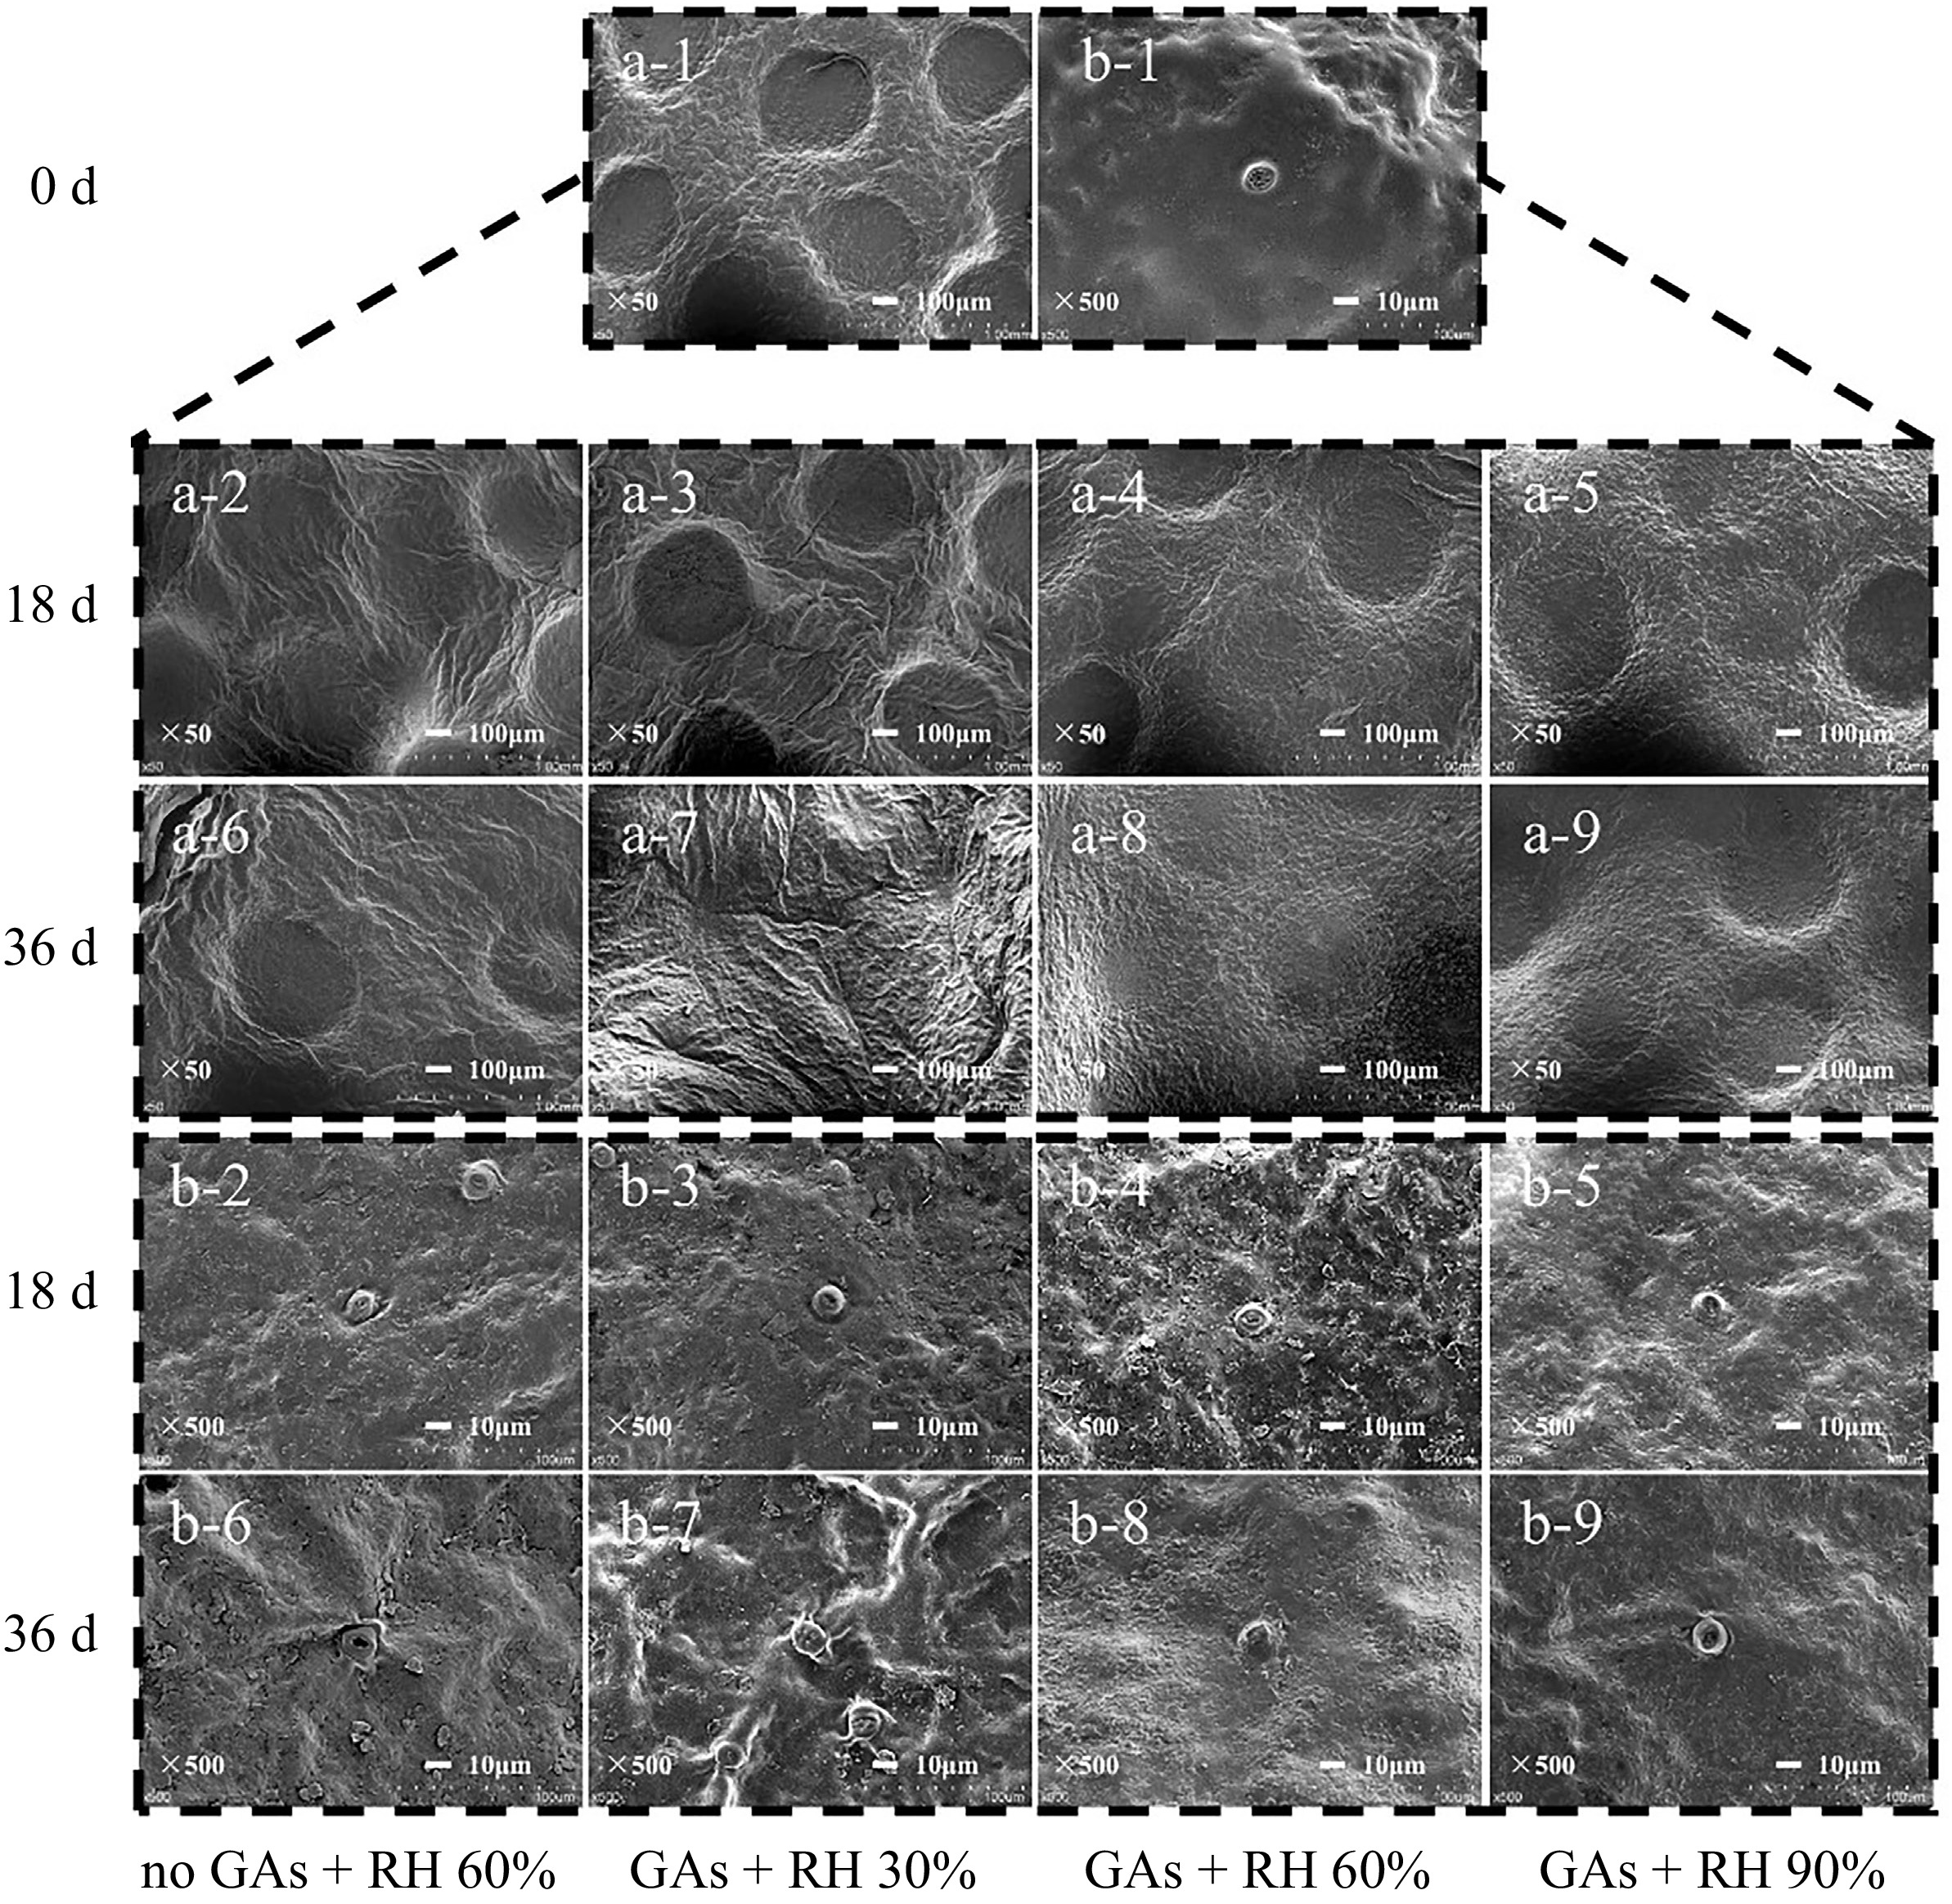
Figure 5.
The SEM analysis of the flavedo treated with GAs + 30% RH, GAs + 60% RH, GAs + 90% RH, and no GAs + 60% RH treatments during storage at 14 ± 1 °C for 36 d. (a-1) 50× and (b-1) 500× (bar = 1 mm) SEM analysis of the pericarp on 0 d. (a-2)−(a-5) 50× and (b-2)−(b-5) 500× (bar = 1 mm) SEM analysis of the pericarp on 18 d. (a-6)−(a-9) 50× and (b-6)−(b-9) 500× (bar = 1 mm) SEM analysis of the flavedo on 36 d.
-
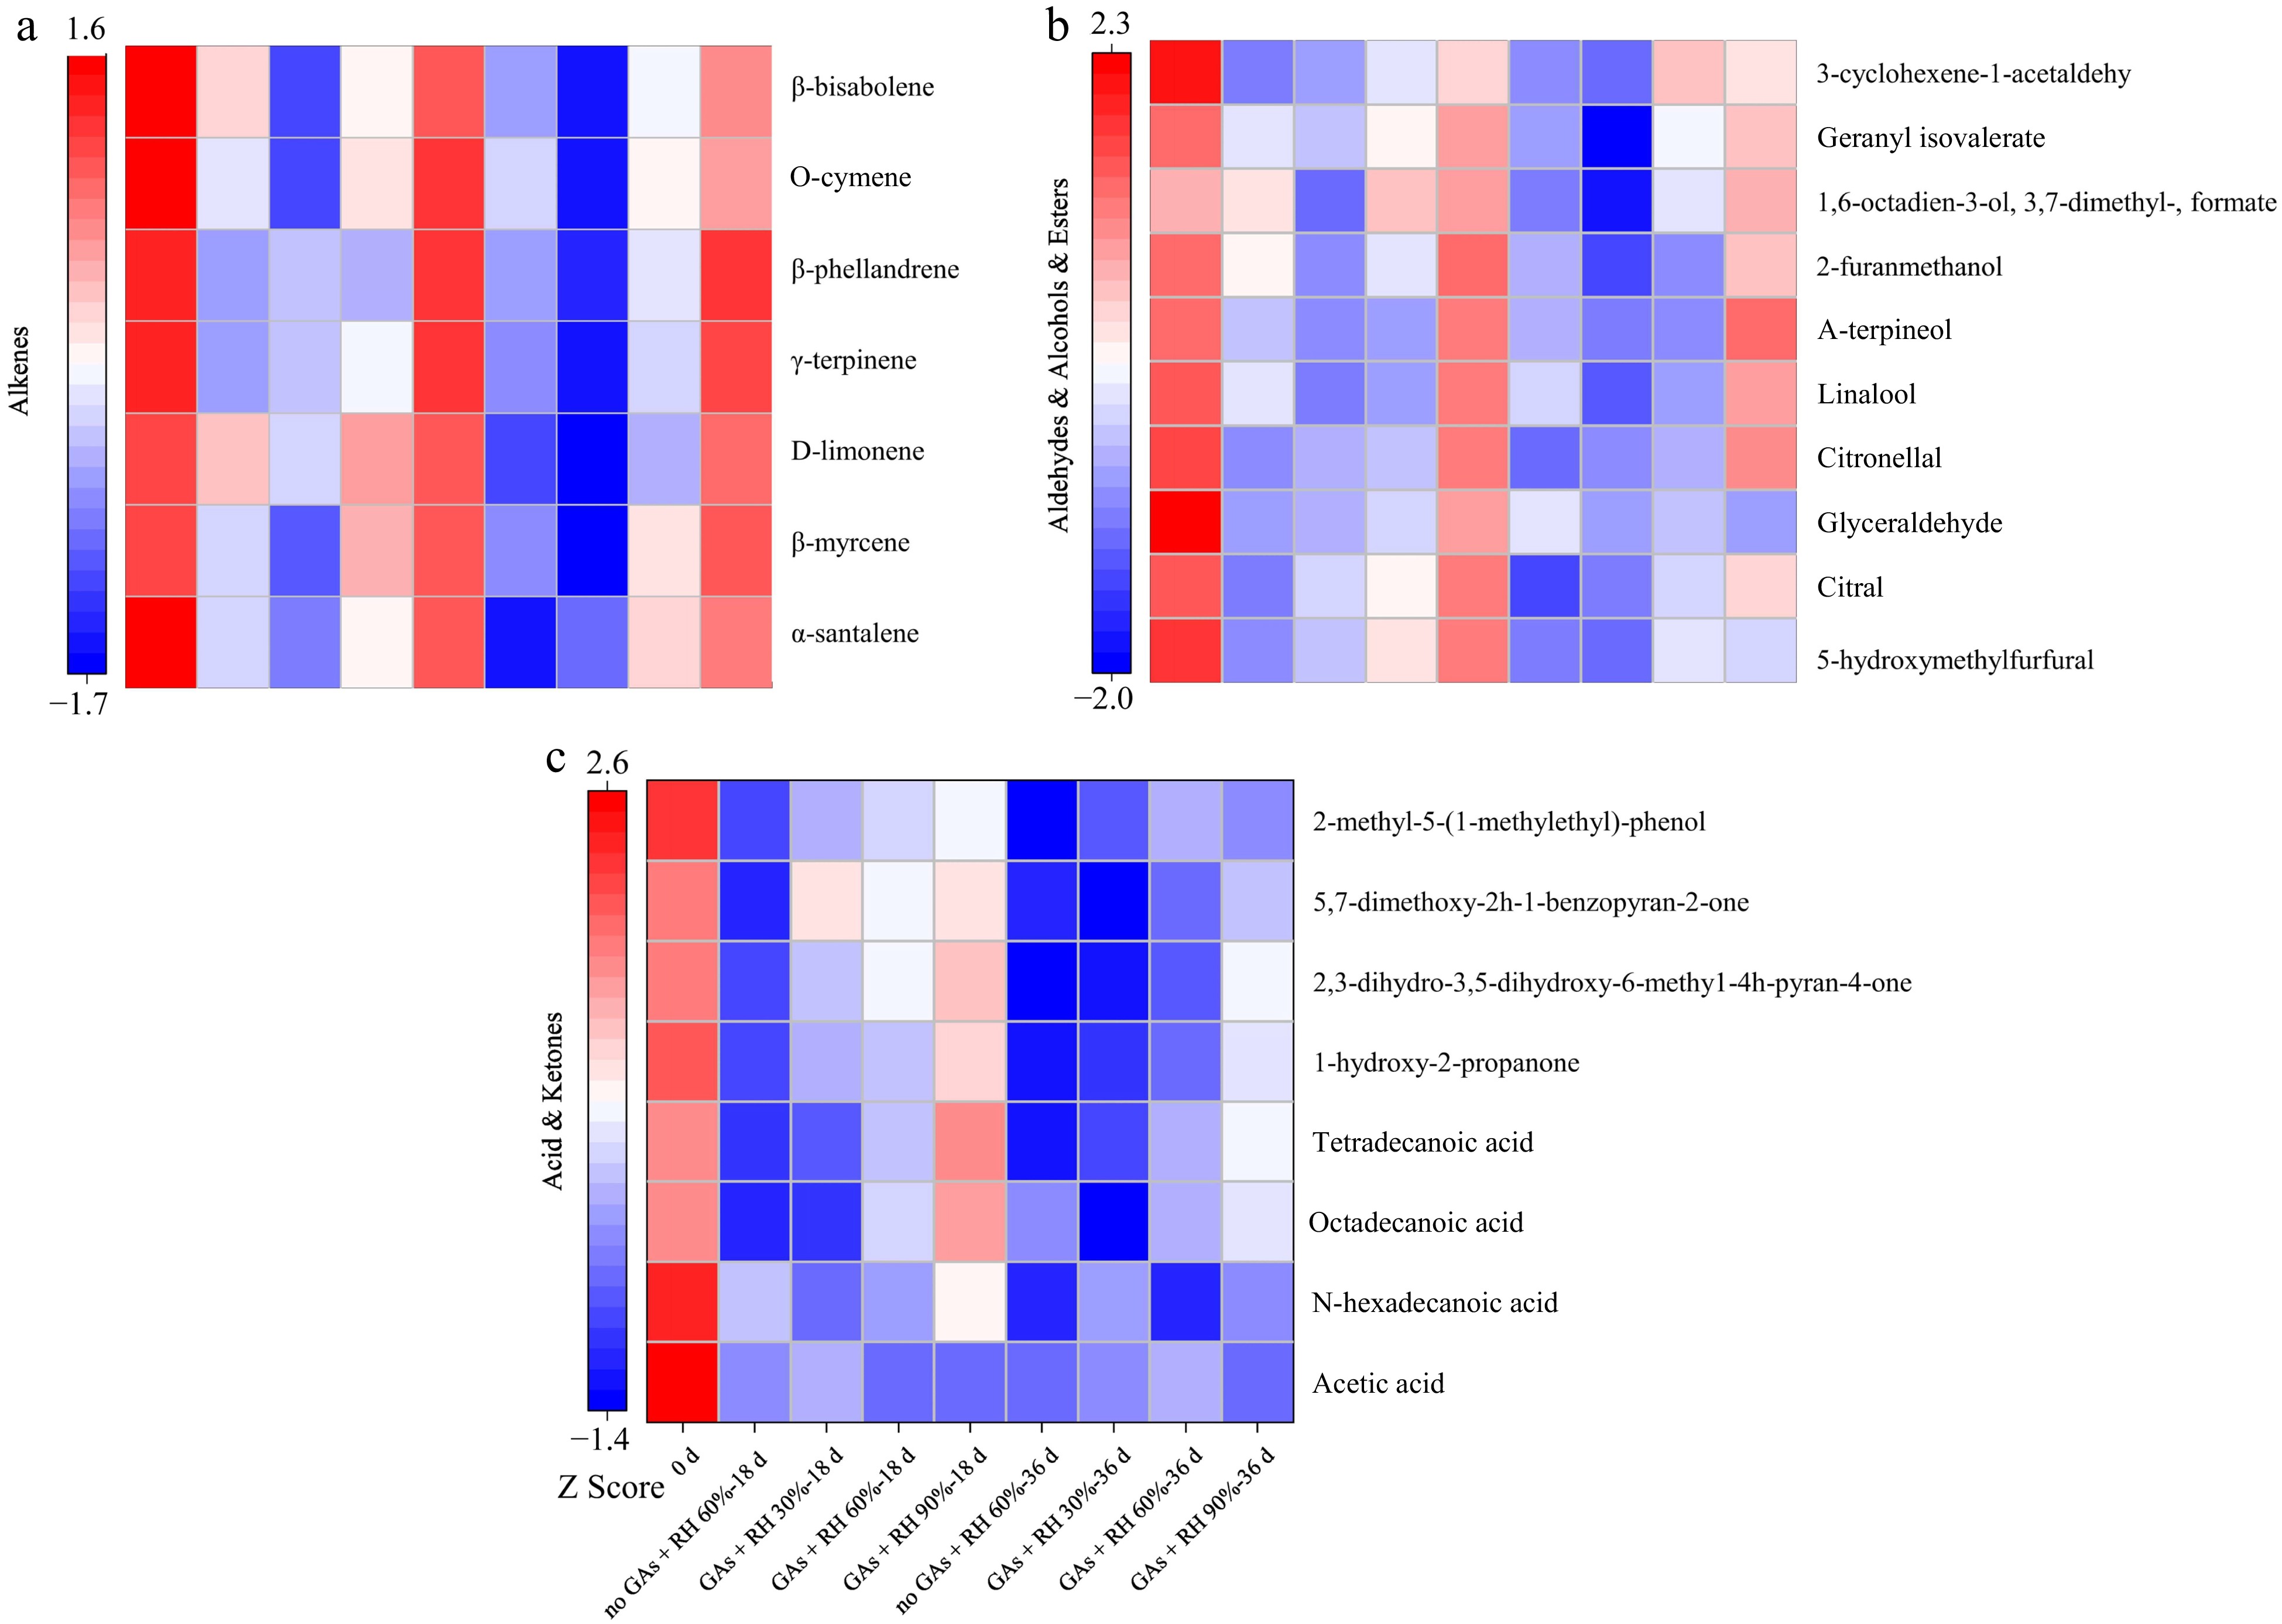
Figure 6.
Heatmaps of volatile compounds from lemon pericarp treated with GAs + RH 30%, GAs + RH 60%, GAs + RH 90%, and no GAs + 60% RH during storage at 14 ± 1 °C for 36 d. (a) Alkenes; (b) aldehydes, alcohols, and esters; (c) acid and ketones. The no GAs + RH 60% on 0 d represents untreated lemons. Z score shows the relative contents after the normalization processing. Z-score color scale represents the differential content of each compound after the implementation of normalization.
Figures
(6)
Tables
(0)