-
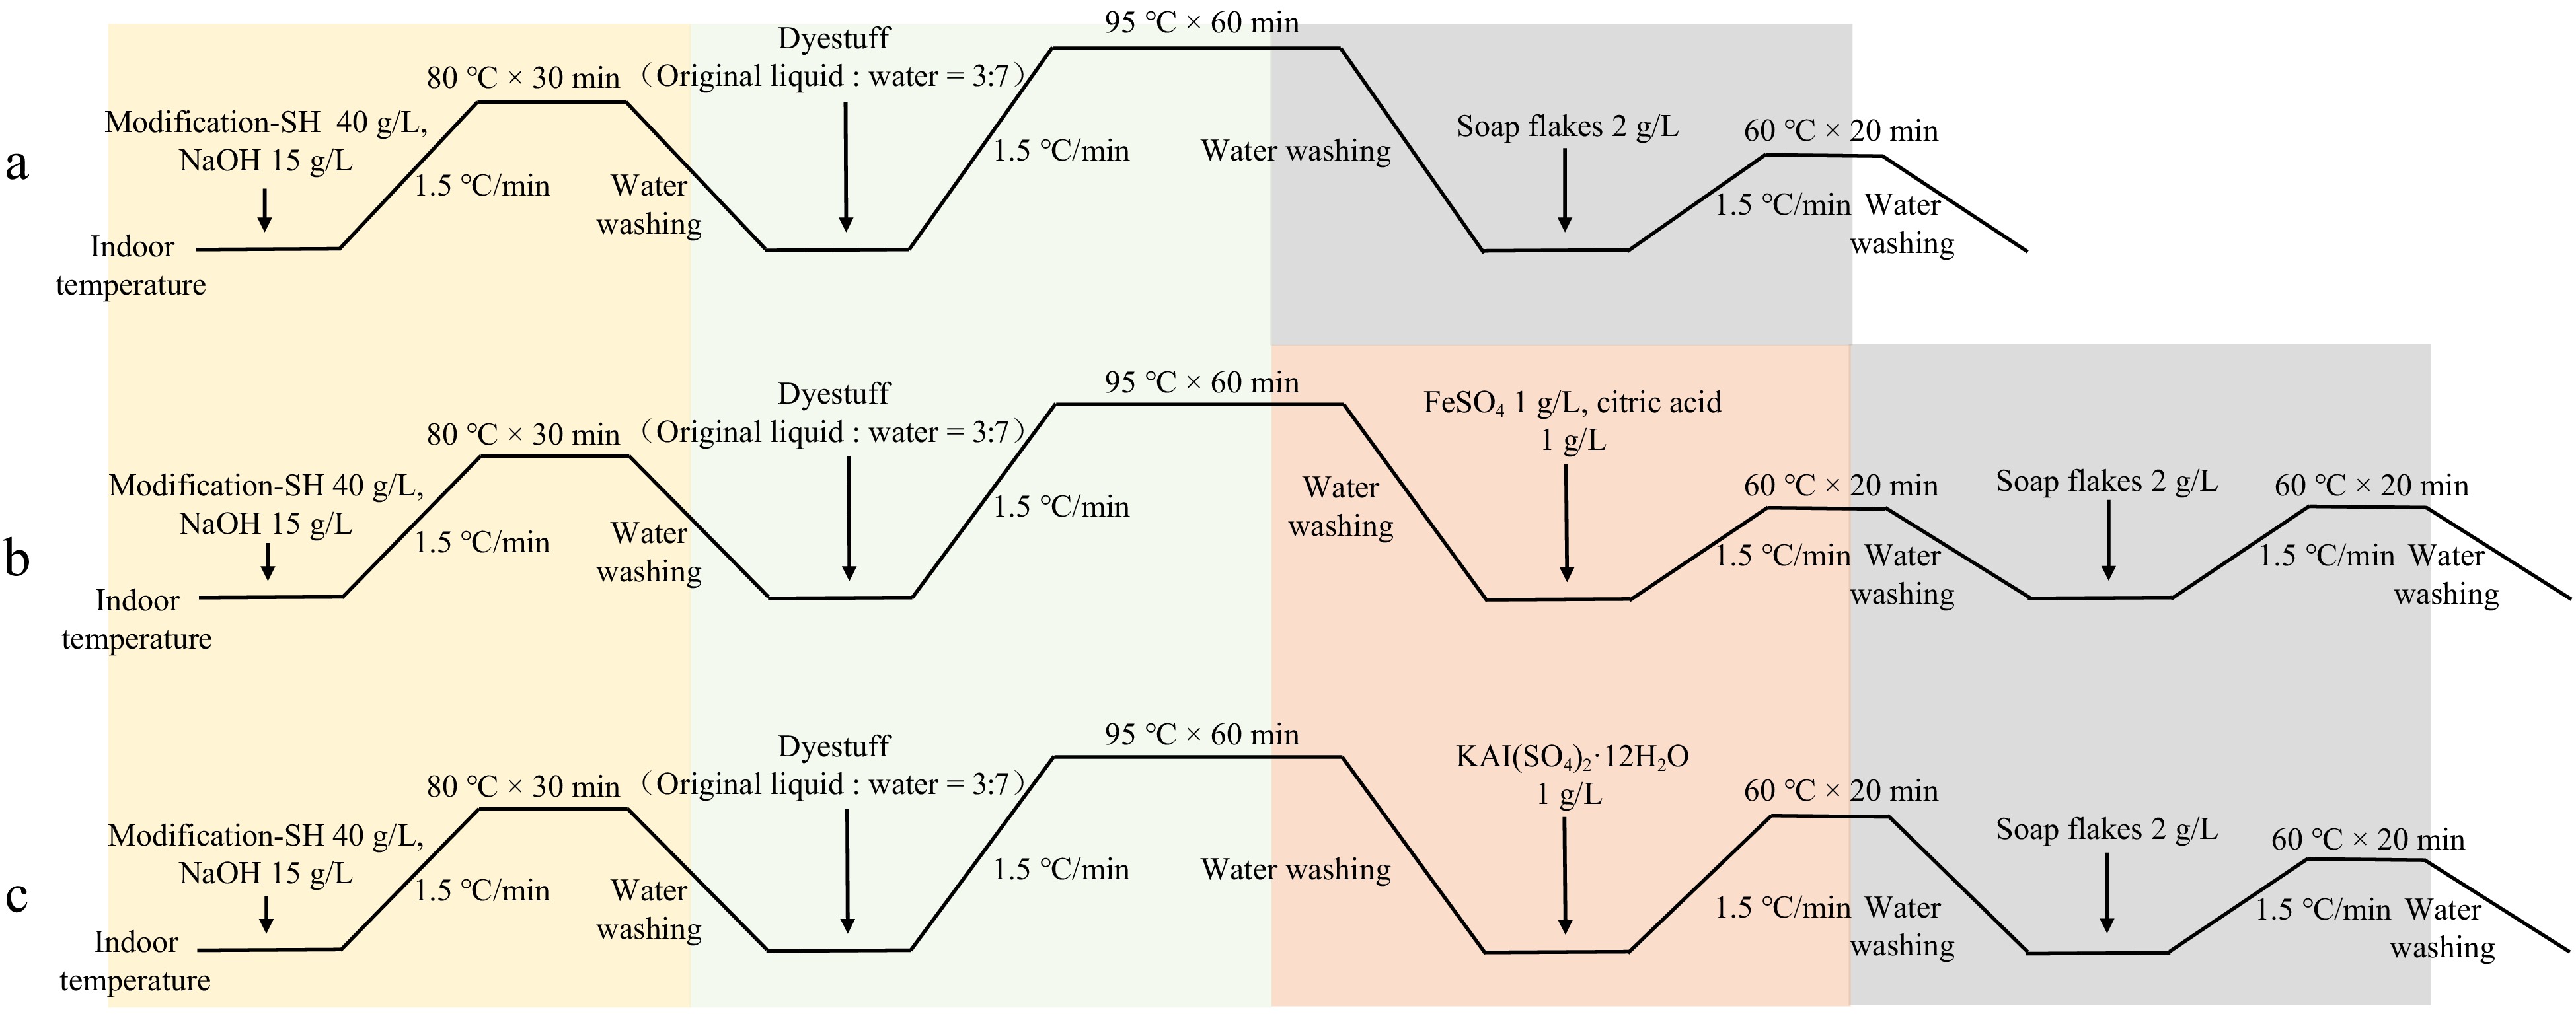
Figure 1.
Dyeing process flow chart for plant dyes. (a) Direct dyeing process flow with plant dyes. (b) Post-mordanting process flow with FeSO4 as a mordant for plant dyes. (c) Post-mordanting process flow with KAl(SO4)2·12H2O as a mordant for plant dyes. SH refers to thiol-based modifiers.
-
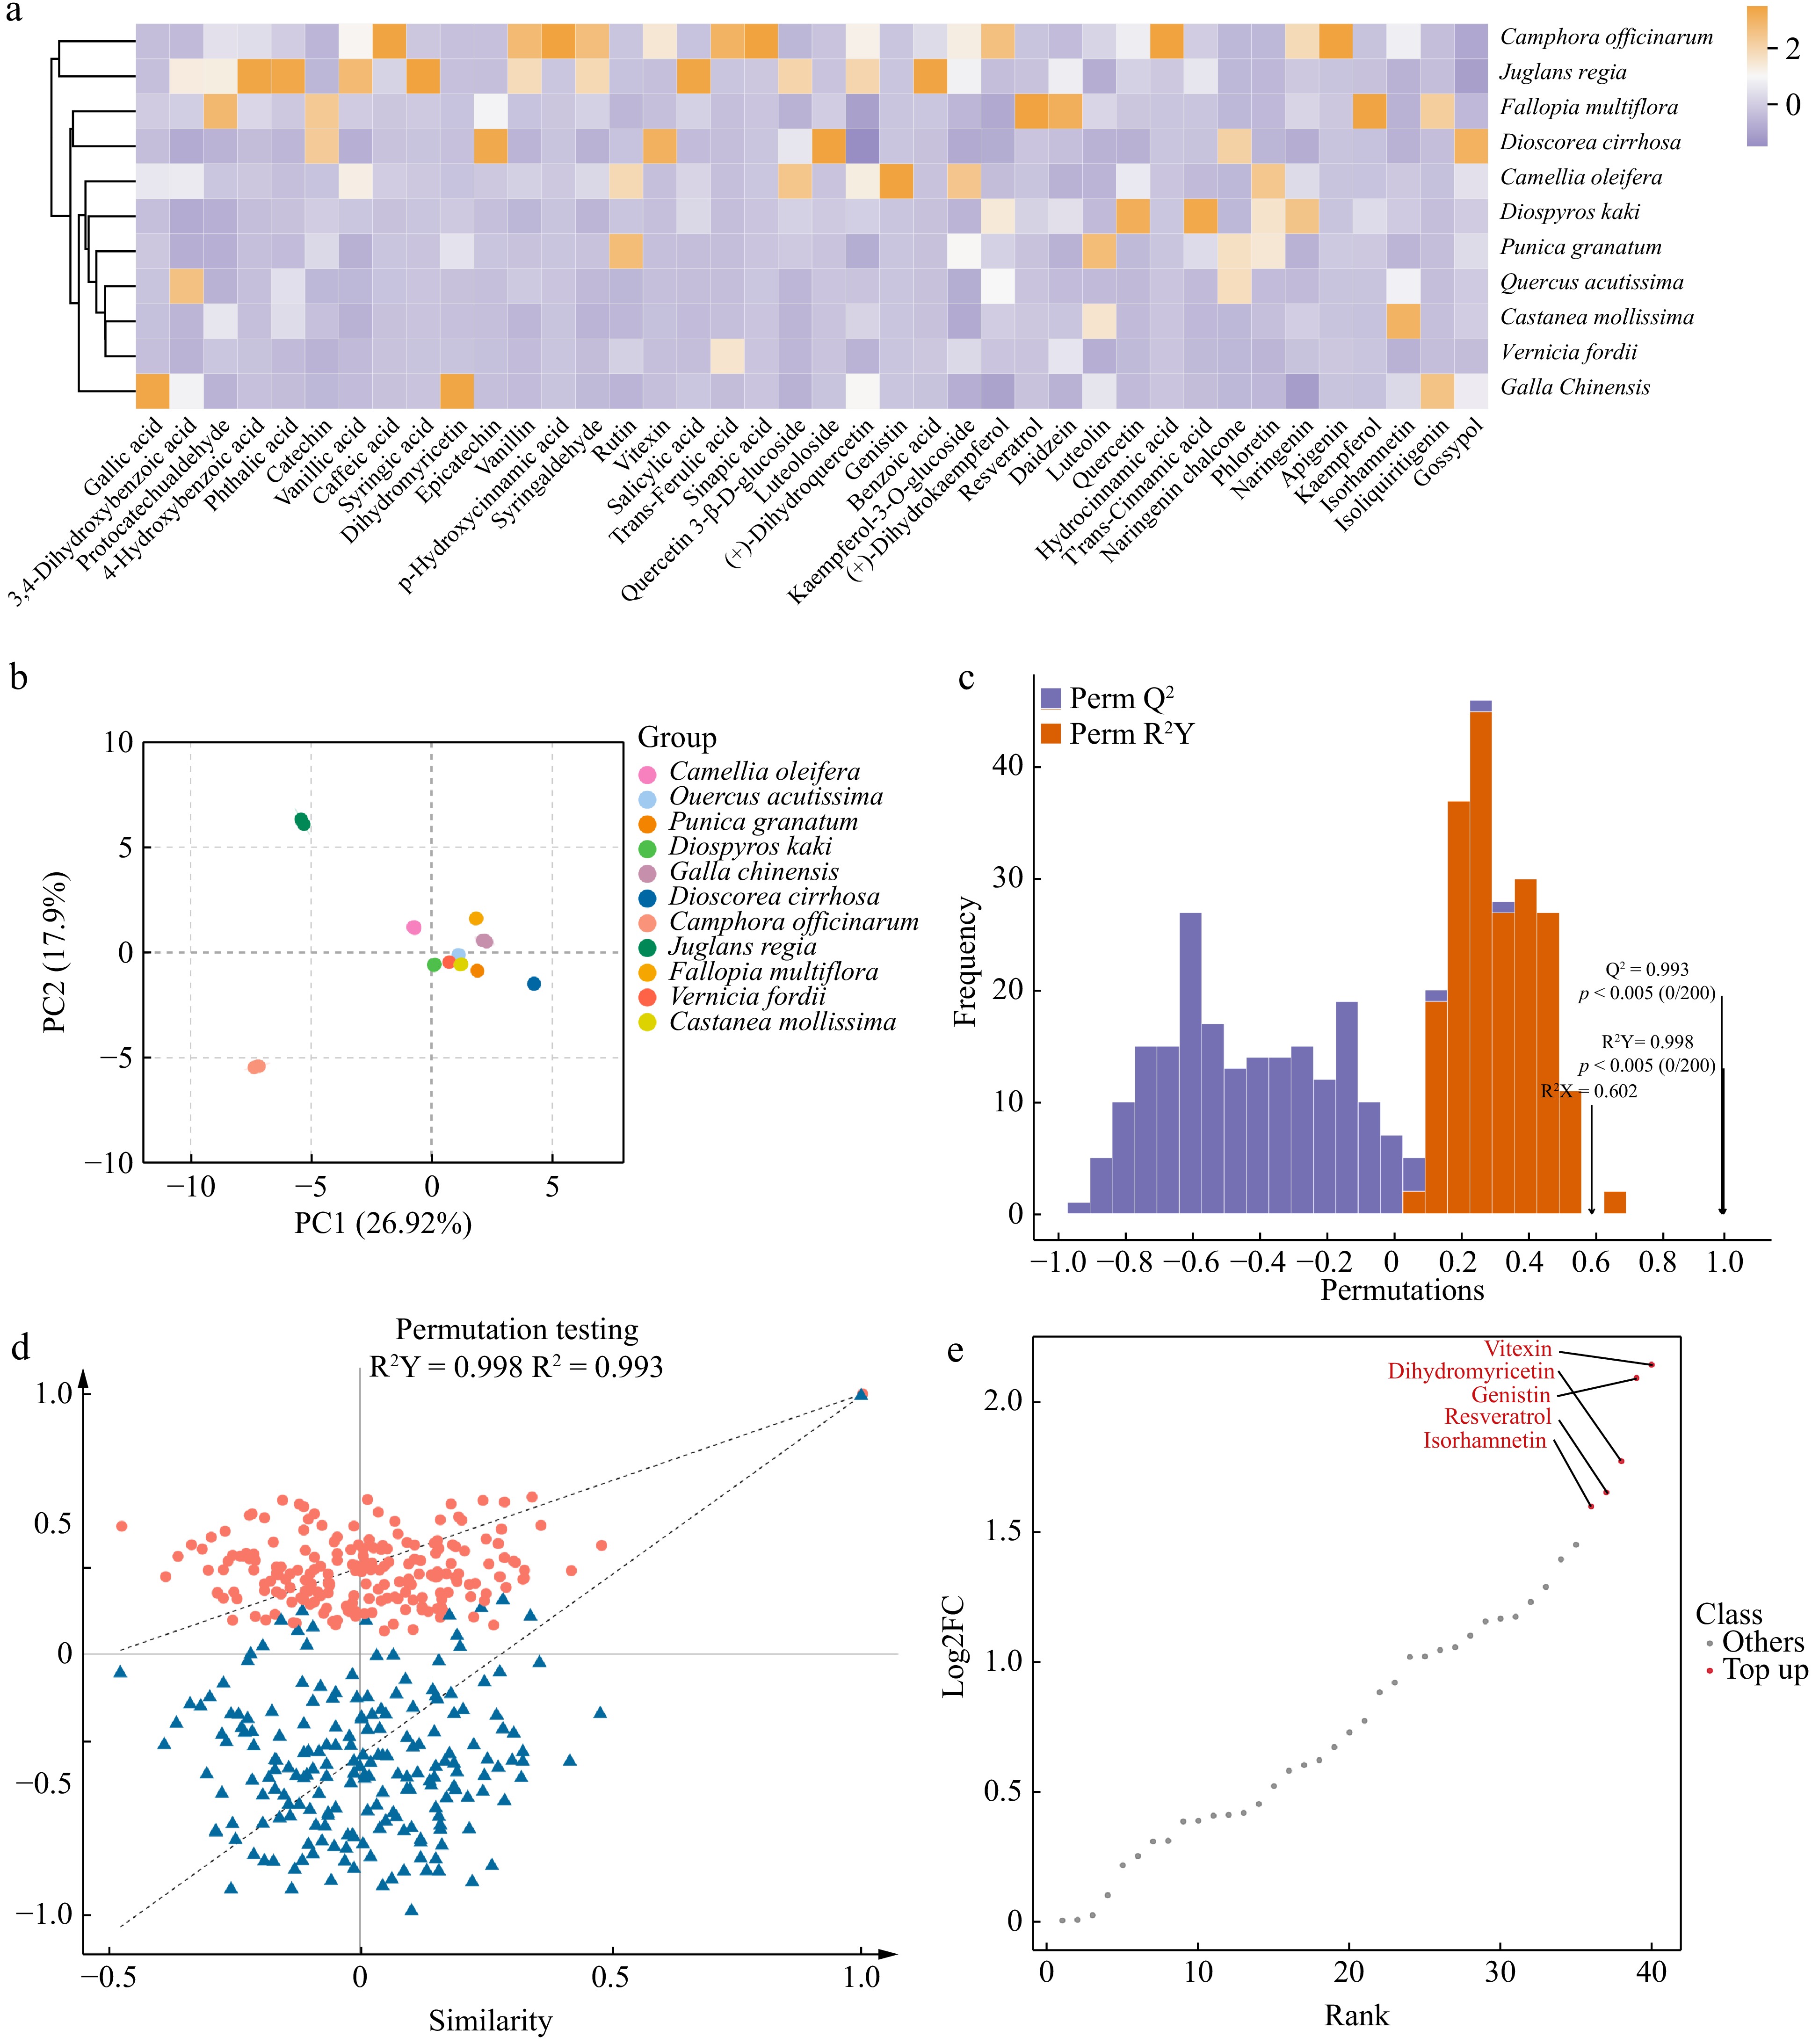
Figure 2.
Analysis of polyphenolic metabolites in 11 plants. (a) Heatmap of polyphenolic compound content, showing the relative content of polyphenolic compounds in 11 plants. The color gradient reflects the distribution differences in metabolites among plants, with darker colors indicating higher contents. (b) Principal component analyses (PCA) of polyphenolic metabolites in 11 plants. PC1 indicates the first principal component, PC2 indicates the second principal component, and the percentage indicates the explanation rate of this principal component to the data set. PCA score plot, clearly revealing the clustering characteristics and differences in polyphenolic metabolites across 11 plants based on the distribution of PC1 and PC2. (c) OPLS-DA model validation plot, demonstrating the model's high explanatory power (R²Y) and excellent predictive performance (Q²) for polyphenolic metabolite data. (d) OPLS-DA permutation test plot, confirming the absence of overfitting and further validating the statistical reliability of this model. (e) Differential metabolite dynamics map, highlighting the variation patterns of the five most considerably different polyphenolic metabolites among the 11 plants.
-
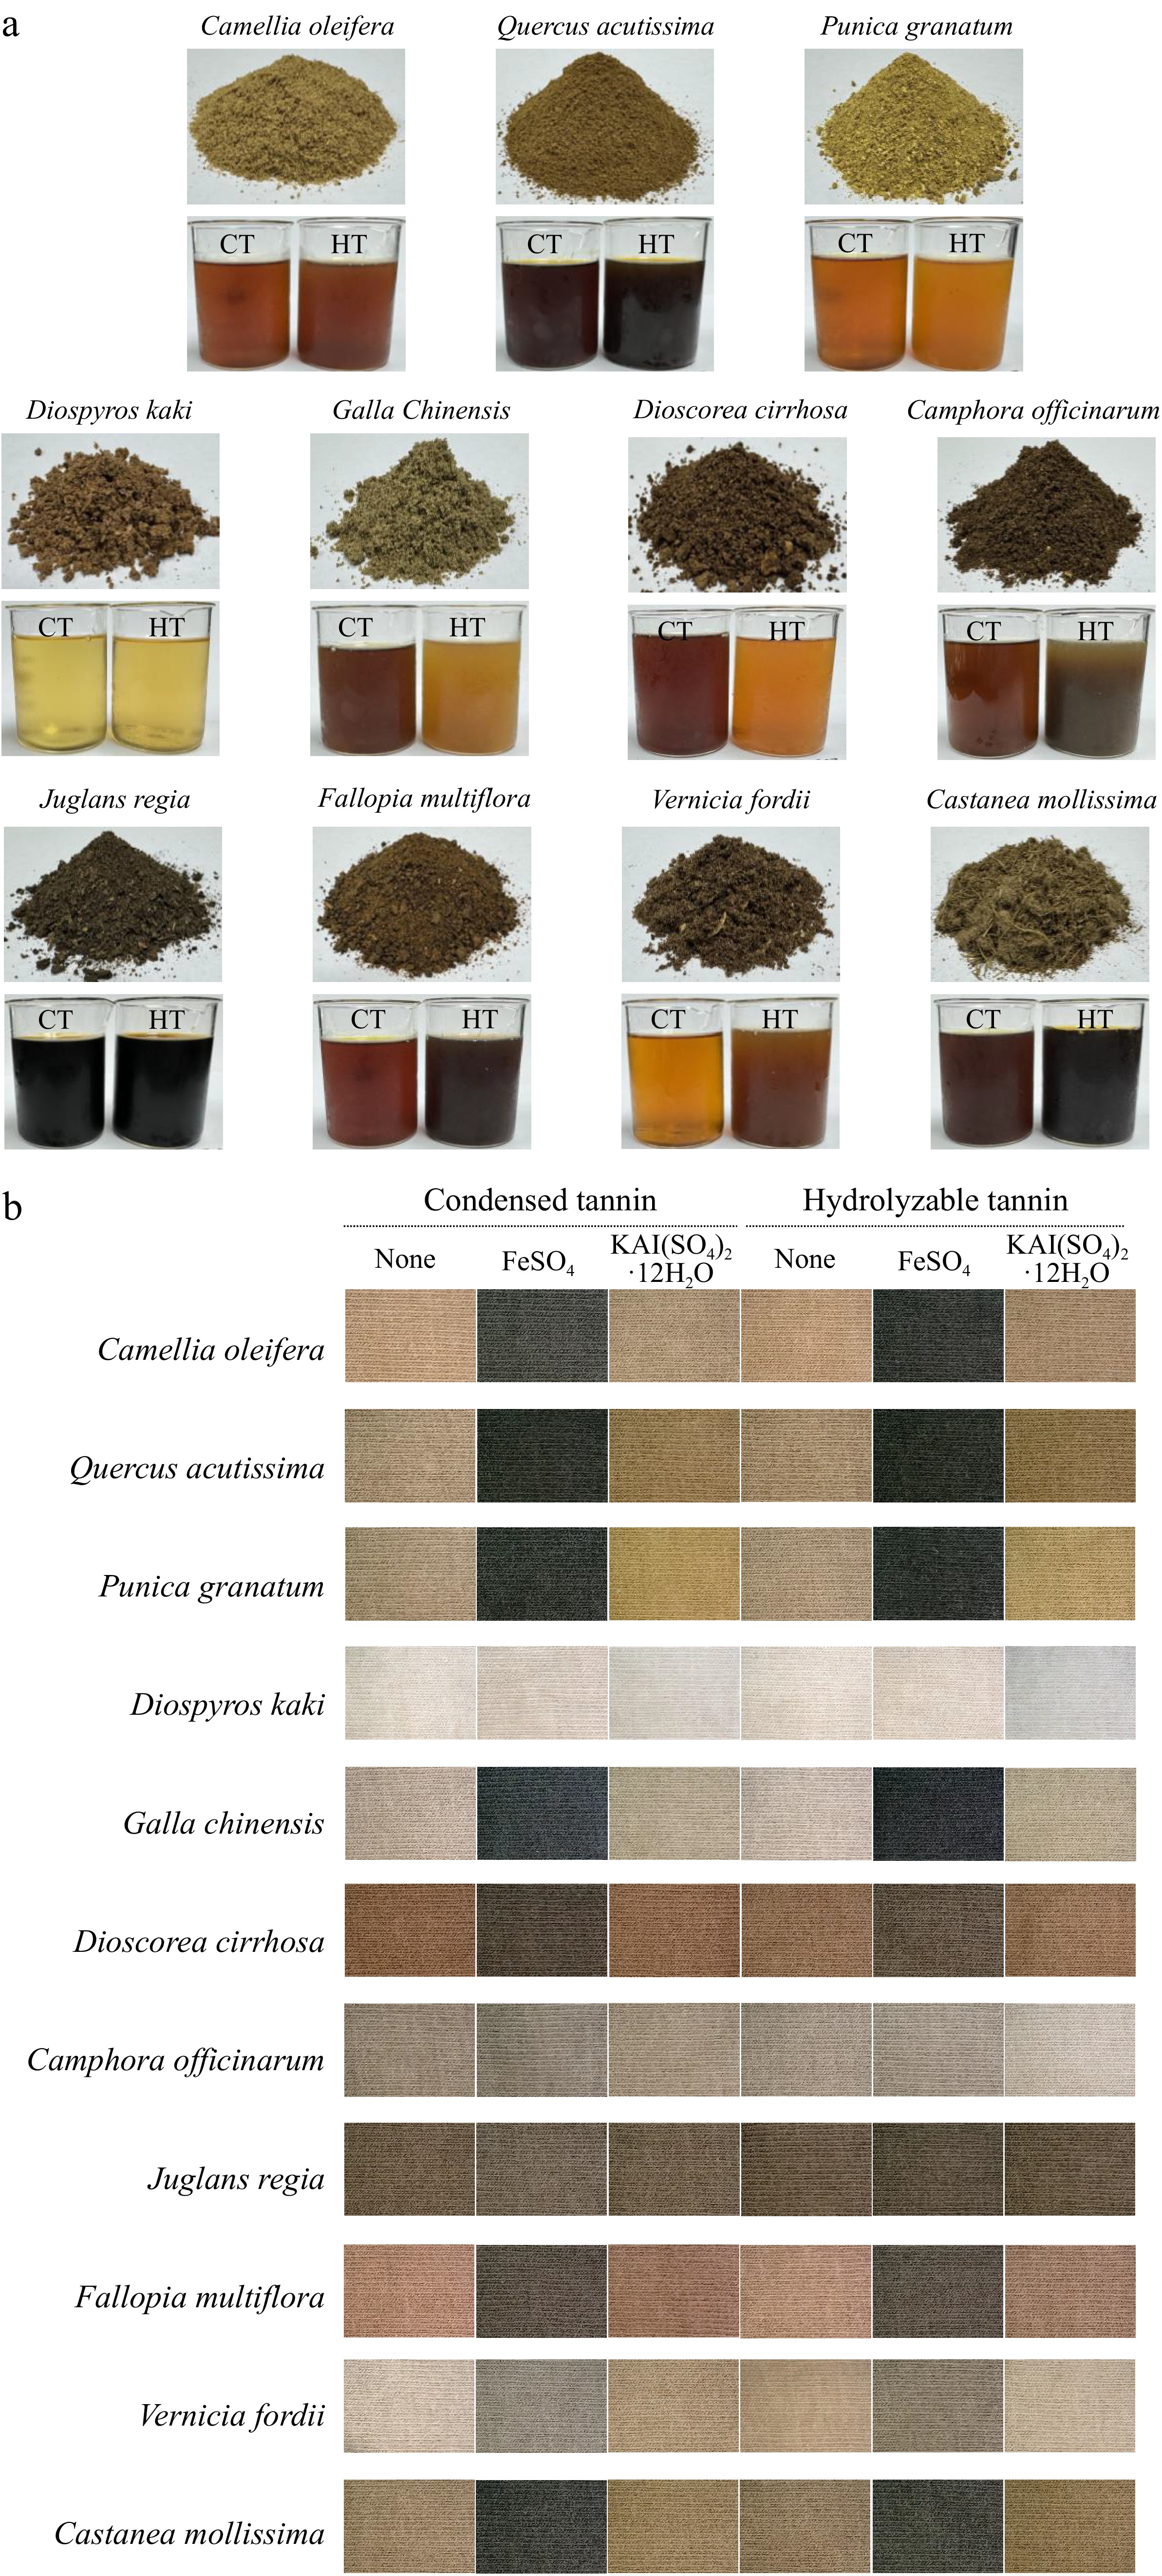
Figure 3.
Plant dyes and dyeing results. (a) Photos of the powder and extracted dye solutions from the 11 plant dyes. CT refers to the dye solution extracted using 60% ethanol as the solvent, with condensed tannins as the main component; while HT refers to the dye solution extracted using water as the solvent, with hydrolysable tannins as the main component. (b) Dyeing results of cotton fabrics with different plant dyes and mordants.
-
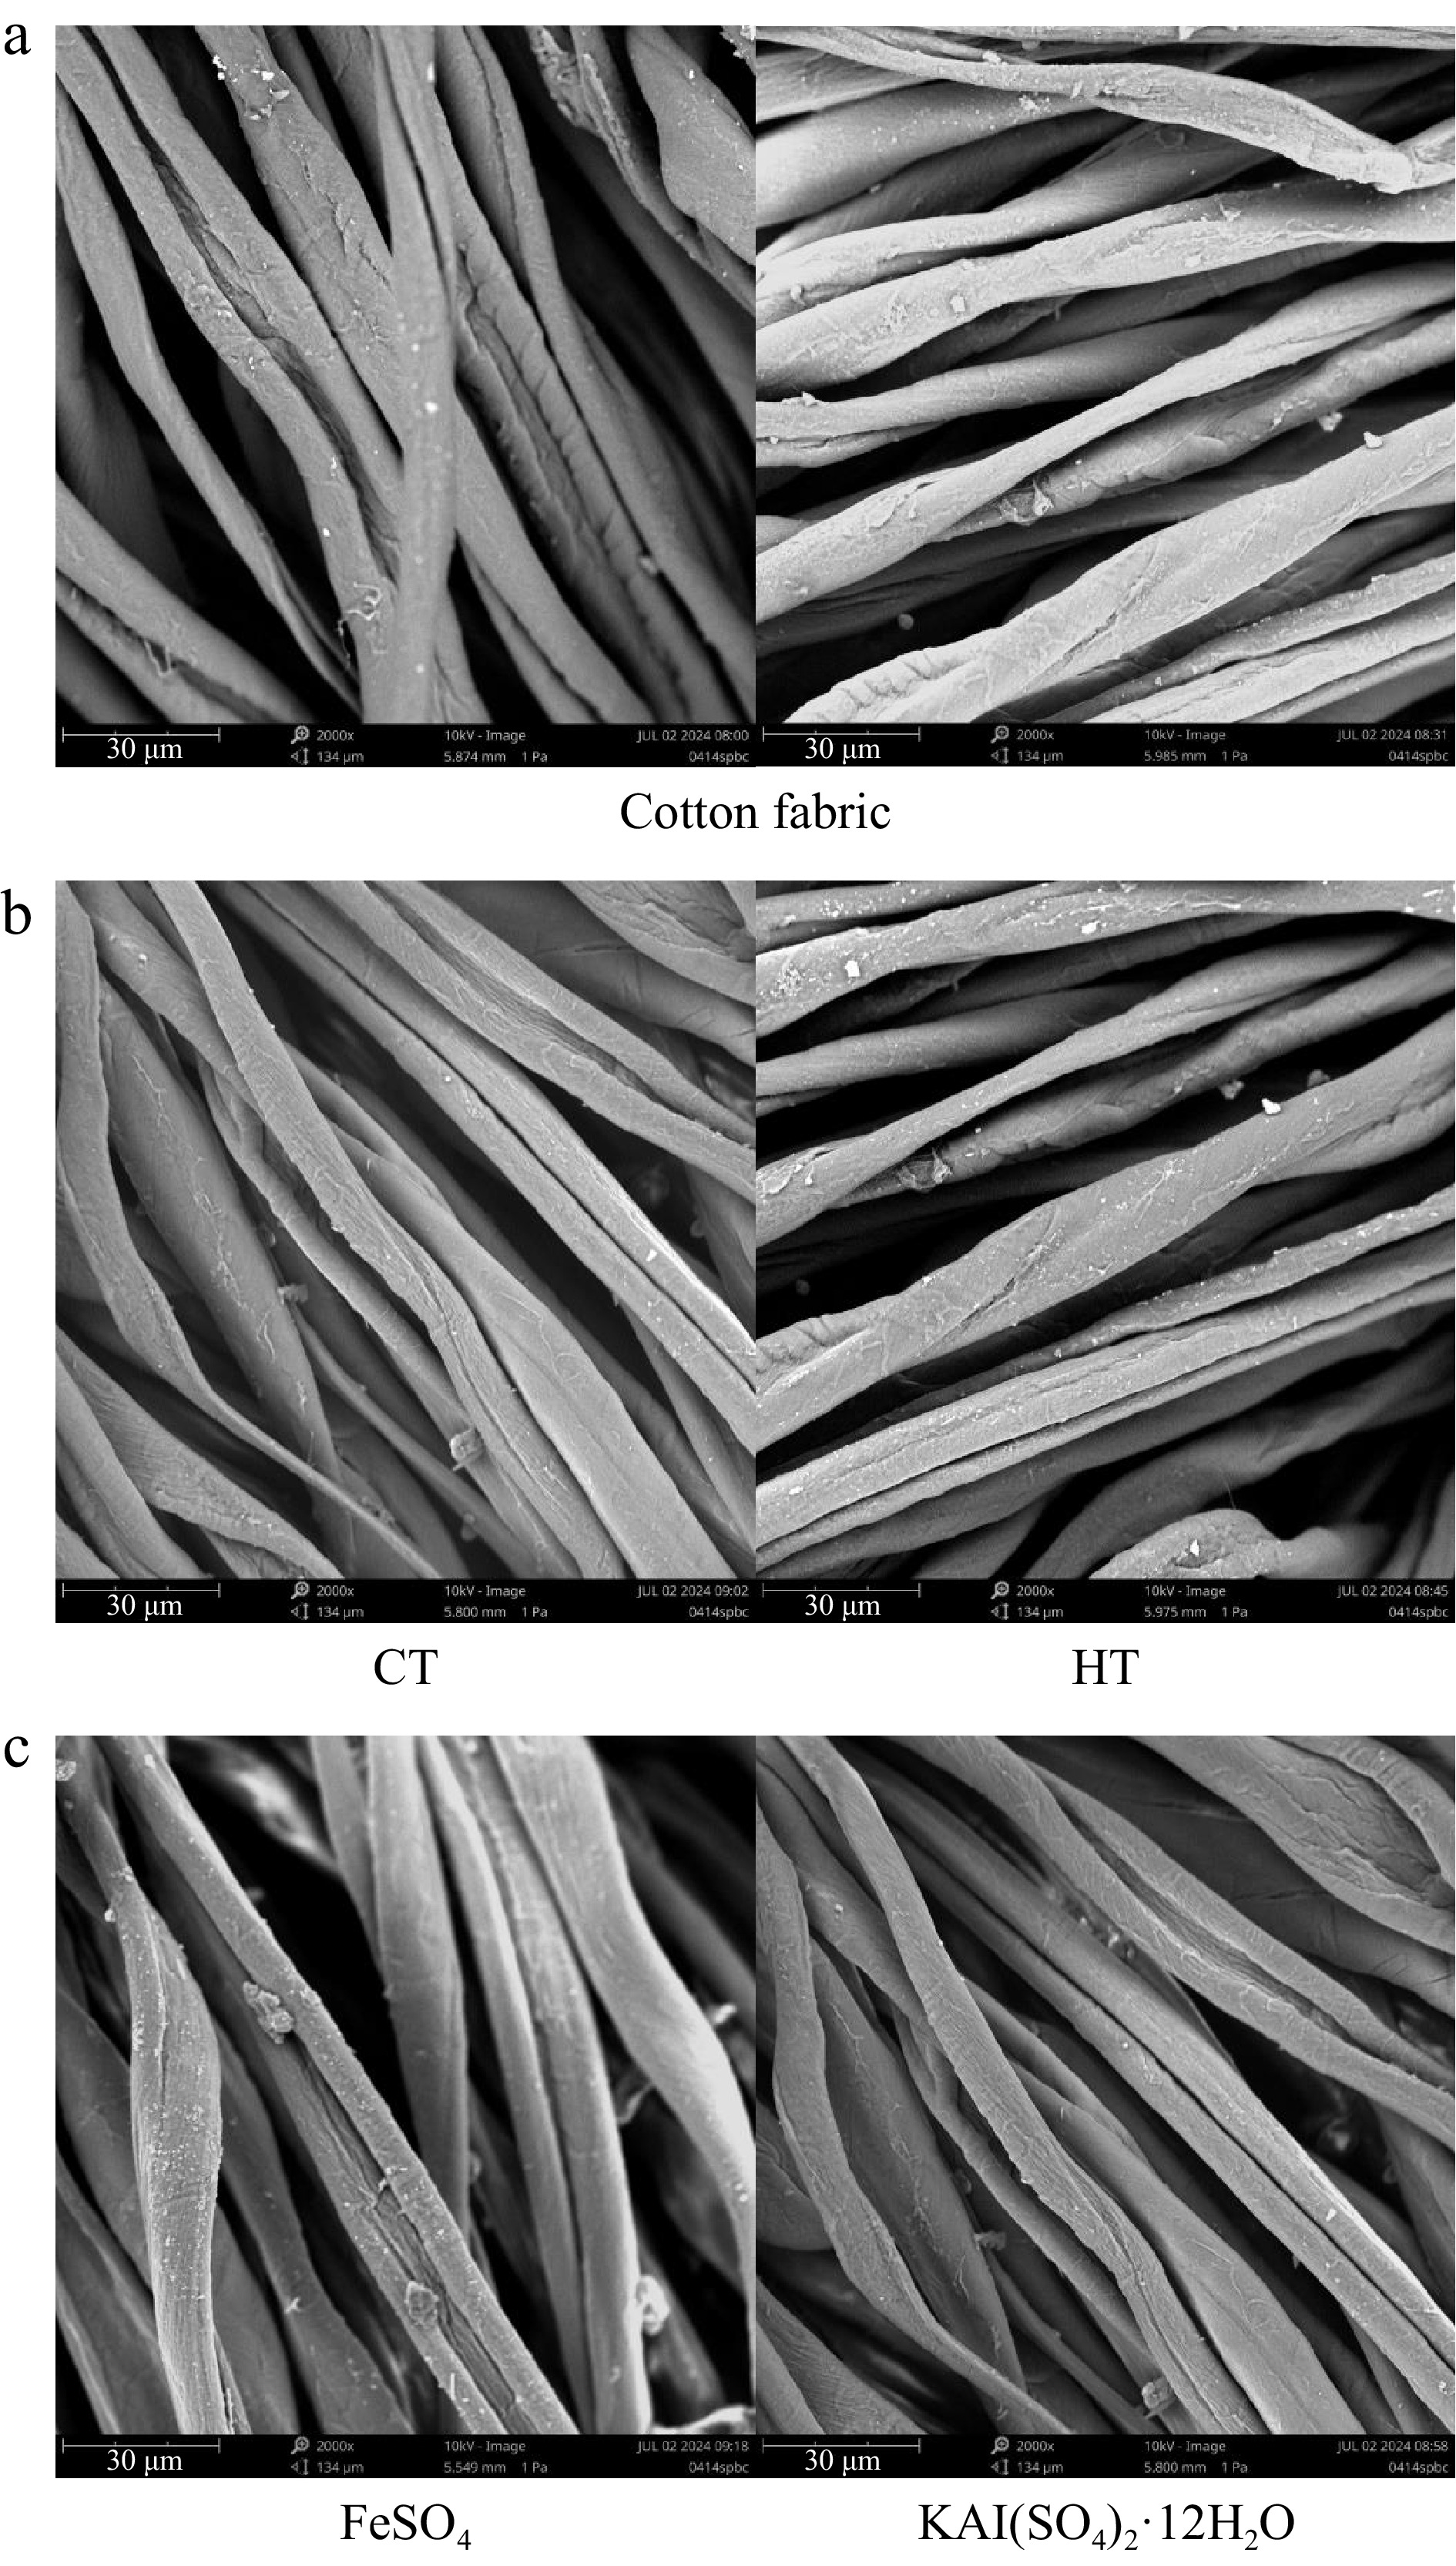
Figure 4.
Surface morphology of cotton fabrics. (a) Surface morphology of untreated cotton fabric. (b) Surface morphology of cotton fabric directly dyed with different plant dye components from Camphora officinarum seeds. CT refers to the dye solution extracted using 60% ethanol as the solvent, with condensed tannins as the main component, while HT refers to the dye solution extracted using water as the solvent, with hydrolysable tannins as the main component. (c) Surface morphology of cotton fabric after post-mordanting with different mordants using plant dyes from C. officinarum seeds.
-
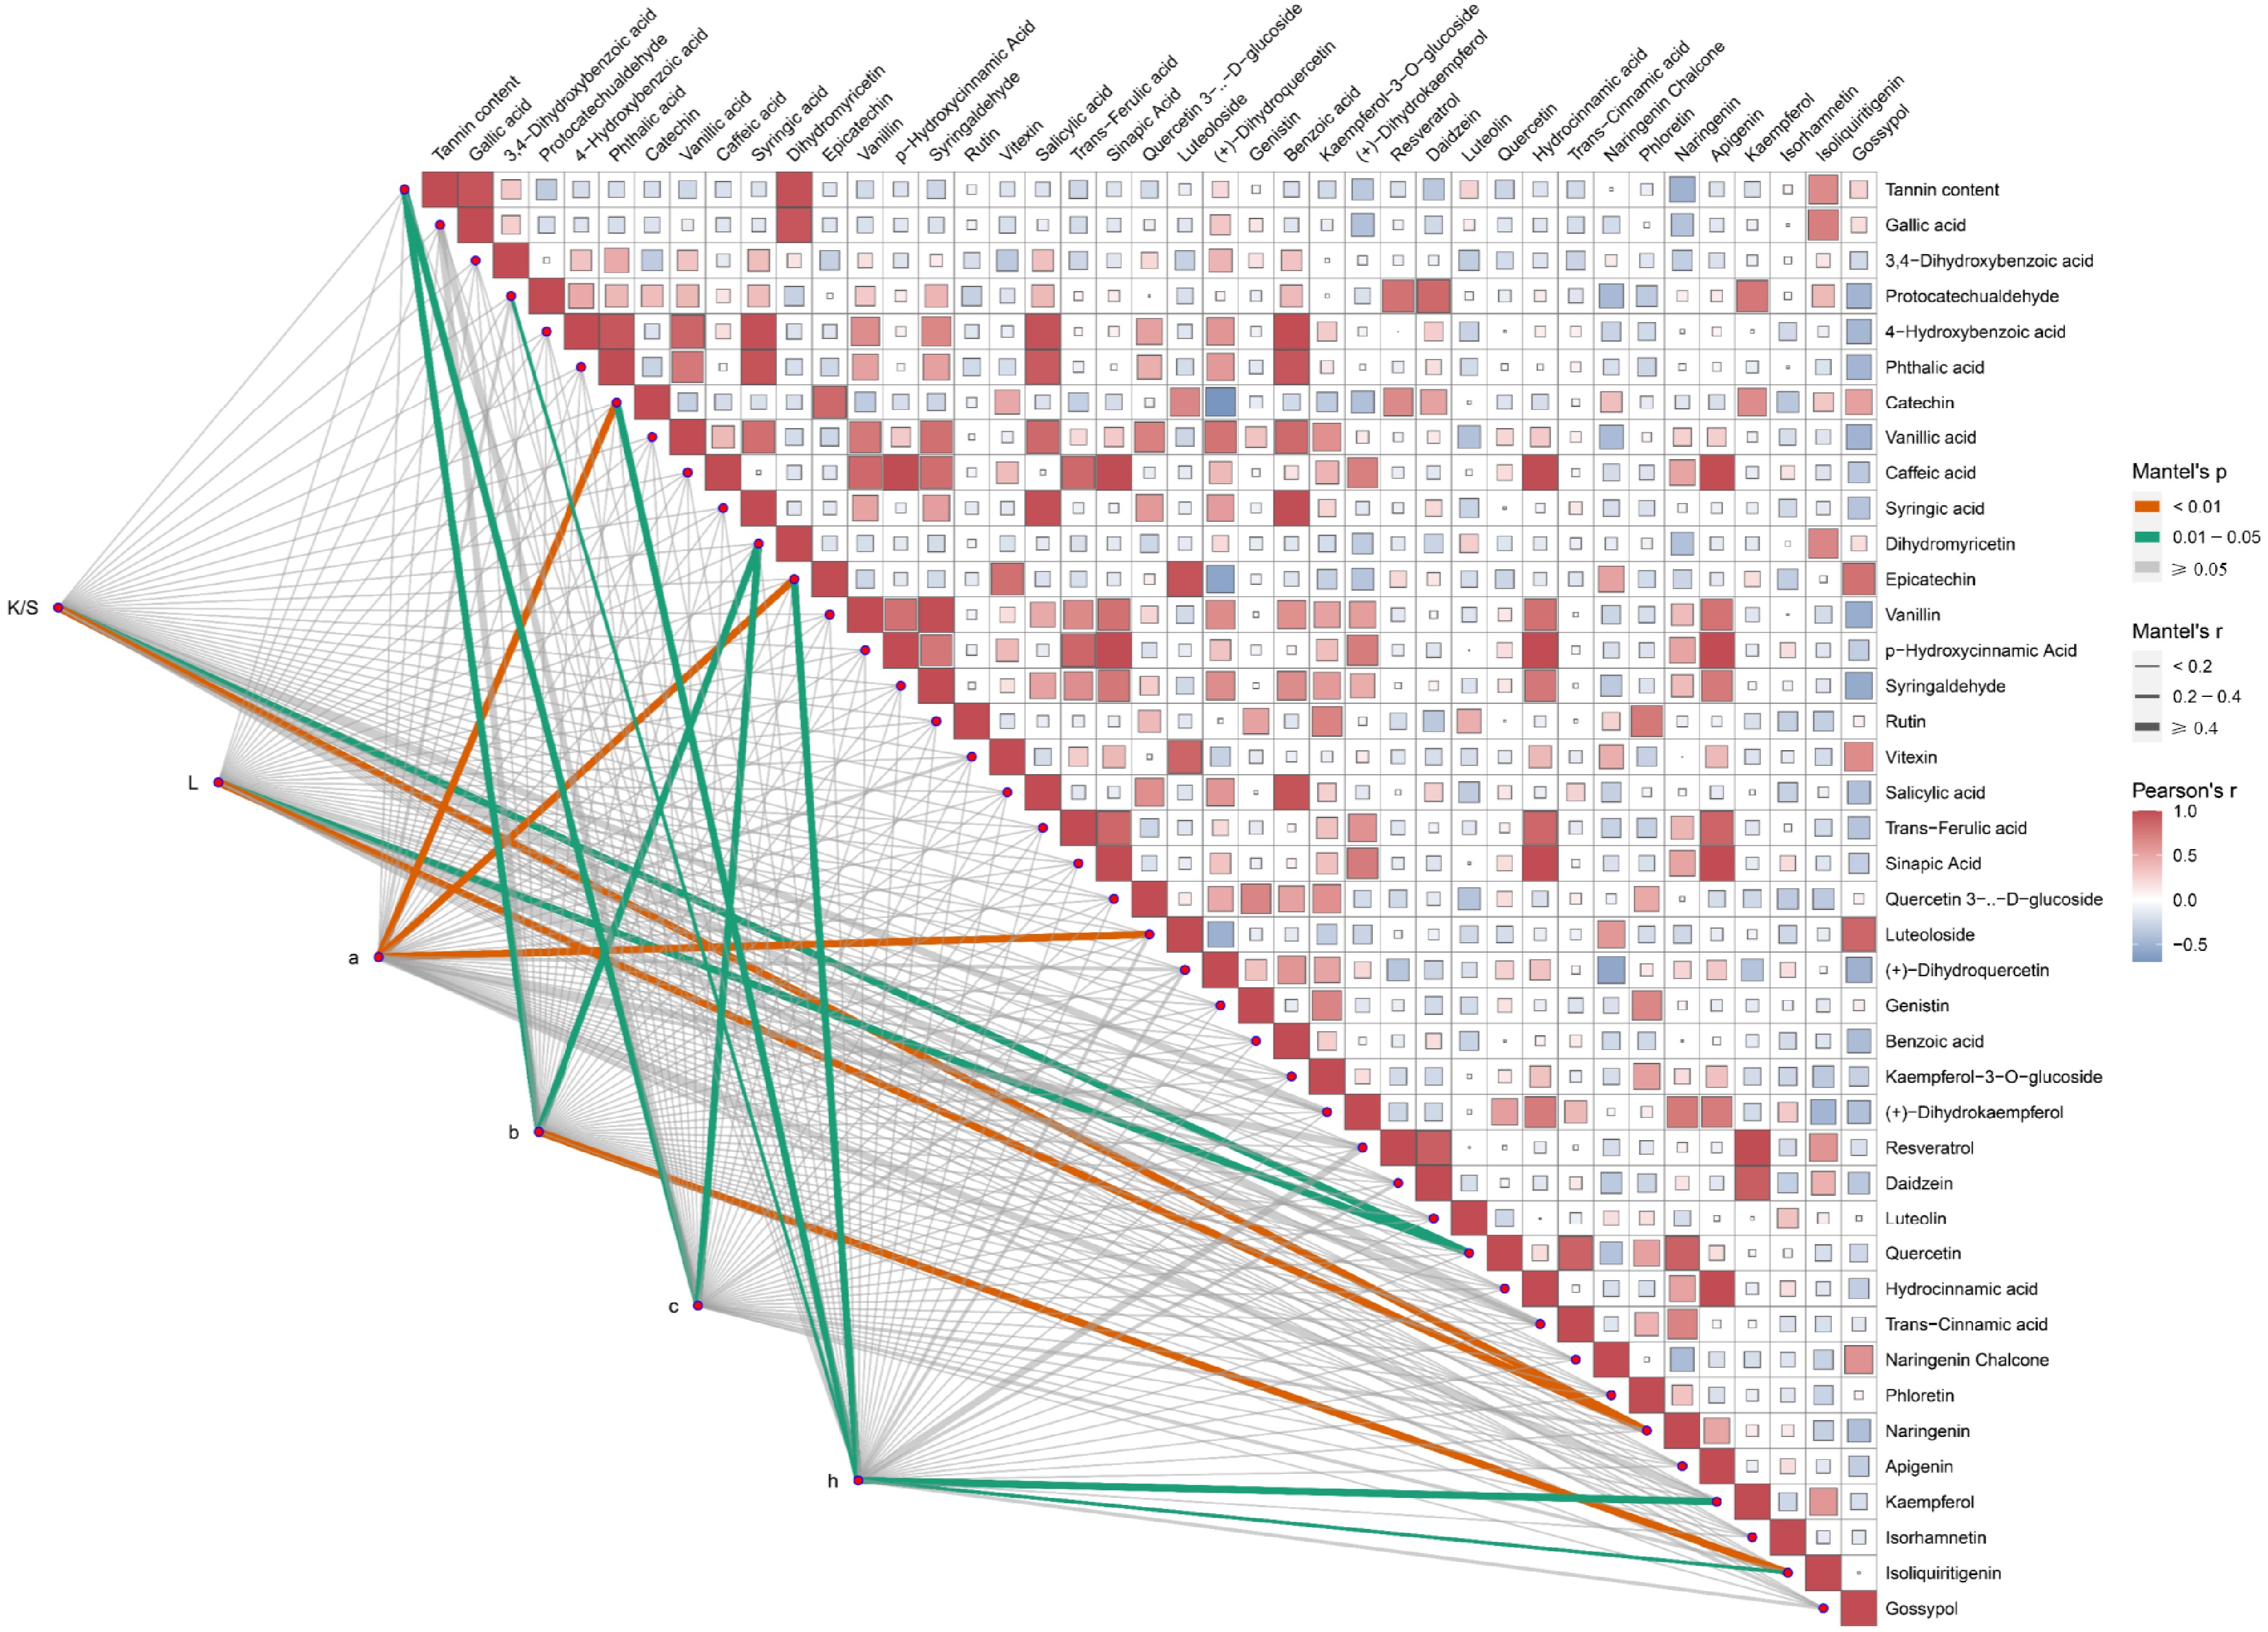
Figure 5.
The content of polyphenols is considerably related to the dyeing performance of plant dyes on cotton fabrics. The Mantel test analysis was used to examine the correlation between CIE L*a*b* values and each of the 40 polyphenol metabolites. K/S represents the ratio of the dye absorption coefficient (k) to the dye scattering coefficient (s), L represents lightness, a represents the red-green coordinate, b represents the yellow-blue coordinate, c represents color saturation, and h represents hue. Orange lines indicate highly significant relationships (Mantel's p < 0.01), and green lines indicate significant relationships (0.01 ≤ Mantel's p < 0.05). The width of the lines corresponds to Mantel's r statistic, reflecting the respective distance correlations. Pairwise comparisons of polyphenol metabolites are shown, with a color gradient denoting Pearson's correlation coefficient.
-
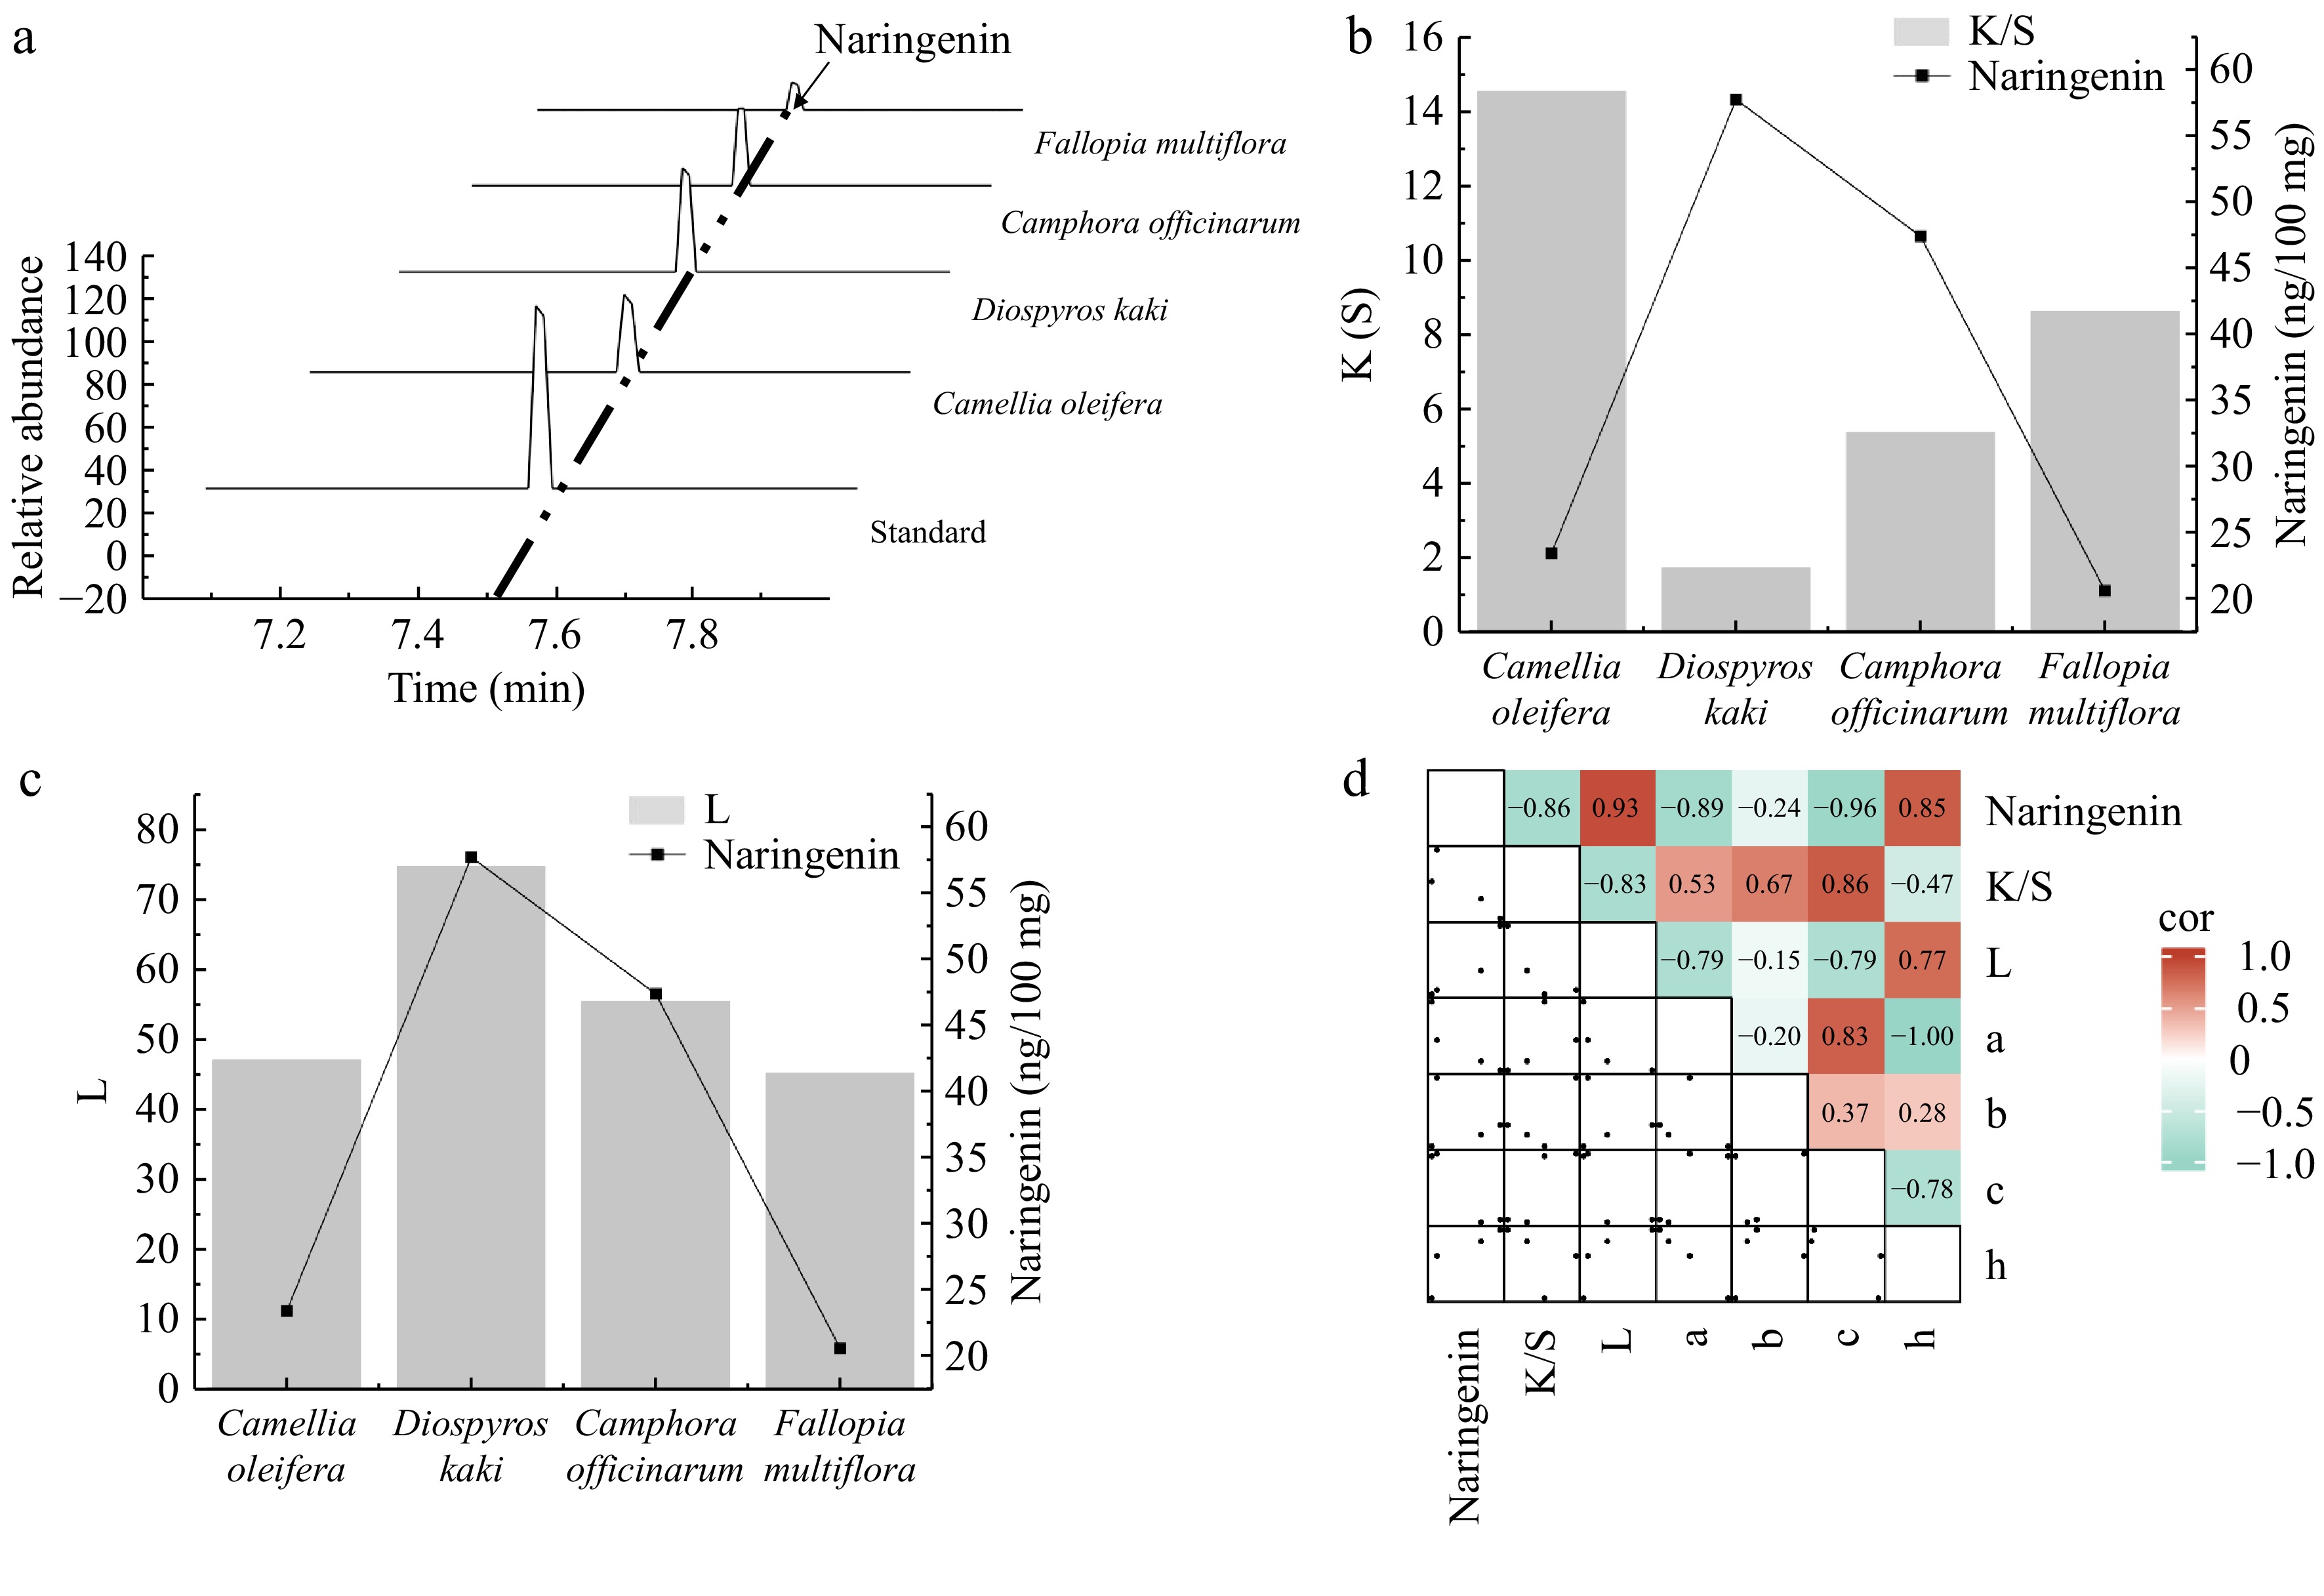
Figure 6.
Analysis of the relationship between the naringenin content and dyeing performance. (a) Identification of naringenin in plants using high-performance liquid chromatography (HPLC). (b) Bar graph showing the correlation between the naringenin content and the ratio of the dye absorption coefficient (k) to the dye scattering coefficient (s) (K/S) value. (c) Bar graph showing the correlation between the naringenin content and lightness (L) value. (d) Heatmap illustrating the correlation between naringenin and dyeing performance. a represents the red-green coordinate, b represents the yellow-blue coordinate, c represents color saturation, and h represents hue.
-
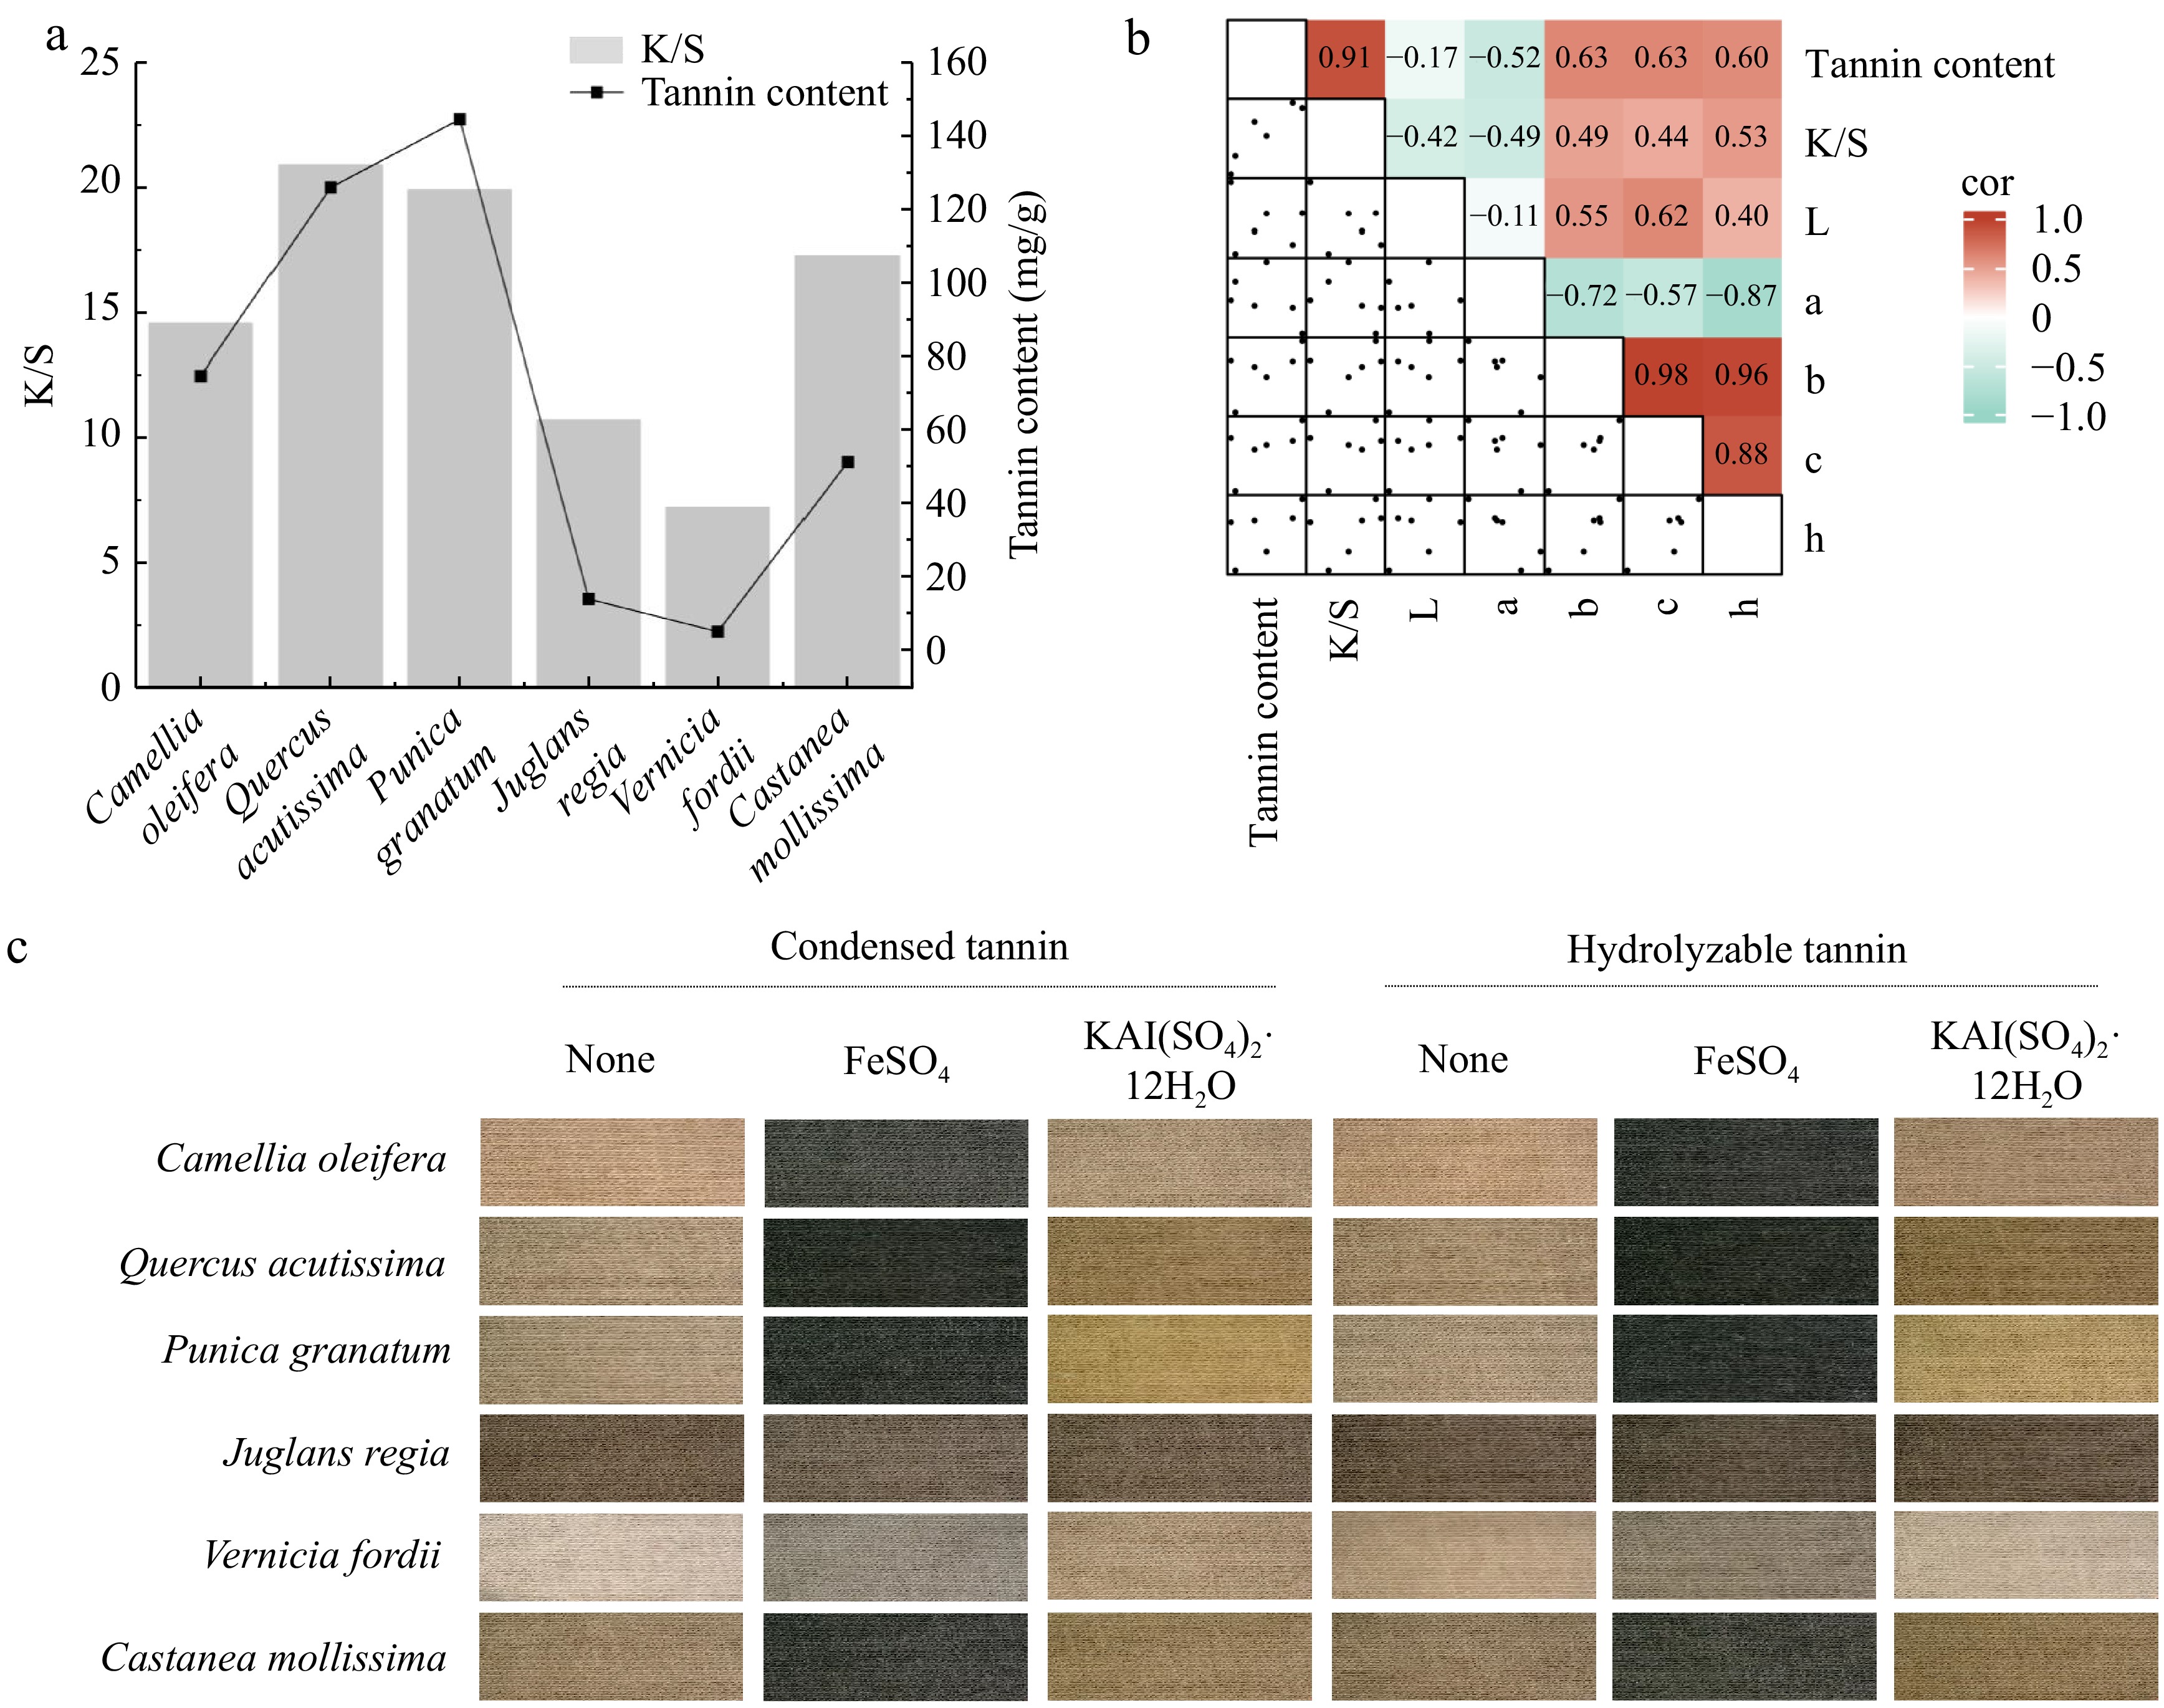
Figure 7.
Analysis of the relationship between tannin content and dyeing performance. (a) Bar graph showing the correlation between the tannin content in plant waste and the ratio of the dye absorption coefficient (k) to the dye scattering coefficient (s) (K/S) value. (b) Heatmap illustrating the correlation between the tannin content and dyeing performance. L represents lightness, a represents the red-green coordinate, b represents the yellow-blue coordinate, c represents color saturation, and h represents hue. (c) Tannin imparting diverse colors to cotton fabrics.
-
Plant Main ingredients Mordant Washing fastness Light fastness Camellia oleifera Condensed tannin None 4 4/5 FeSO4 4/5 4/5 KAl(SO4)2·12H2O 4/5 4/5 Hydrolysable tannin None 4 5 FeSO4 4 5 KAl(SO4)2·12H2O 5 5 Quercus acutissima Condensed tannin None 3 5 FeSO4 3 5 KAl(SO4)2·12H2O 4 5 Hydrolysable tannin None 3/4 5 FeSO4 3 5 KAl(SO4)2·12H2O 5 5 Punica granatum Condensed tannin None 4/5 5 FeSO4 5 5 KAl(SO4)2·12H2O 4 5 Hydrolysable tannin None 4 5 FeSO4 4 5 KAl(SO4)2·12H2O 4/5 5 Diospyros kaki Condensed tannin None 4/5 4 FeSO4 5 4 KAl(SO4)2·12H2O 5 4 Hydrolysable tannin None 5 4 FeSO4 5 4 KAl(SO4)2·12H2O 5 4 Galla Chinensis Condensed tannin None 4 4/5 FeSO4 5 4/5 KAl(SO4)2·12H2O 4/5 5 Hydrolysable tannin None 4 4/5 FeSO4 4 5 KAl(SO4)2·12H2O 4 4-5 Dioscorea cirrhosa Condensed tannin None 4 3 FeSO4 5 5 KAl(SO4)2·12H2O 4-5 4 Hydrolysable tannin None 4-5 3 FeSO4 4 4 KAl(SO4)2·12H2O 5 3 Camphora officinarum Condensed tannin None 4/5 4 FeSO4 4/5 4 KAl(SO4)2·12H2O 5 4 Hydrolysable tannin None 5 4 FeSO4 5 4 KAl(SO4)2·12H2O 5 4/5 Juglans regia Condensed tannin None 4/5 4/5 FeSO4 5 4 KAl(SO4)2·12H2O 4/5 4 Hydrolysable tannin None 4 5 FeSO4 5 4/5 KAl(SO4)2·12H2O 4/5 5 Fallopia multiflora Condensed tannin None 5 4 FeSO4 5 4 KAl(SO4)2·12H2O 4 4 Hydrolysable tannin None 5 3 FeSO4 4/5 4/5 KAl(SO4)2·12H2O 5 4 Vernicia fordii Condensed tannin None 5 4/5 FeSO4 4/5 4 KAl(SO4)2·12H2O 5 4 Hydrolysable tannin None 4 4 FeSO4 4/5 4 KAl(SO4)2·12H2O 4/5 4 Castanea mollissima Condensed tannin None 4 4/5 FeSO4 5 4/5 KAl(SO4)2·12H2O 4 5 Hydrolysable tannin None 4 4 FeSO4 4 4/5 KAl(SO4)2·12H2O 5 4/5 Table 1.
Fastness properties of dyed samples.
Figures
(7)
Tables
(1)