-

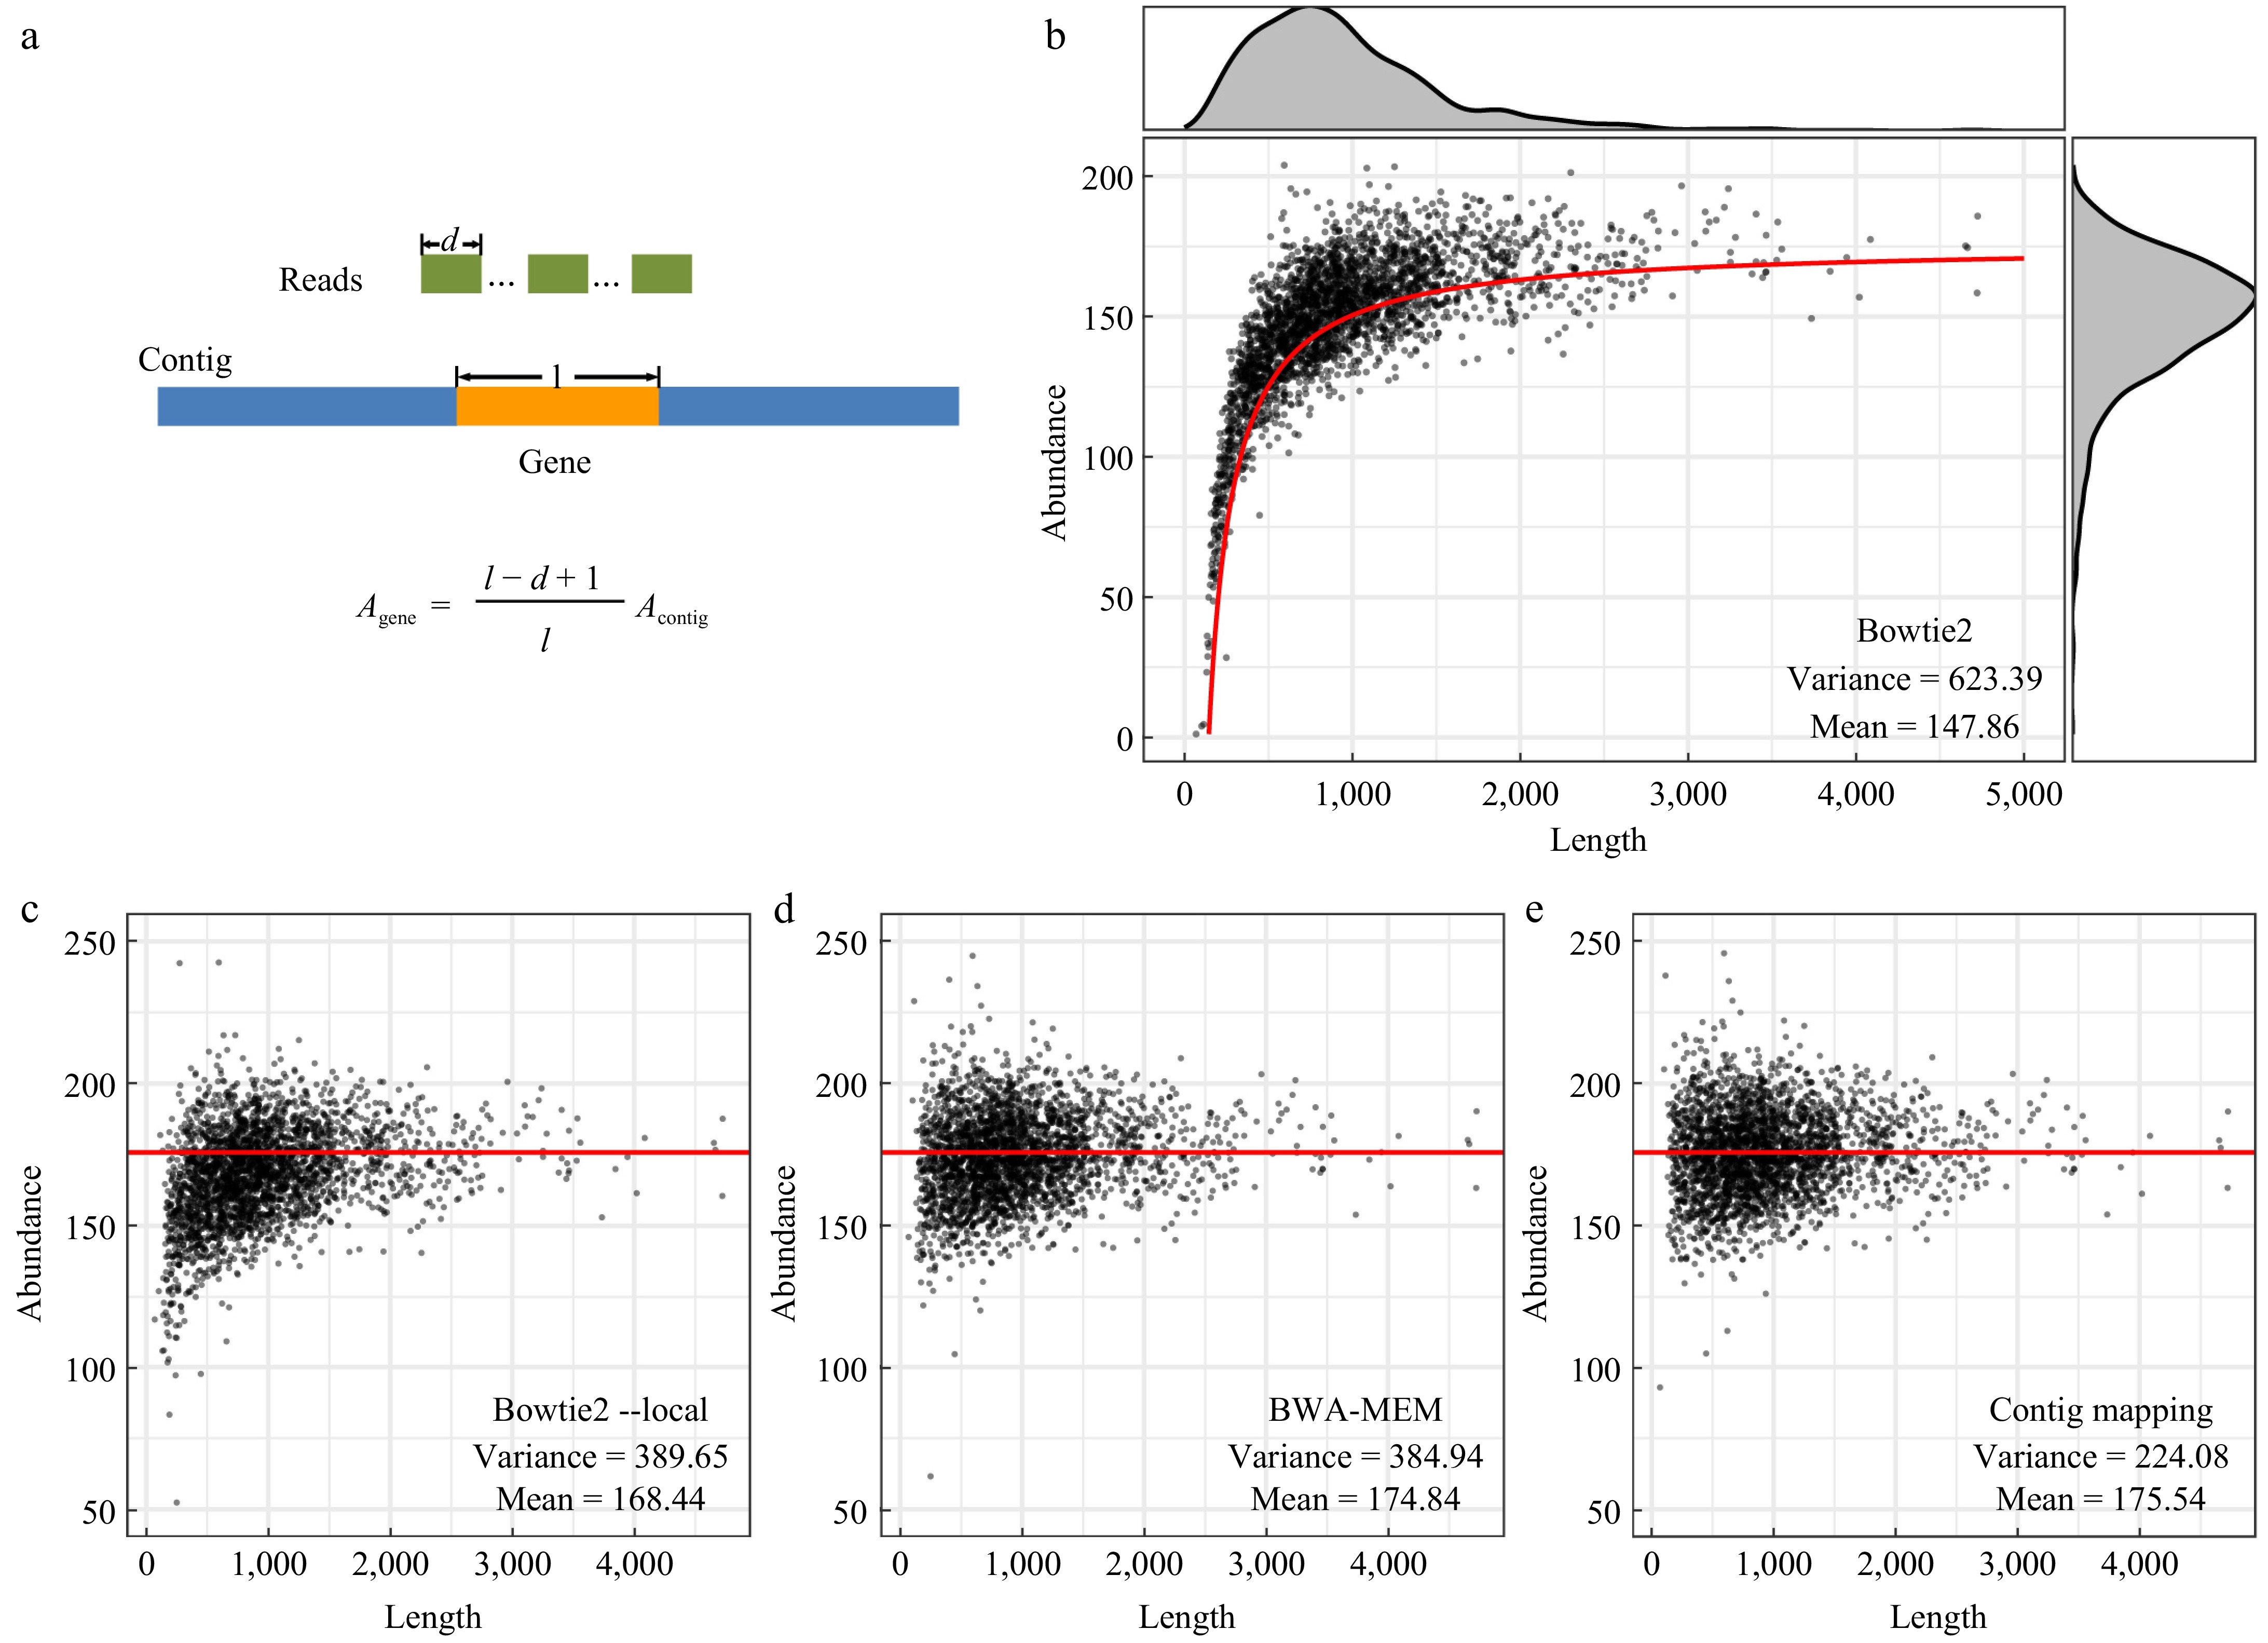
Figure 1.
Gene abundance values calculated using the alignment-based algorithms. (a) Schematic diagram showing the generation of local alignments in read mapping of genes and the equation relating the abundance of genes and that of the chromosome. (b) Gene abundance values calculated using Bowtie 2 with default parameters. The red line indicates the abundance value of genes calculated based on the equation shown in (a). (c) Abundance values calculated using Bowtie 2 with the parameter '--local'. (d) Abundance values calculated using BWA-MEM with default parameters. (e) Gene abundance values calculated based on gene position and the coverage depth of the chromosome sequence. The red lines in (c)−(e) indicate the abundance value of the chromosome calculated using Bowtie 2 with default parameters.
-

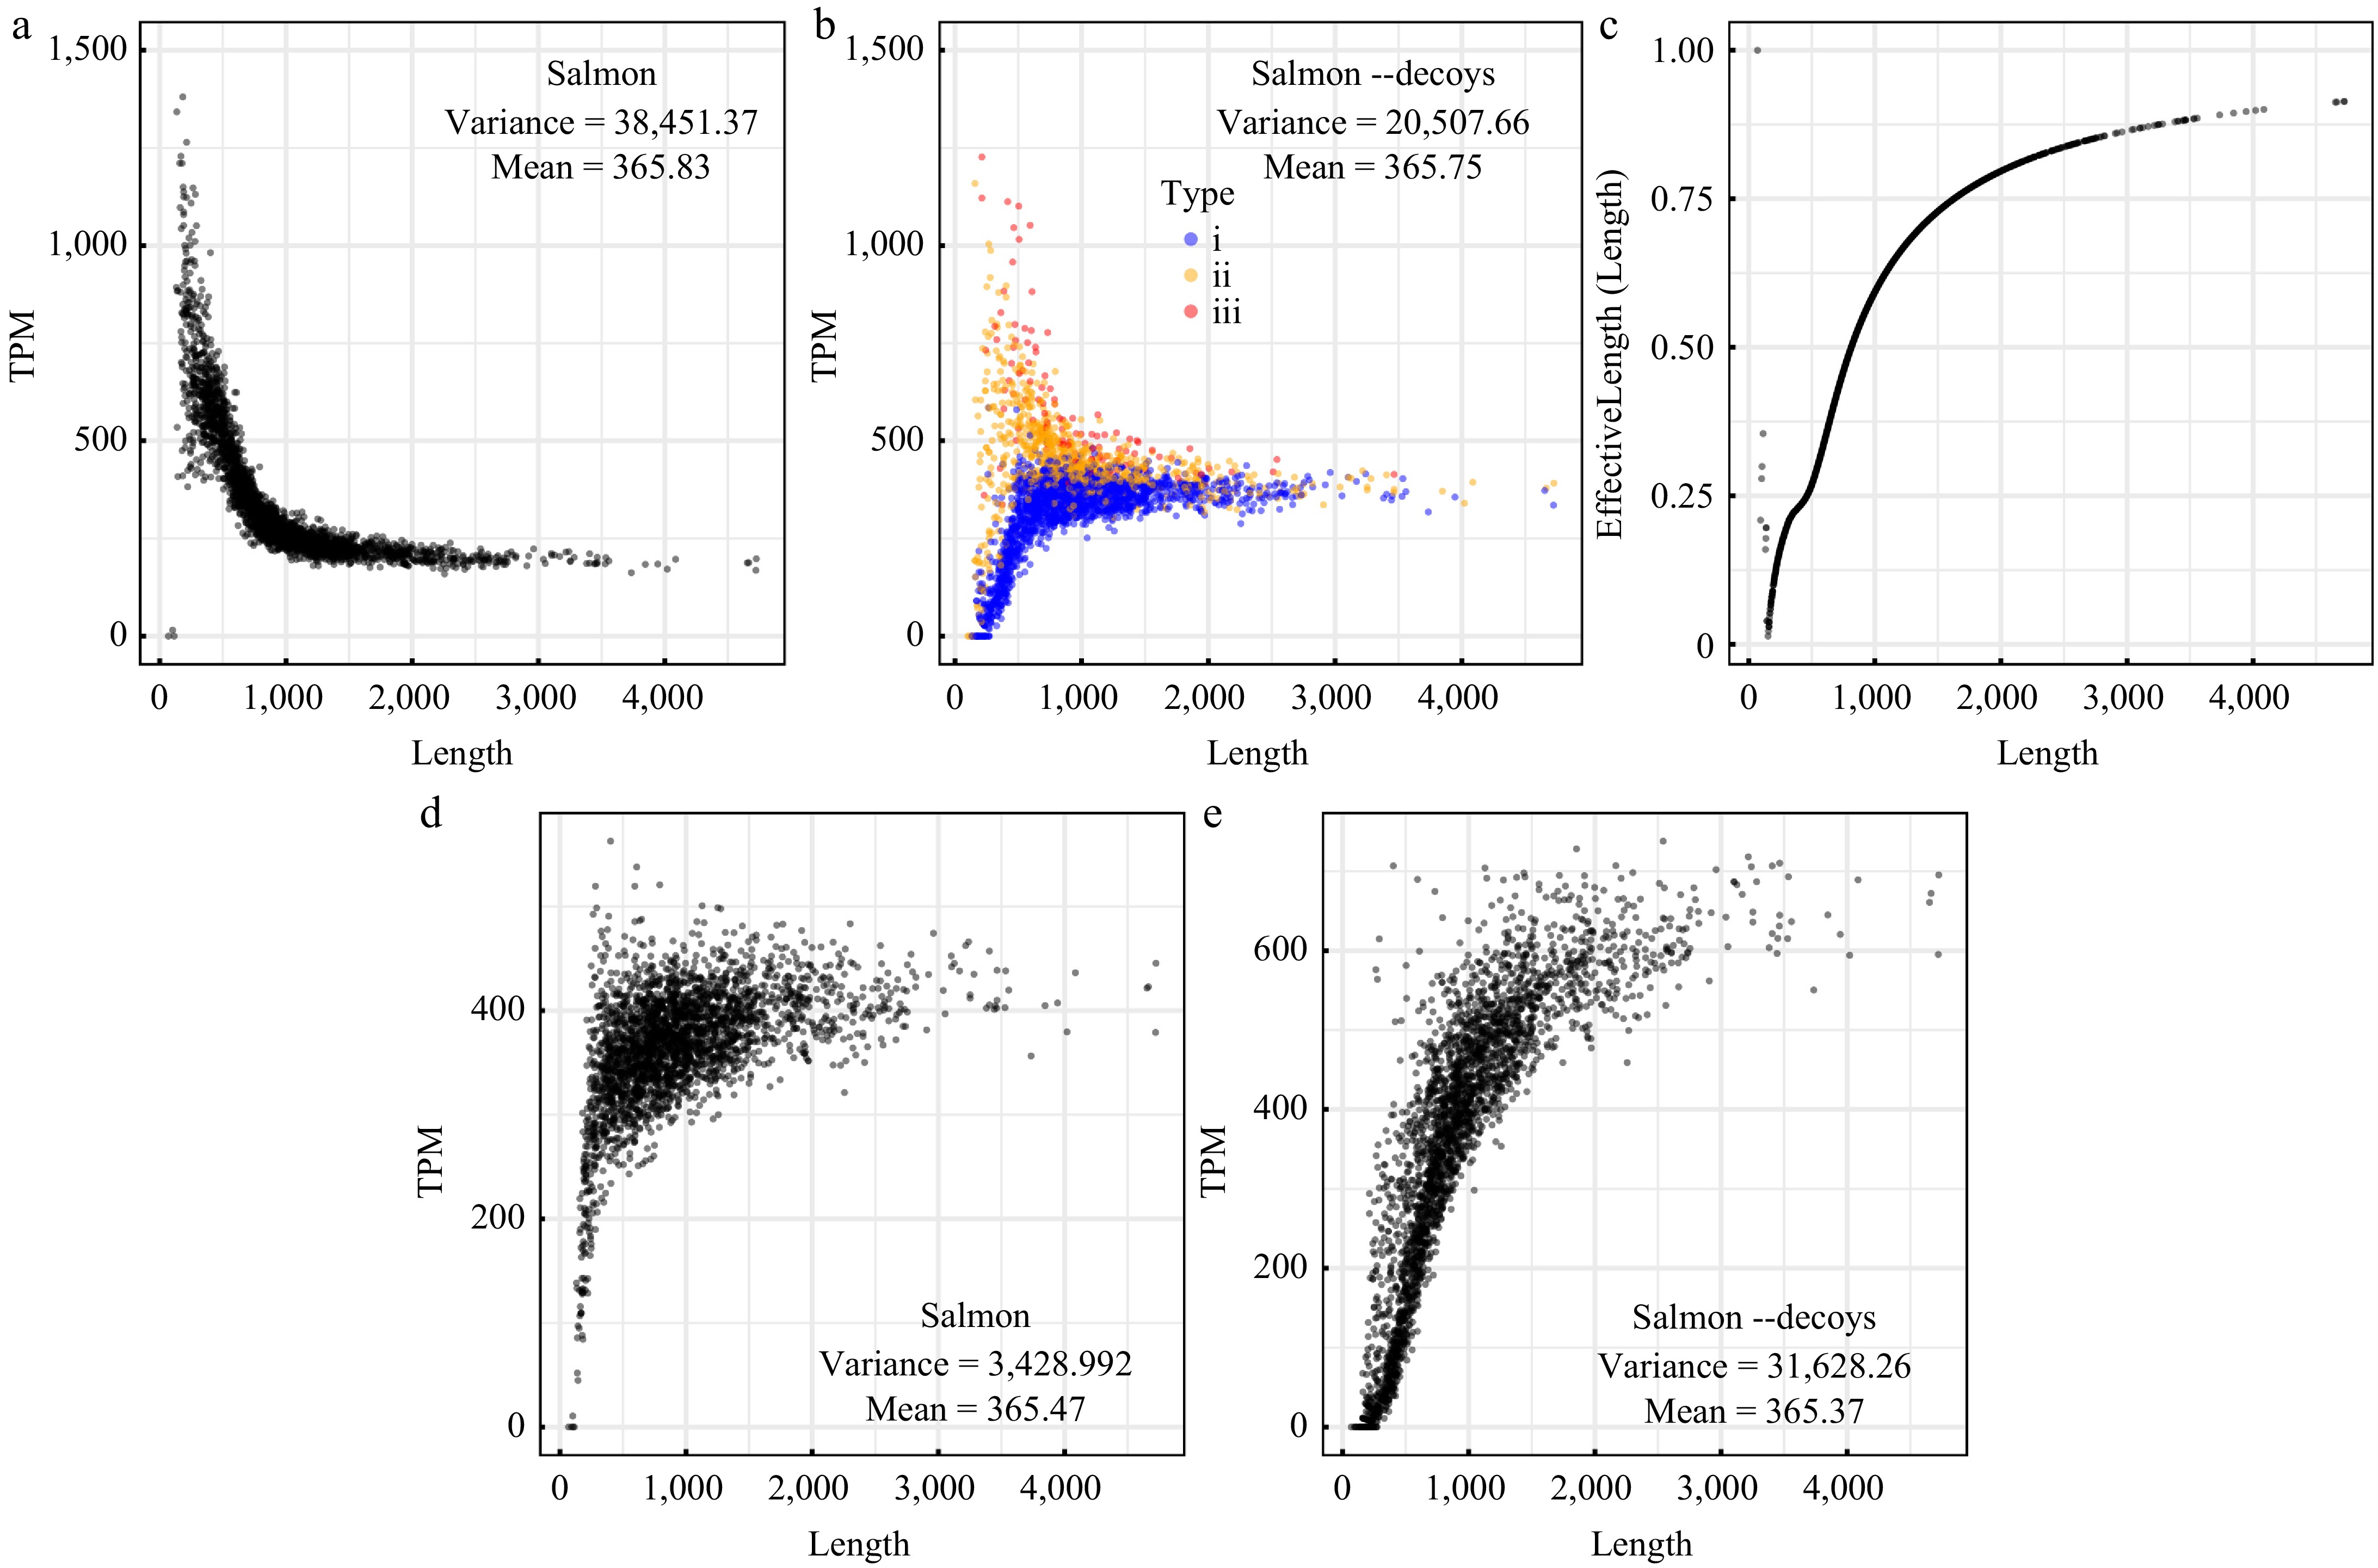
Figure 2.
Gene abundance values calculated using the alignment-free algorithms. (a) Values of the TPM (transcripts per million) measure calculated using Salmon with the parameters '--meta --validateMappings'. (b) Values of the TPM measure calculated using Salmon with the chromosome as a decoy sequence. Dots with different colors correspond to three types of genes: (i) genes with upstream and downstream noncoding regions less than 145 bp, (ii) genes with upstream or downstream noncoding regions less than 145 bp, and (iii) genes with upstream and downstream noncoding regions more than 145 bp. (c) Variation in the EffectiveLength/Length ratio as a function of gene length. (d) Values of TPM calculated using the numbers of mapped reads generated by Salmon and real gene lengths. (e) Values of TPM calculated using the numbers of mapped reads generated by Salmon with the chromosome as a decoy sequence and real gene lengths.
-

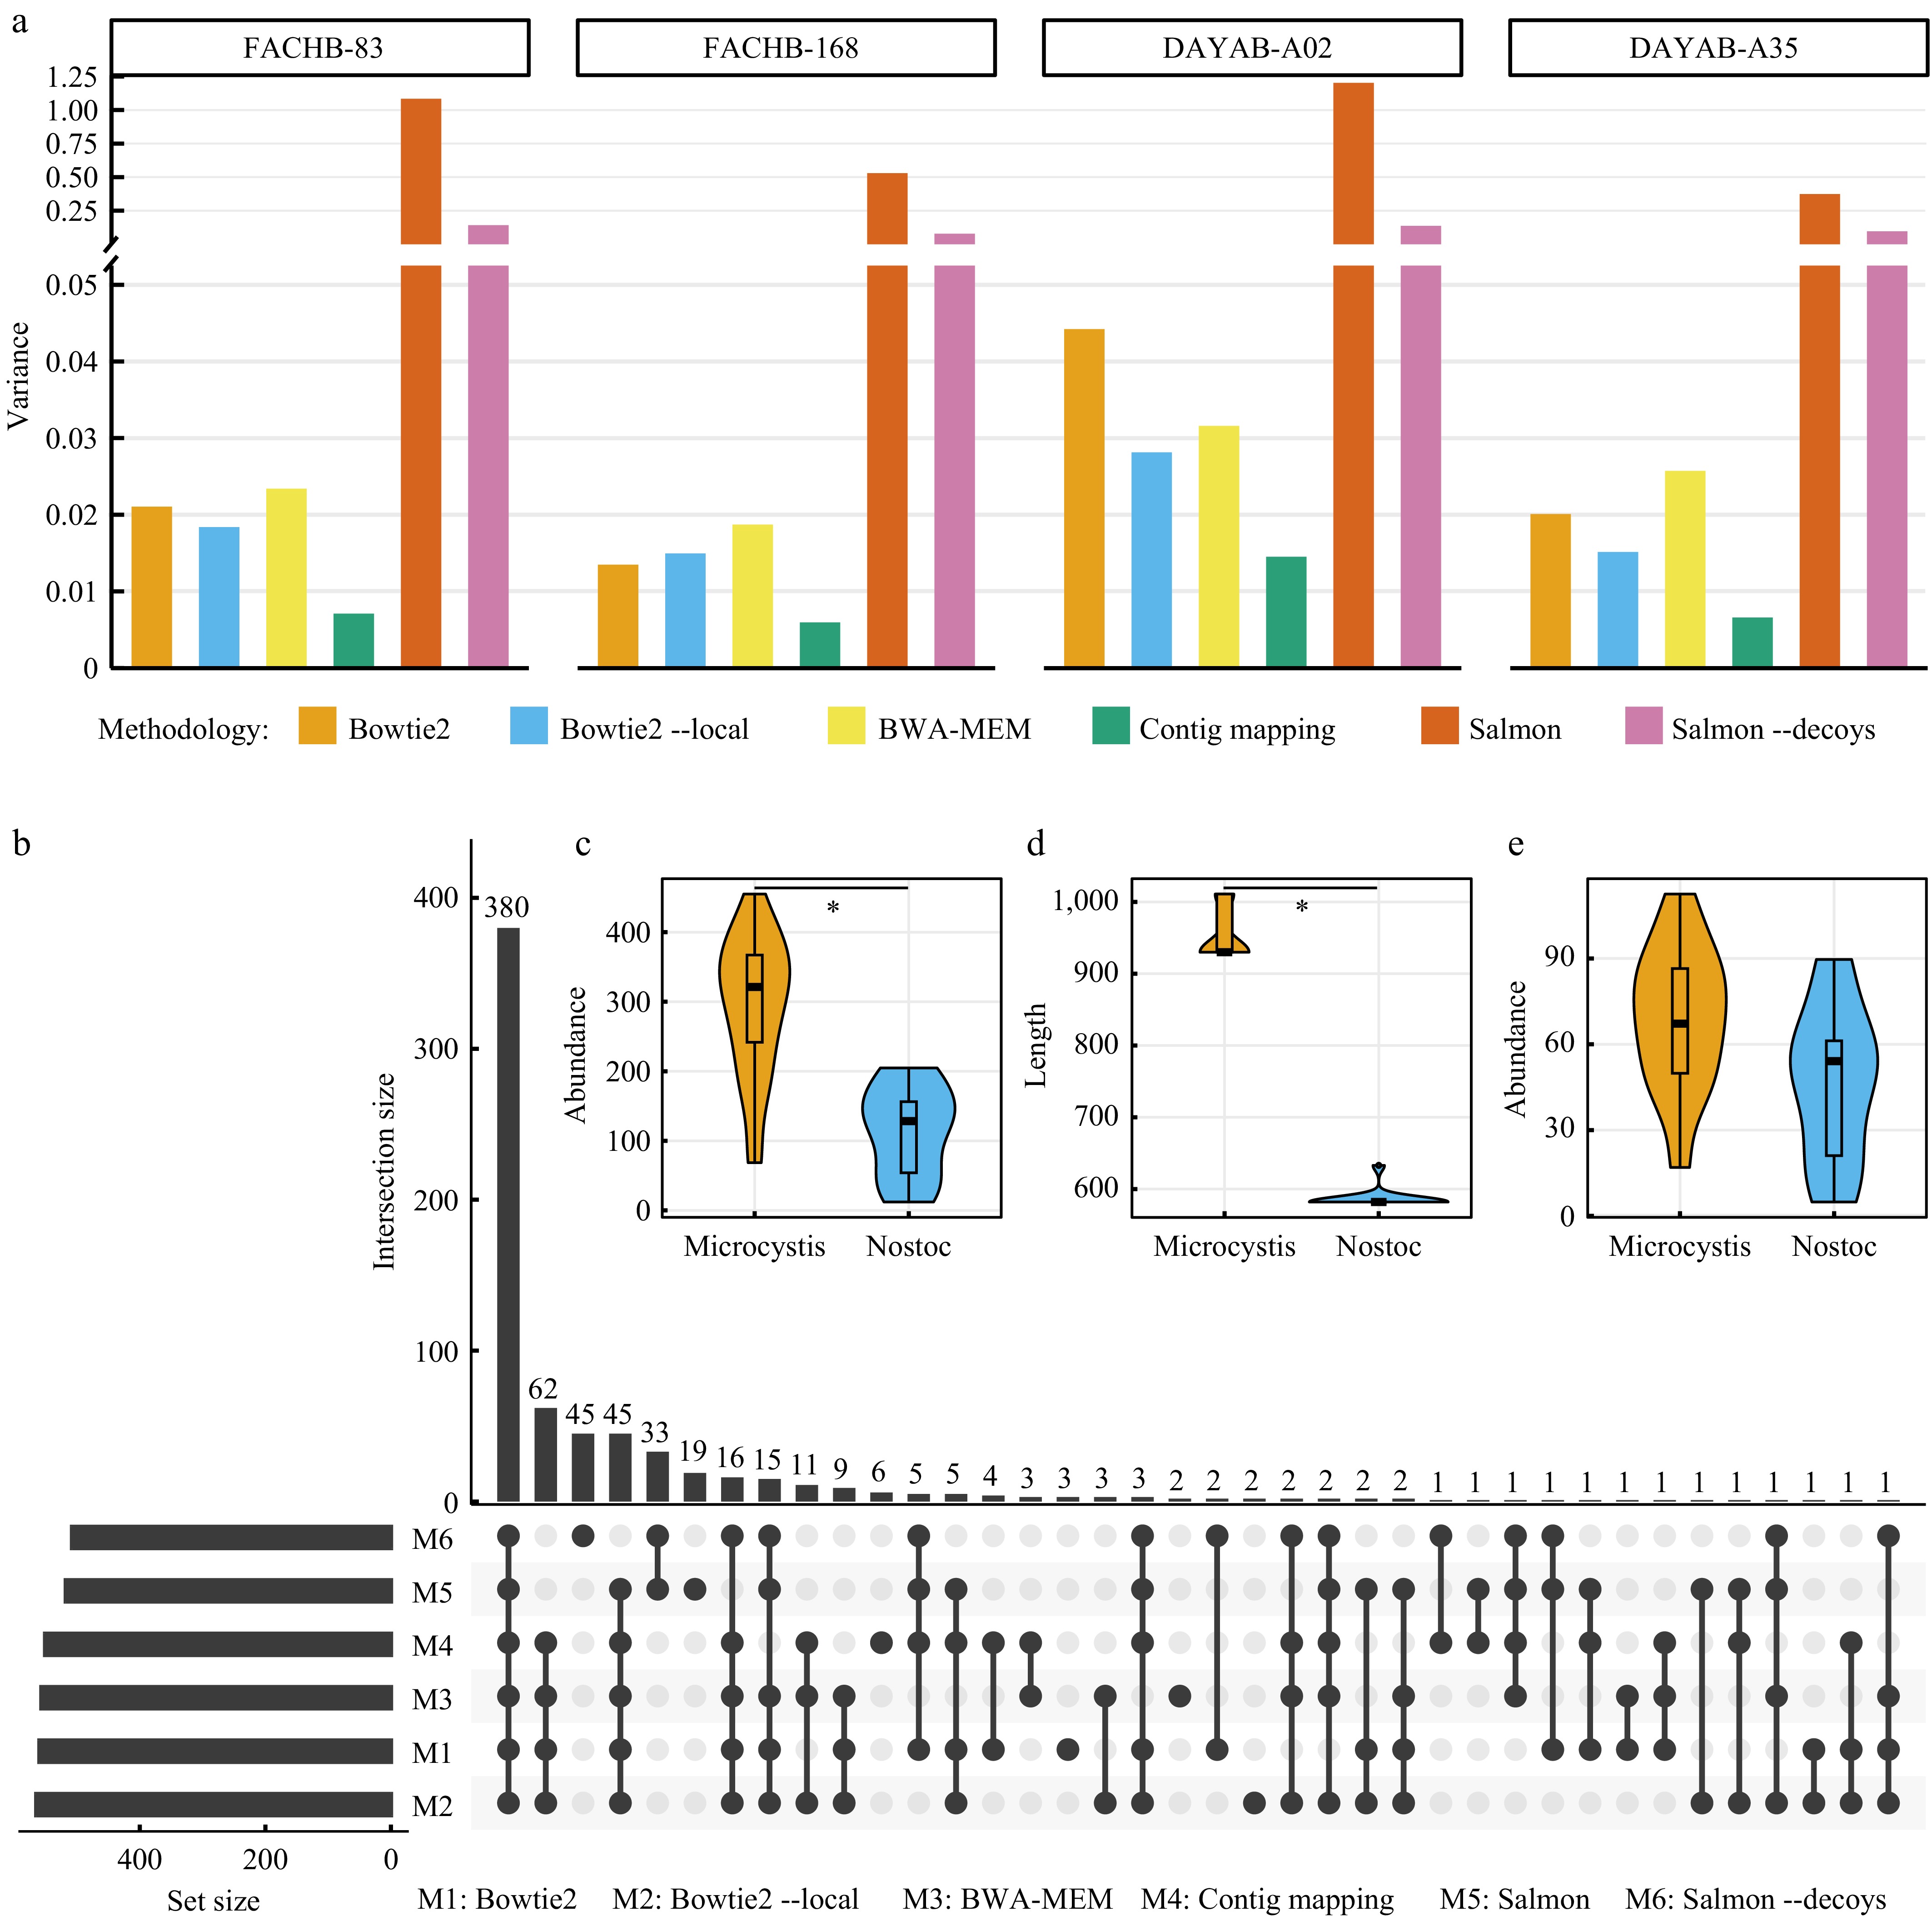
Figure 3.
Length-dependent gene abundances pervasively influence the quantification of microbial function. (a) Variances of calculated abundance values of genes from four different datasets for each mapping methodology. To facilitate the comparison, the original gene abundance values of each dataset are normalized by dividing by the average abundance of respective long (> 3,000 bp) genes. (b) Identification of KEGG Orthologs (KOs) with significant differences (adjusted p-value < 0.05) in abundance between two different cyanobacterial cultures (Microcystis sp. and Nostoc sp.) using six mapping methodologies. In this plot, the combination matrix at the bottom shows the intersections of six sets of identified KOs and the bars at the left and top shows the sizes of sets and intersections, respectively. (c) Comparison of the abundance values of K08480 in two different cyanobacterial cultures using the 'contig mapping' method proposed in this study. (d) Comparison of the lengths of genes annotated to K08480 in two different cyanobacterial cultures. (e) Comparison of the abundance values of K08480 in two cyanobacterial cultures using Salmon. * in (c) and (d) indicate adjusted p-value < 0.05.
Figures
(3)
Tables
(0)