-
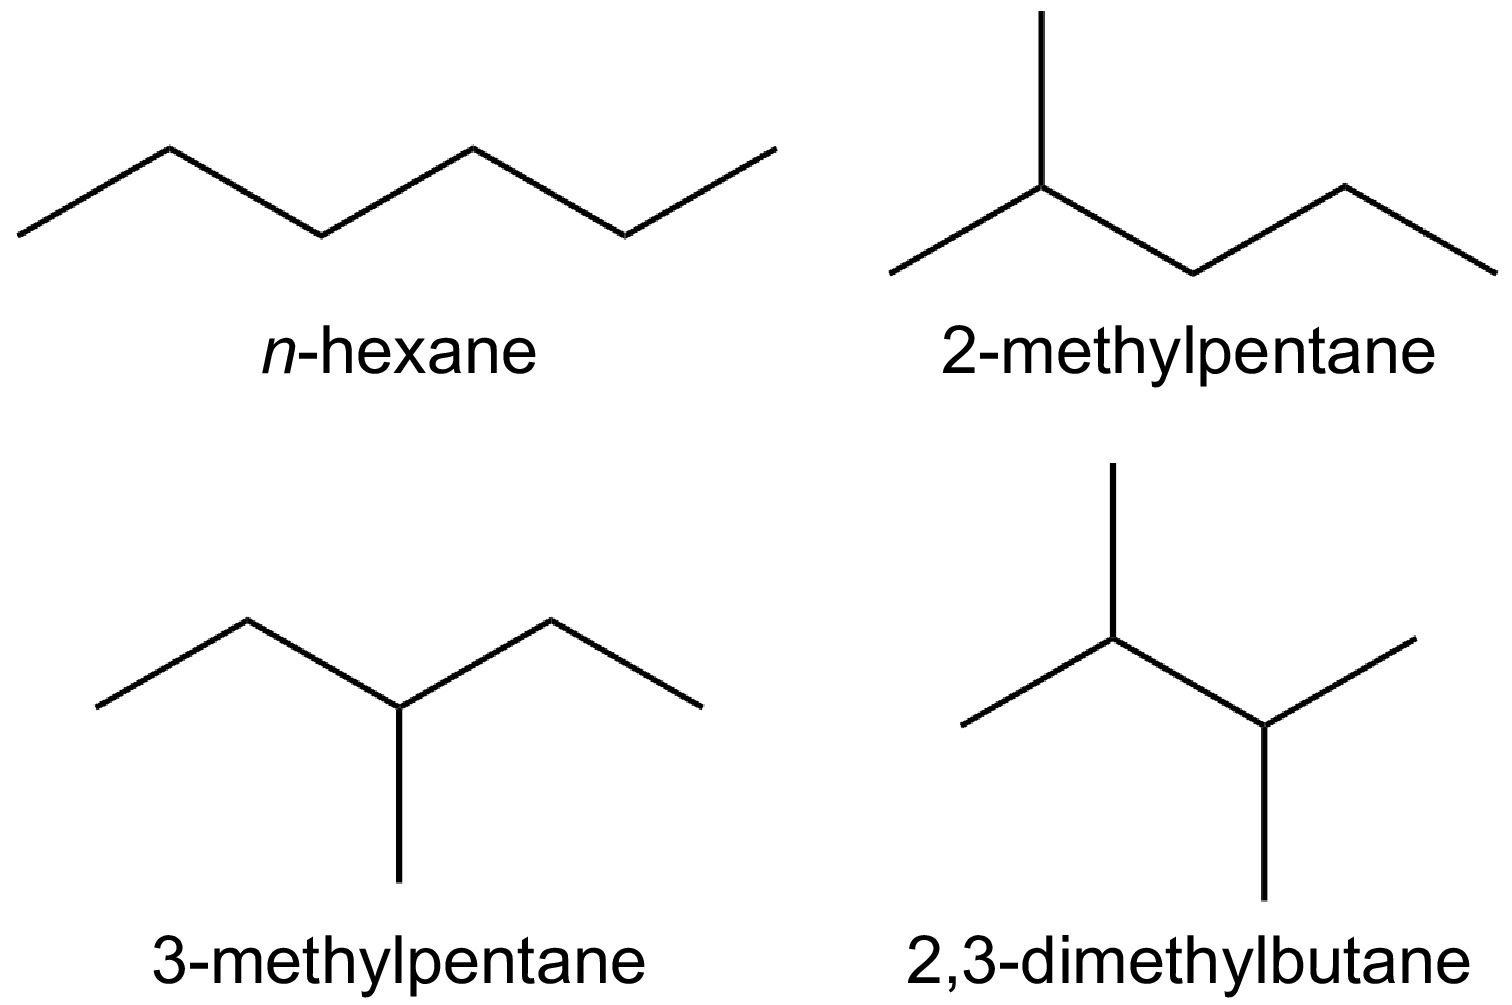
Figure 1.
Molecular structures of the four hexane isomers.
-
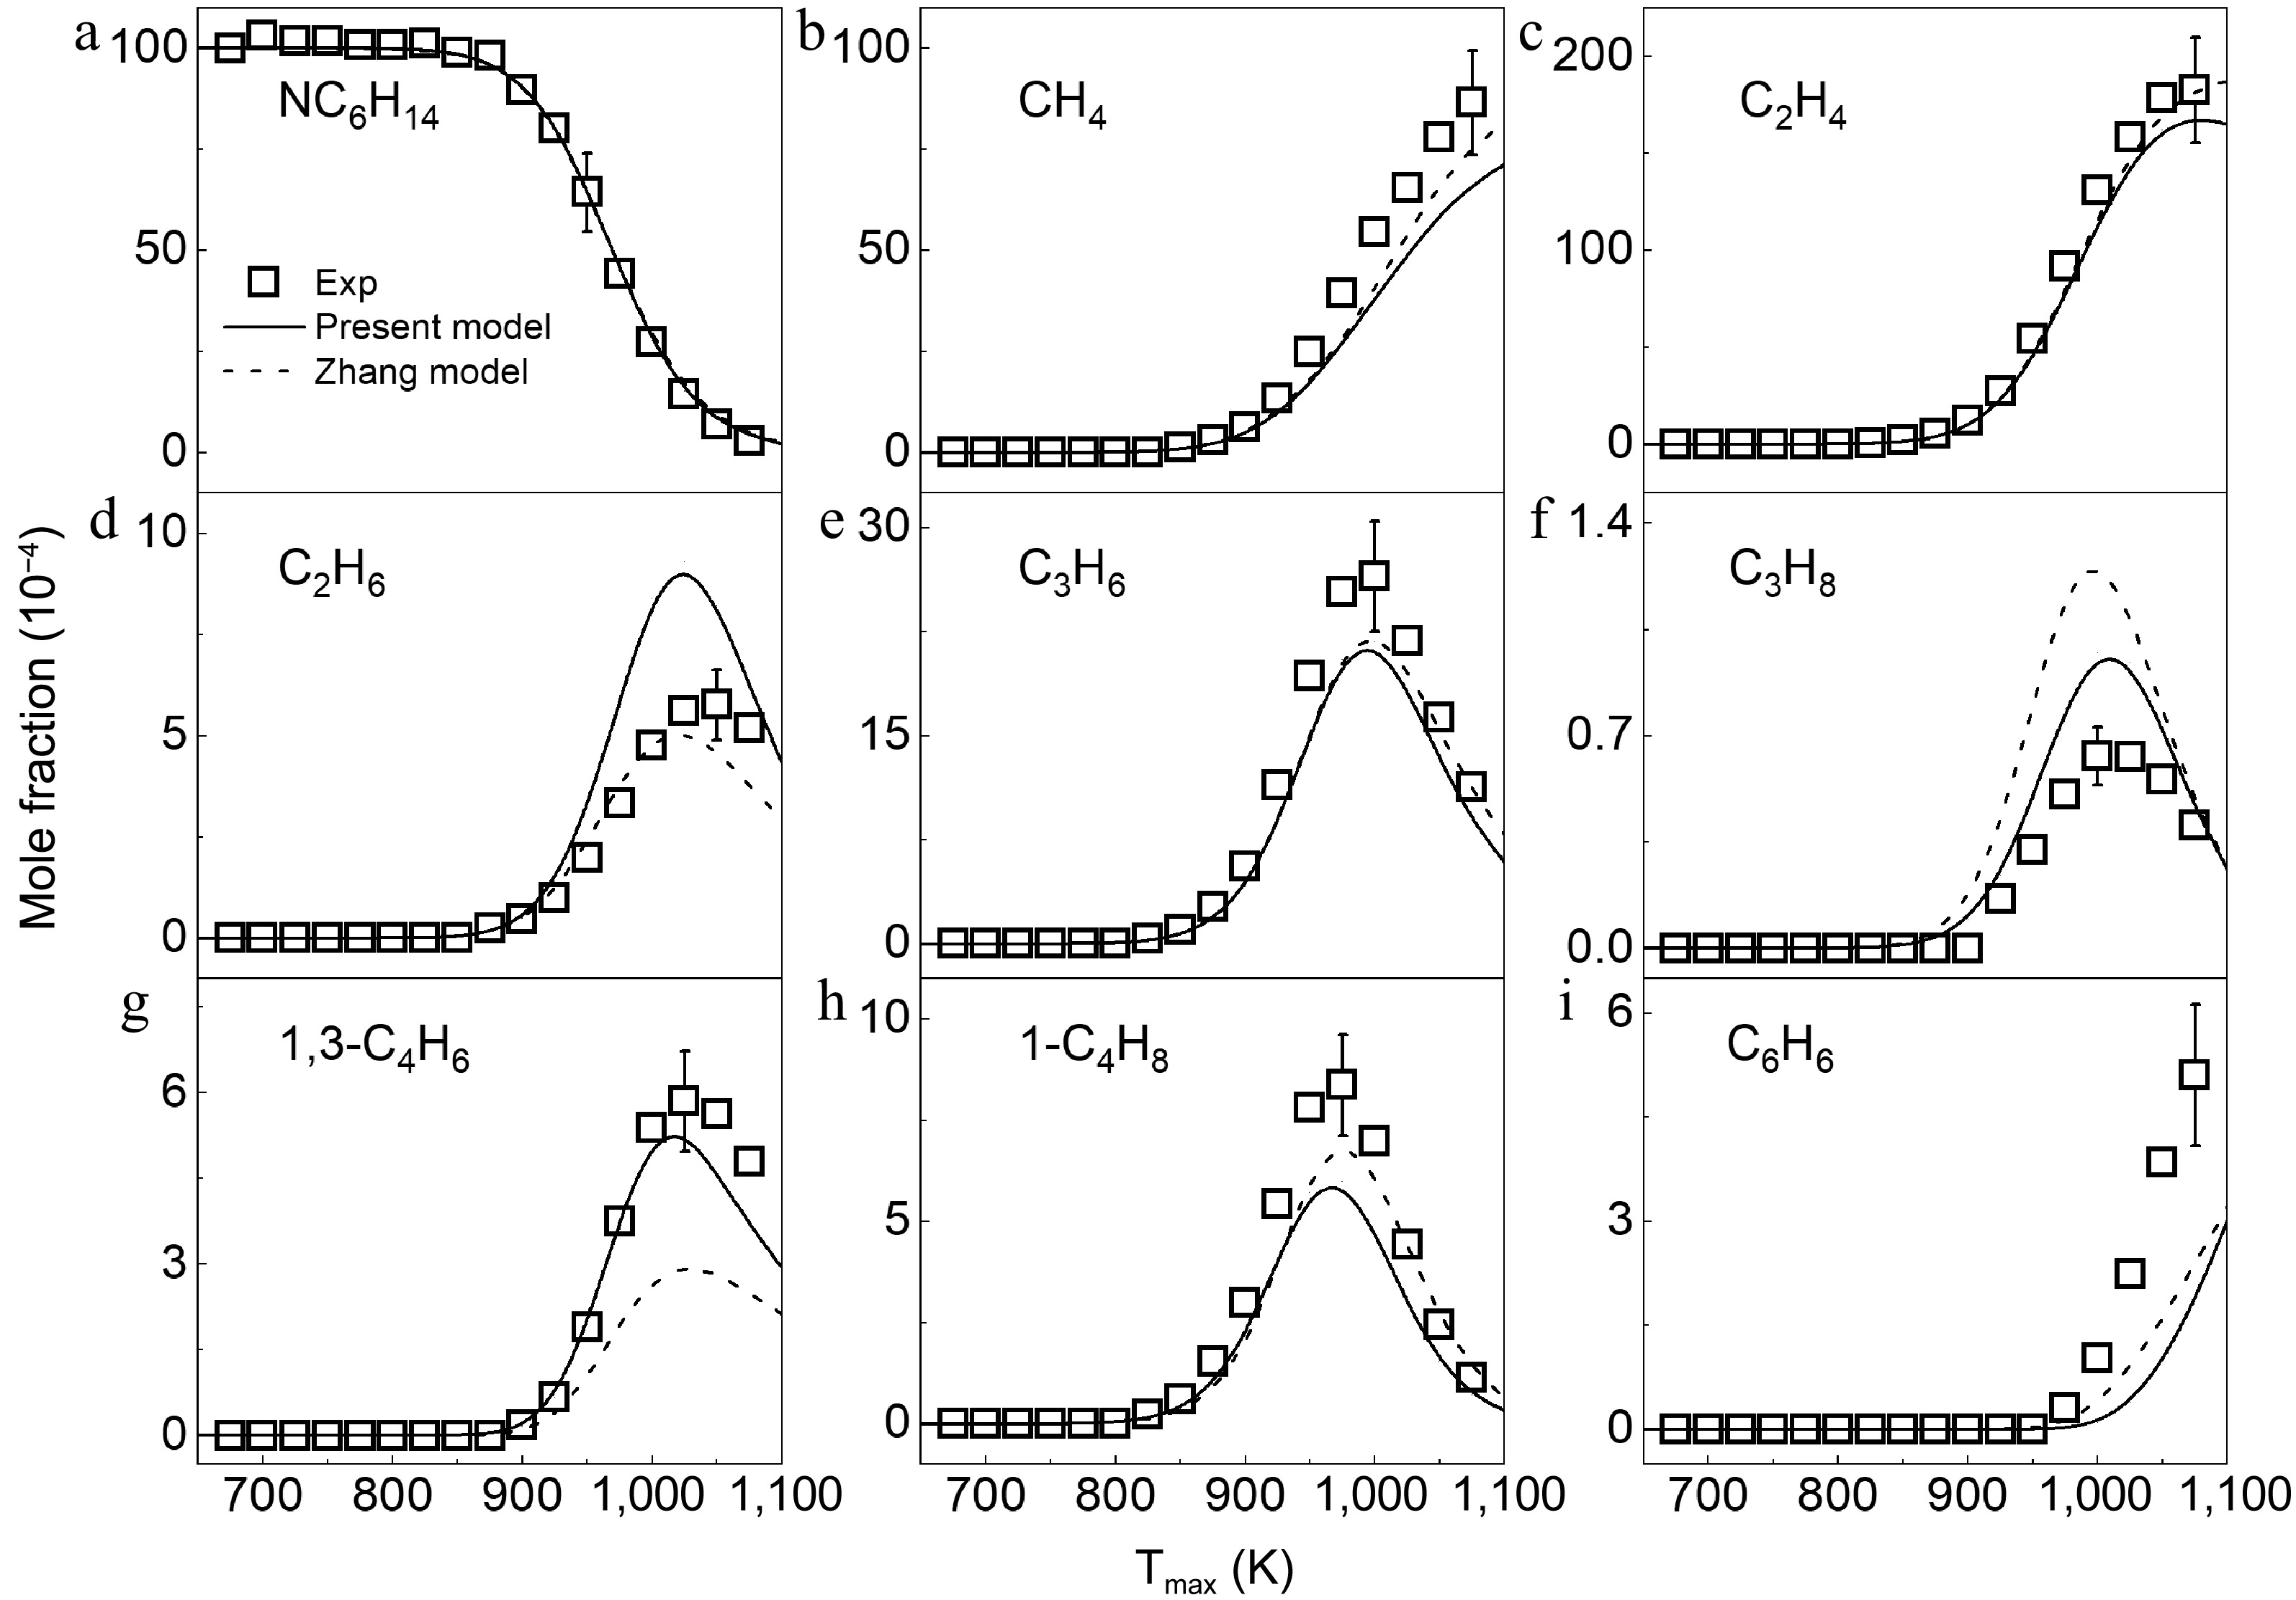
Figure 2.
Mole fraction distributions of n-hexane and products in n-hexane pyrolysis at 1 atm. Symbols and lines denote the measured and simulated results, respectively.
-

Figure 3.
Mole fraction distributions of 2-methylpentane and products in 2-methylpentane pyrolysis at 1 atm. Symbols and lines denote the measured and simulated results, respectively.
-
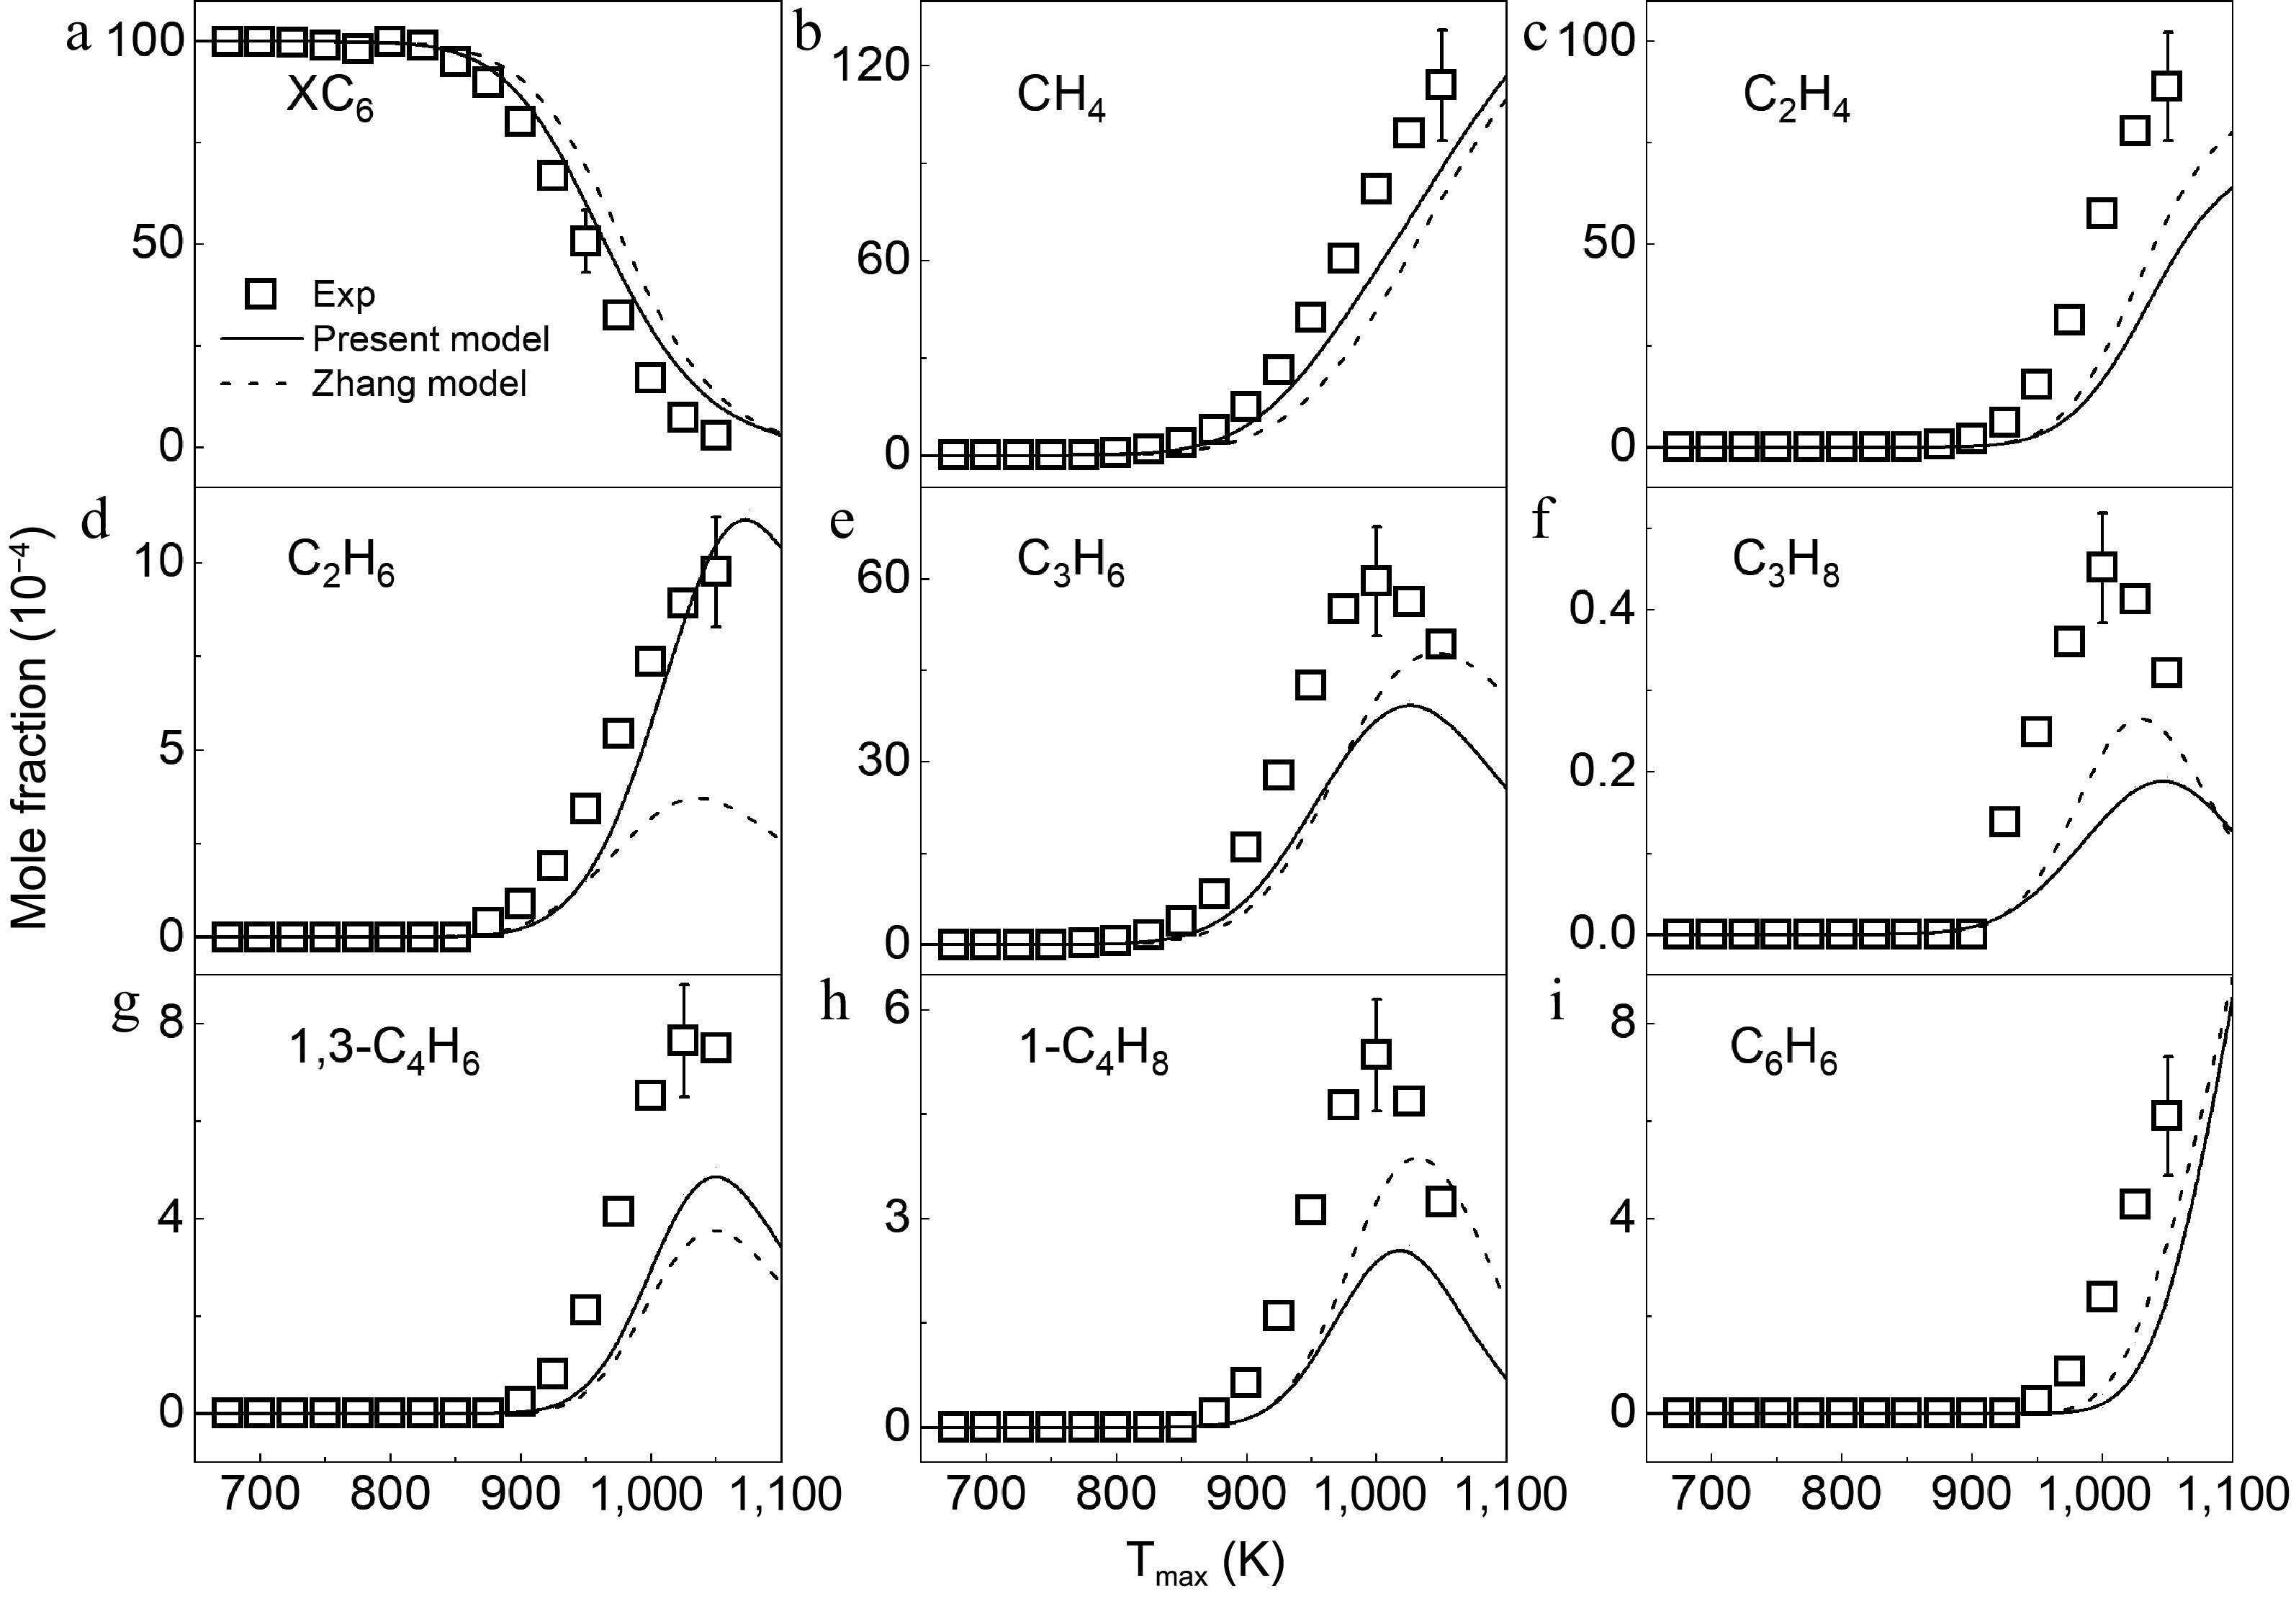
Figure 4.
Mole fraction distributions of 3-methylpentane and products in 3-methylpentane pyrolysis at 1 atm. Symbols and lines denote the measured and simulated results, respectively.
-
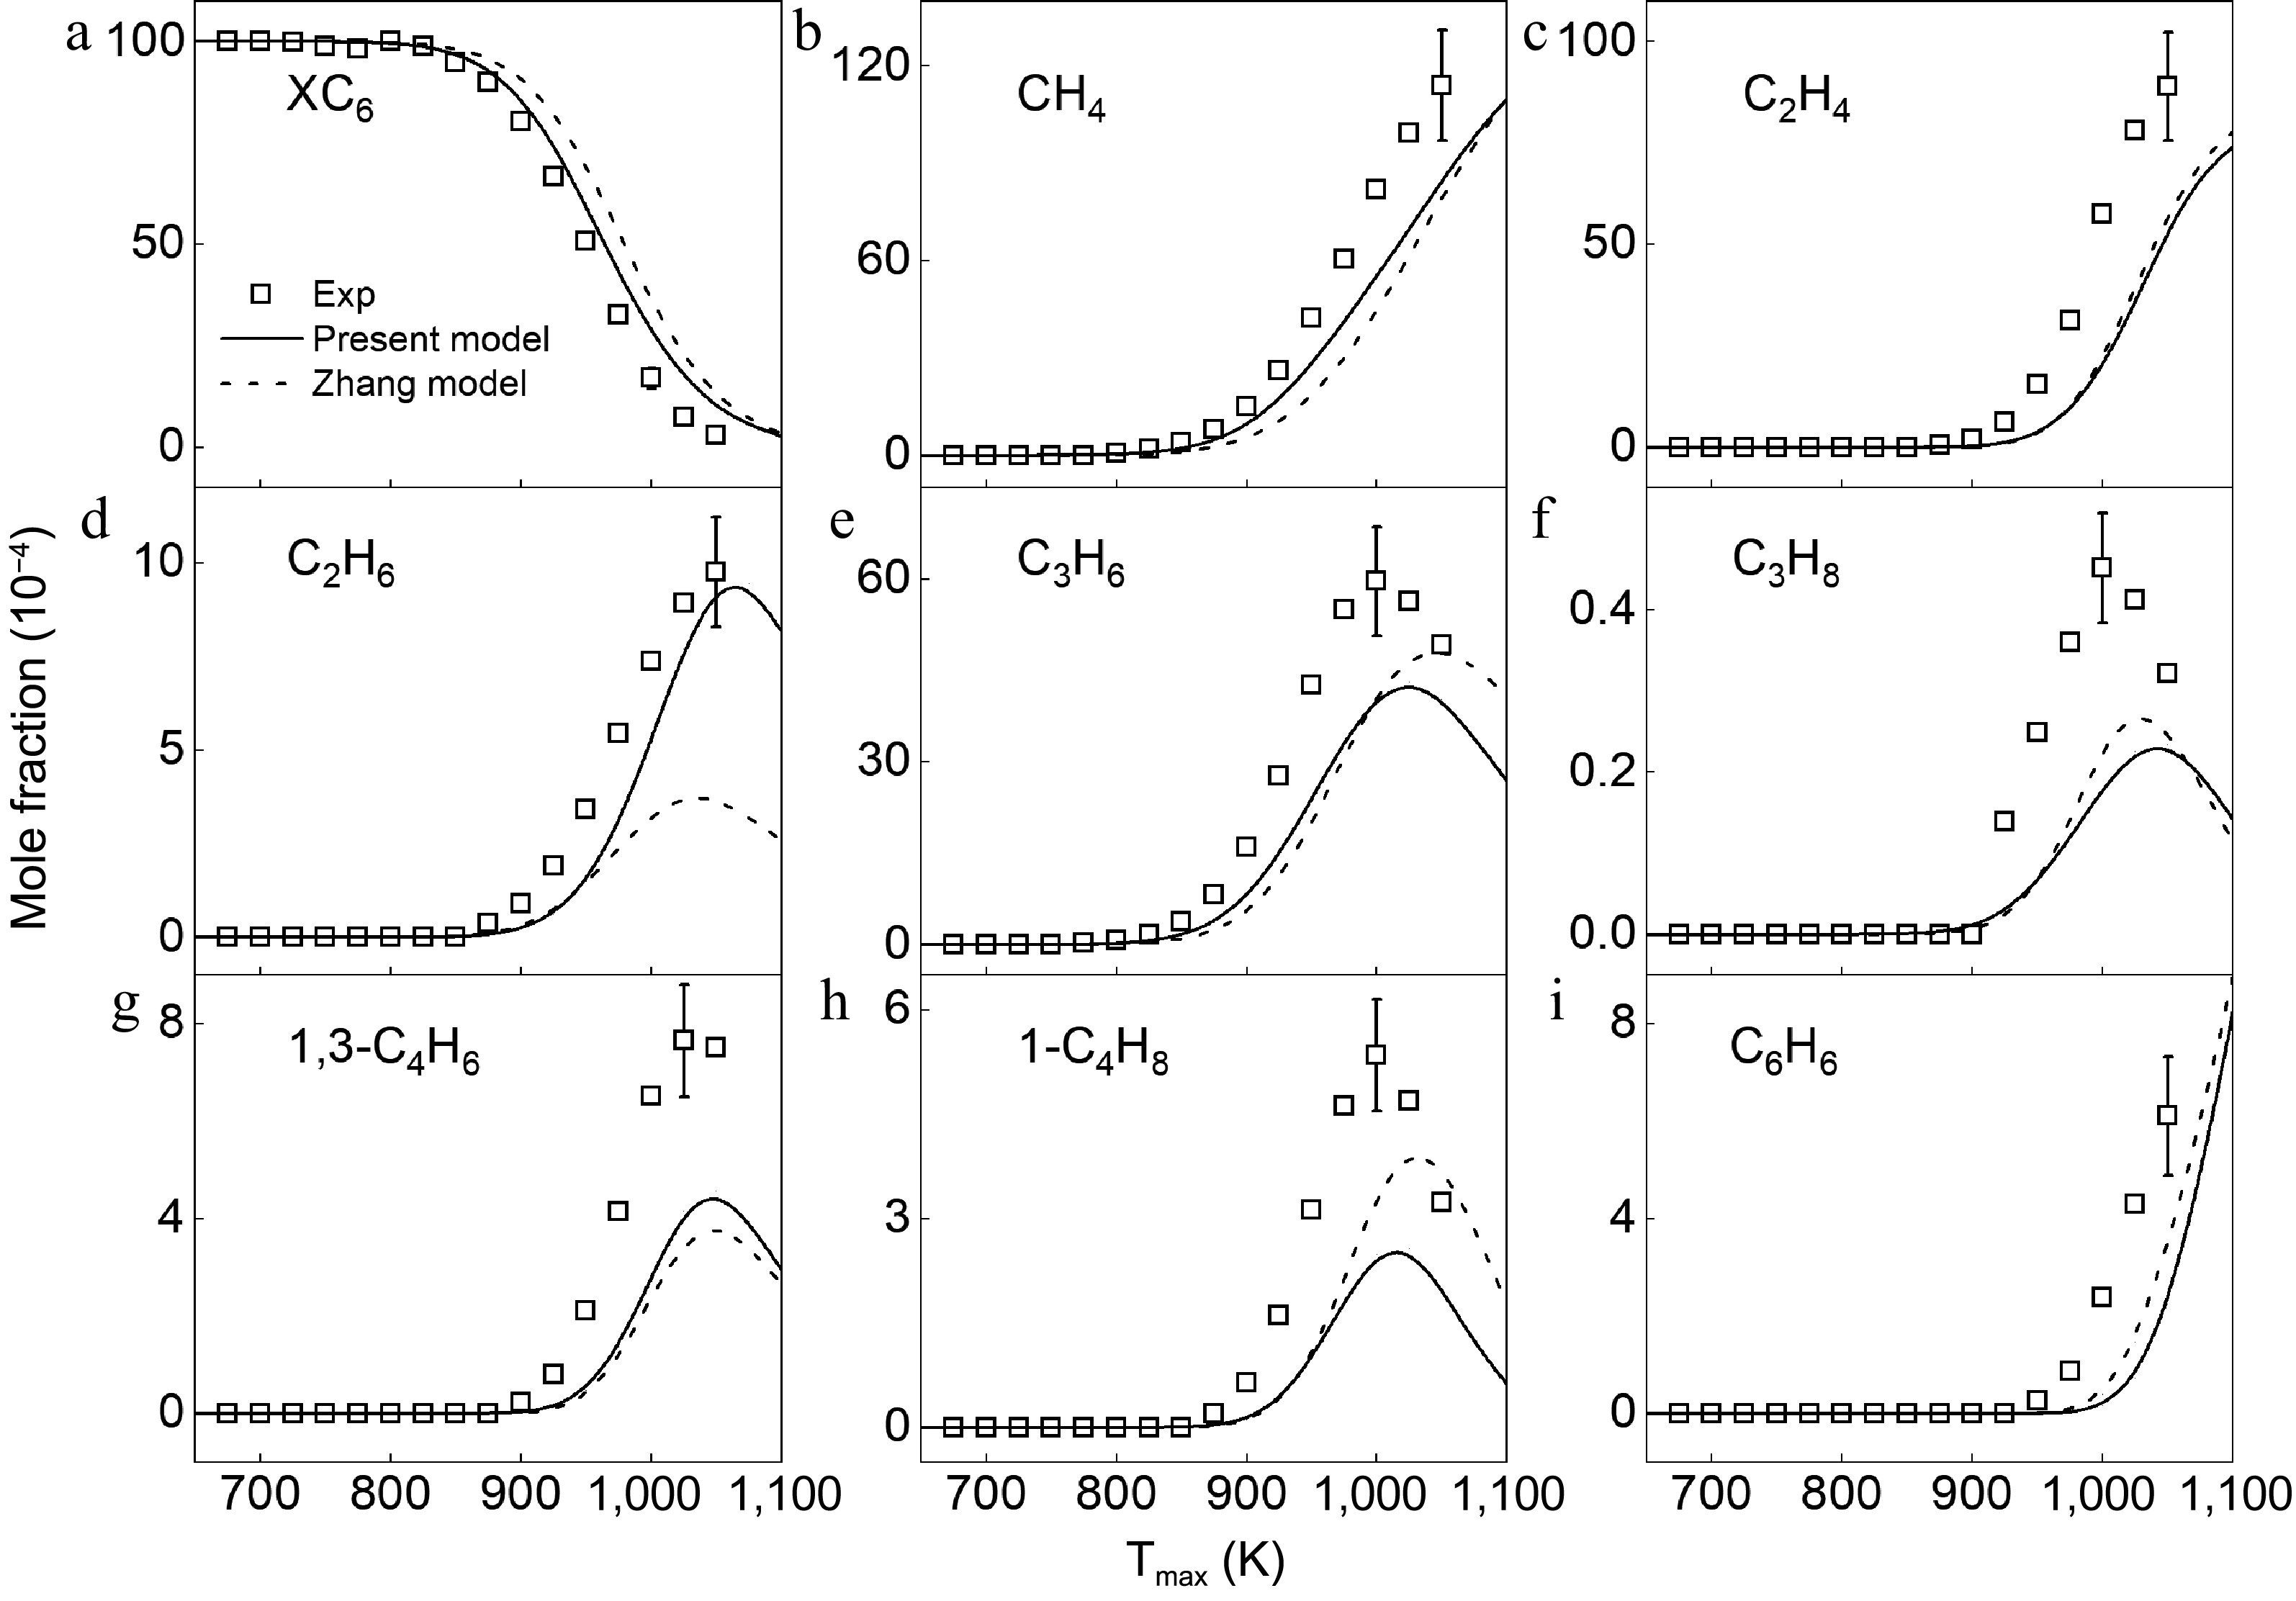
Figure 5.
Mole fraction distributions of 2,3-dimethylbutane and products in 2,3-dimethylbutane pyrolysis at 1 atm. Symbols and lines denote the measured and simulated results, respectively.
-

Figure 6.
The primary reaction networks of (a) n-hexane at 1,025 K, (b) 2-methylpentane at 1,025 K, (c) 3-methylpentane at 1,000 K, and (d) 2,3-dimethylbutane at 1,000 K. The numbers represent the percentages of carbon fluxes for the corresponding reactions.
-
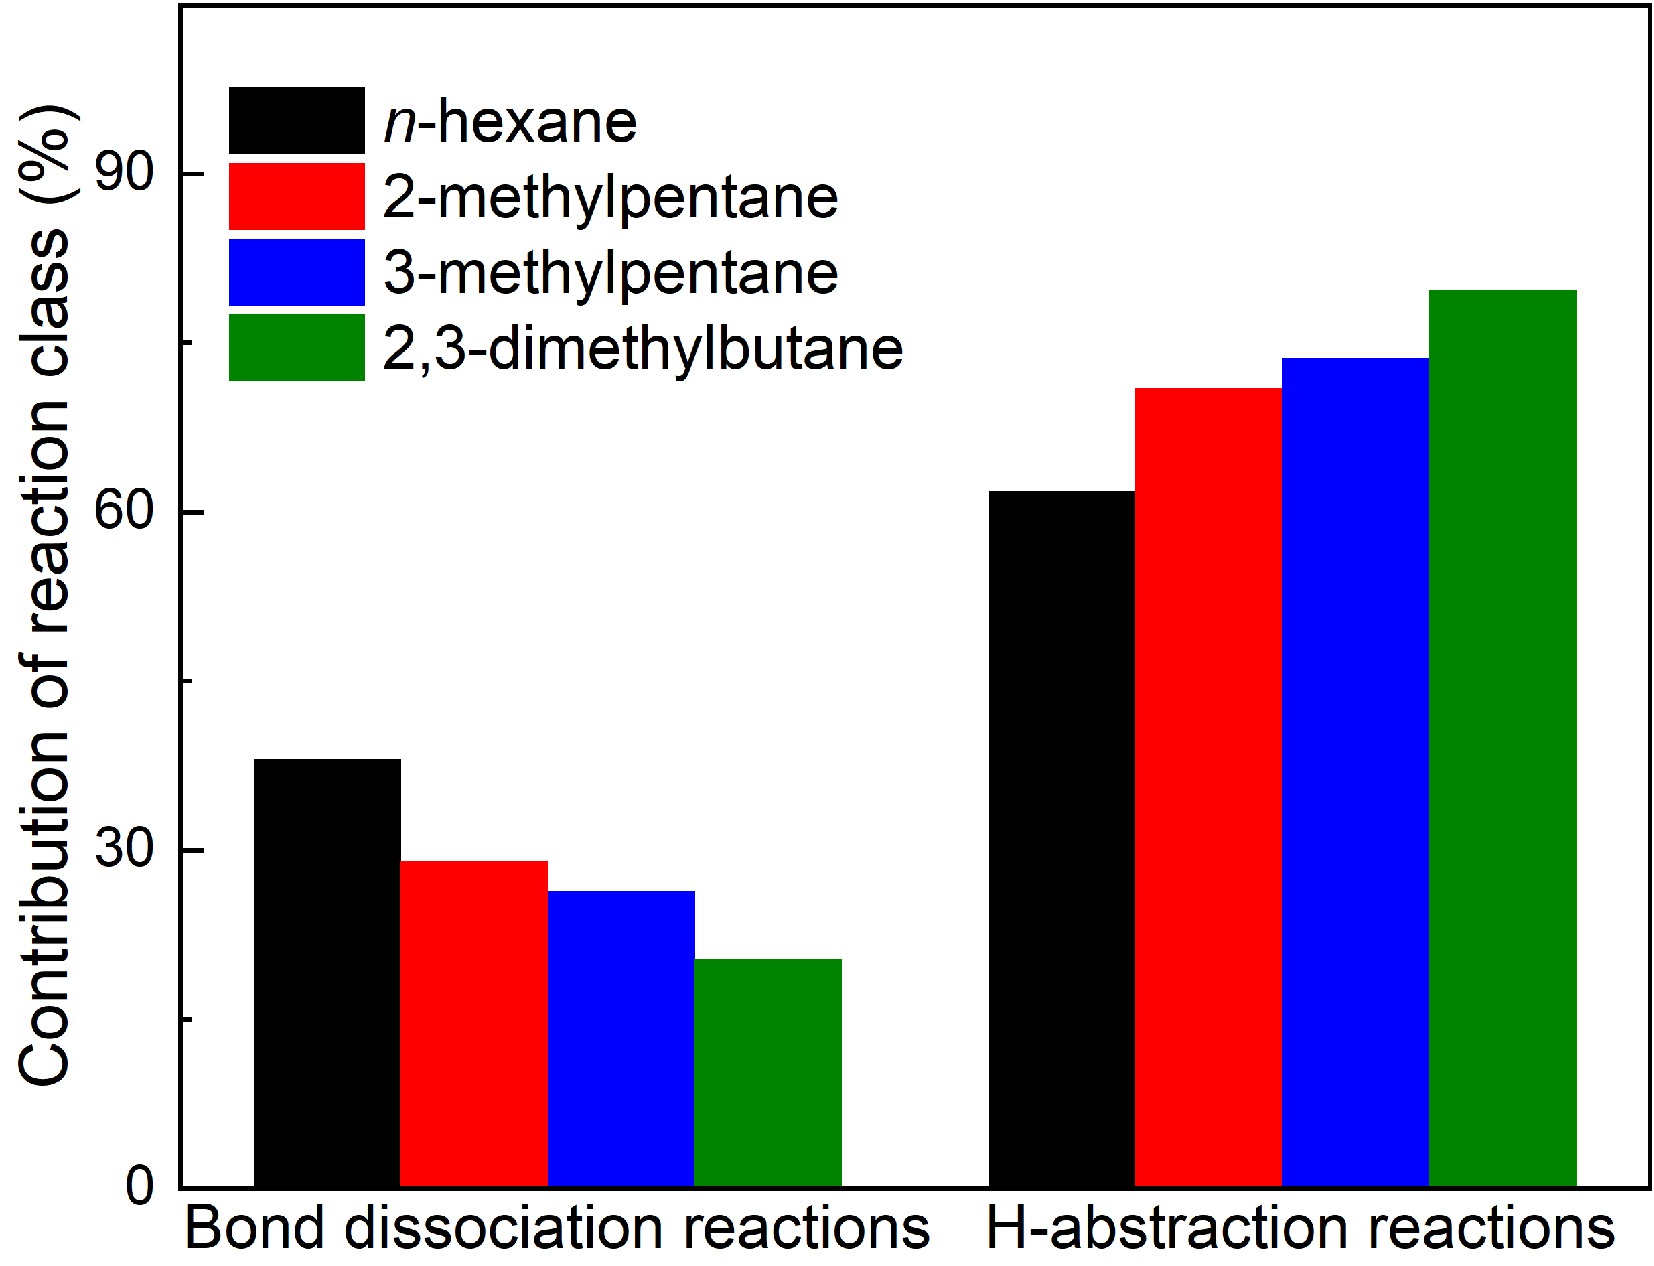
Figure 7.
Contributions of bond dissociation reactions and H-abstraction reactions to fuel consumption in hexanes pyrolysis at 1 atm, 1,075 K (for n-hexane and 2-methylpentane) and 1,050 K (for 3-methylpentane and 2,3-dimethylbutane).
-
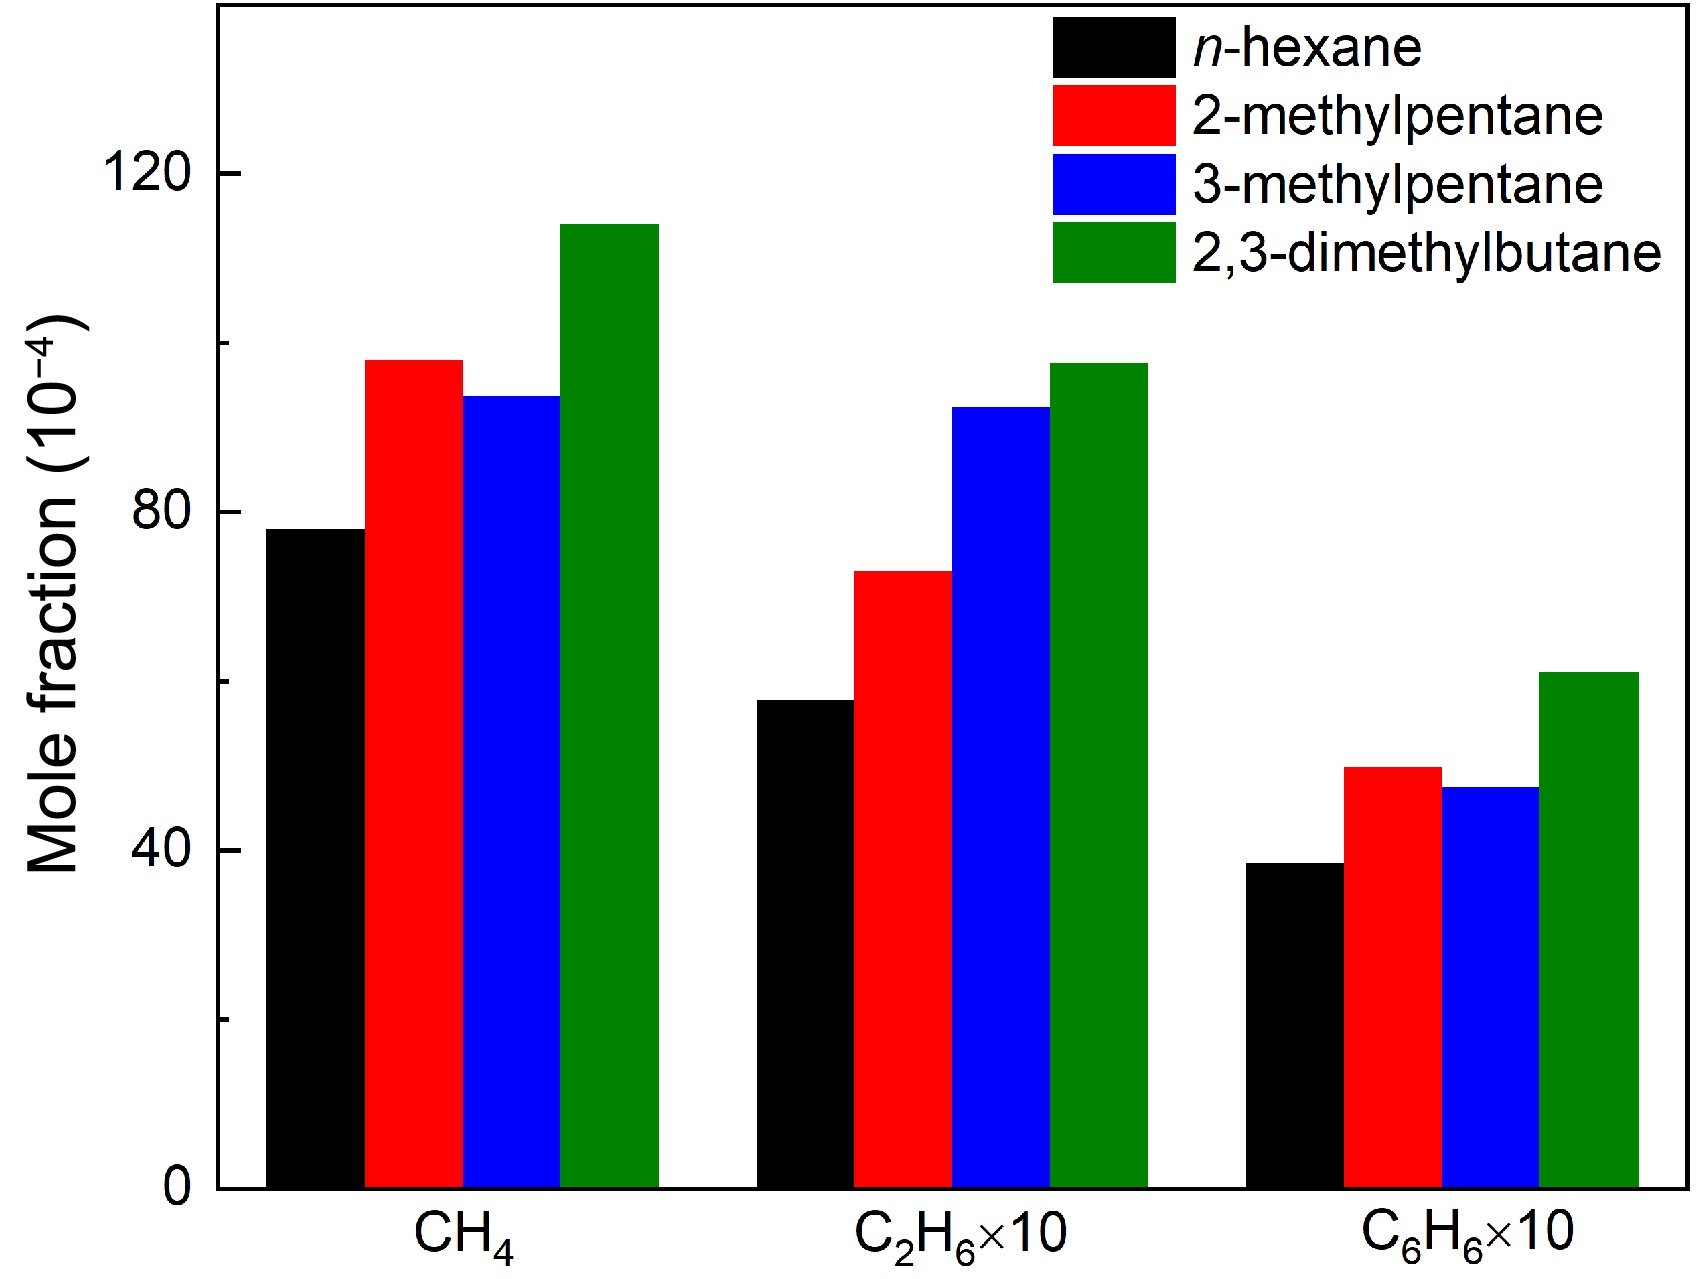
Figure 8.
Comparisons of experimental maximum mole fractions of methane, ethane, and benzene in n-hexane, 2-methylpentane, 3-methylpentane, and 2,3-dimethylbutane pyrolysis at 1 atm. For methane and benzene, the temperature is 1,075 K for n-hexane and 2-methylpentane, and 1,050 K for 3-methylpentane and 2,3-dimethylbutane. For ethane, the temperature is 1,050 K for four hexanes.
-
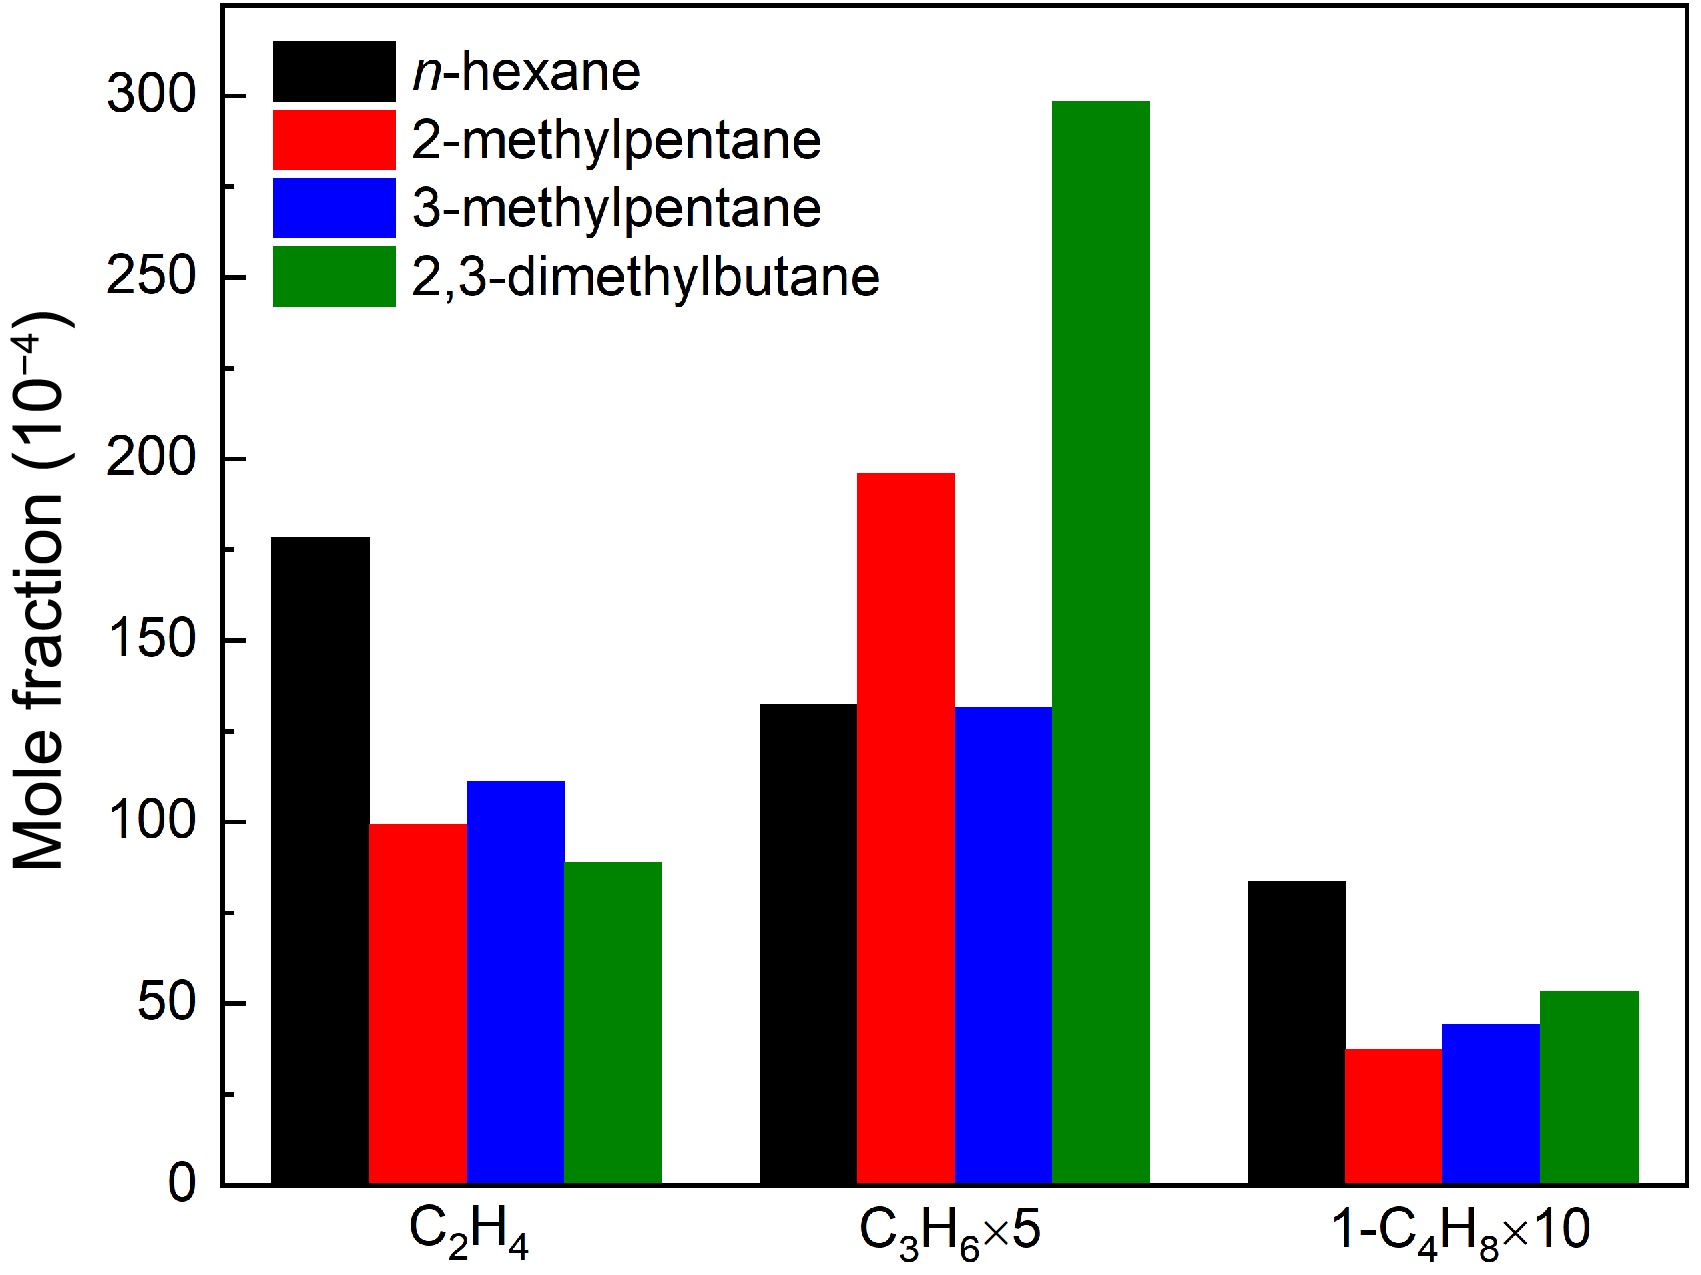
Figure 9.
Comparisons of experimental maximum mole fractions of ethylene, propene, and 1-butene in n-hexane, 2-methylpentane, 3-methylpentane, and 2,3-dimethylbutane pyrolysis at 1 atm. For ethylene, the temperature is 1075 K for n-hexane and 2-methylpentane, and 1050 K for 3-methylpentane and 2,3-dimethylbutane. For propene and 1-butene, the temperature is 1000 K for four hexanes.
-
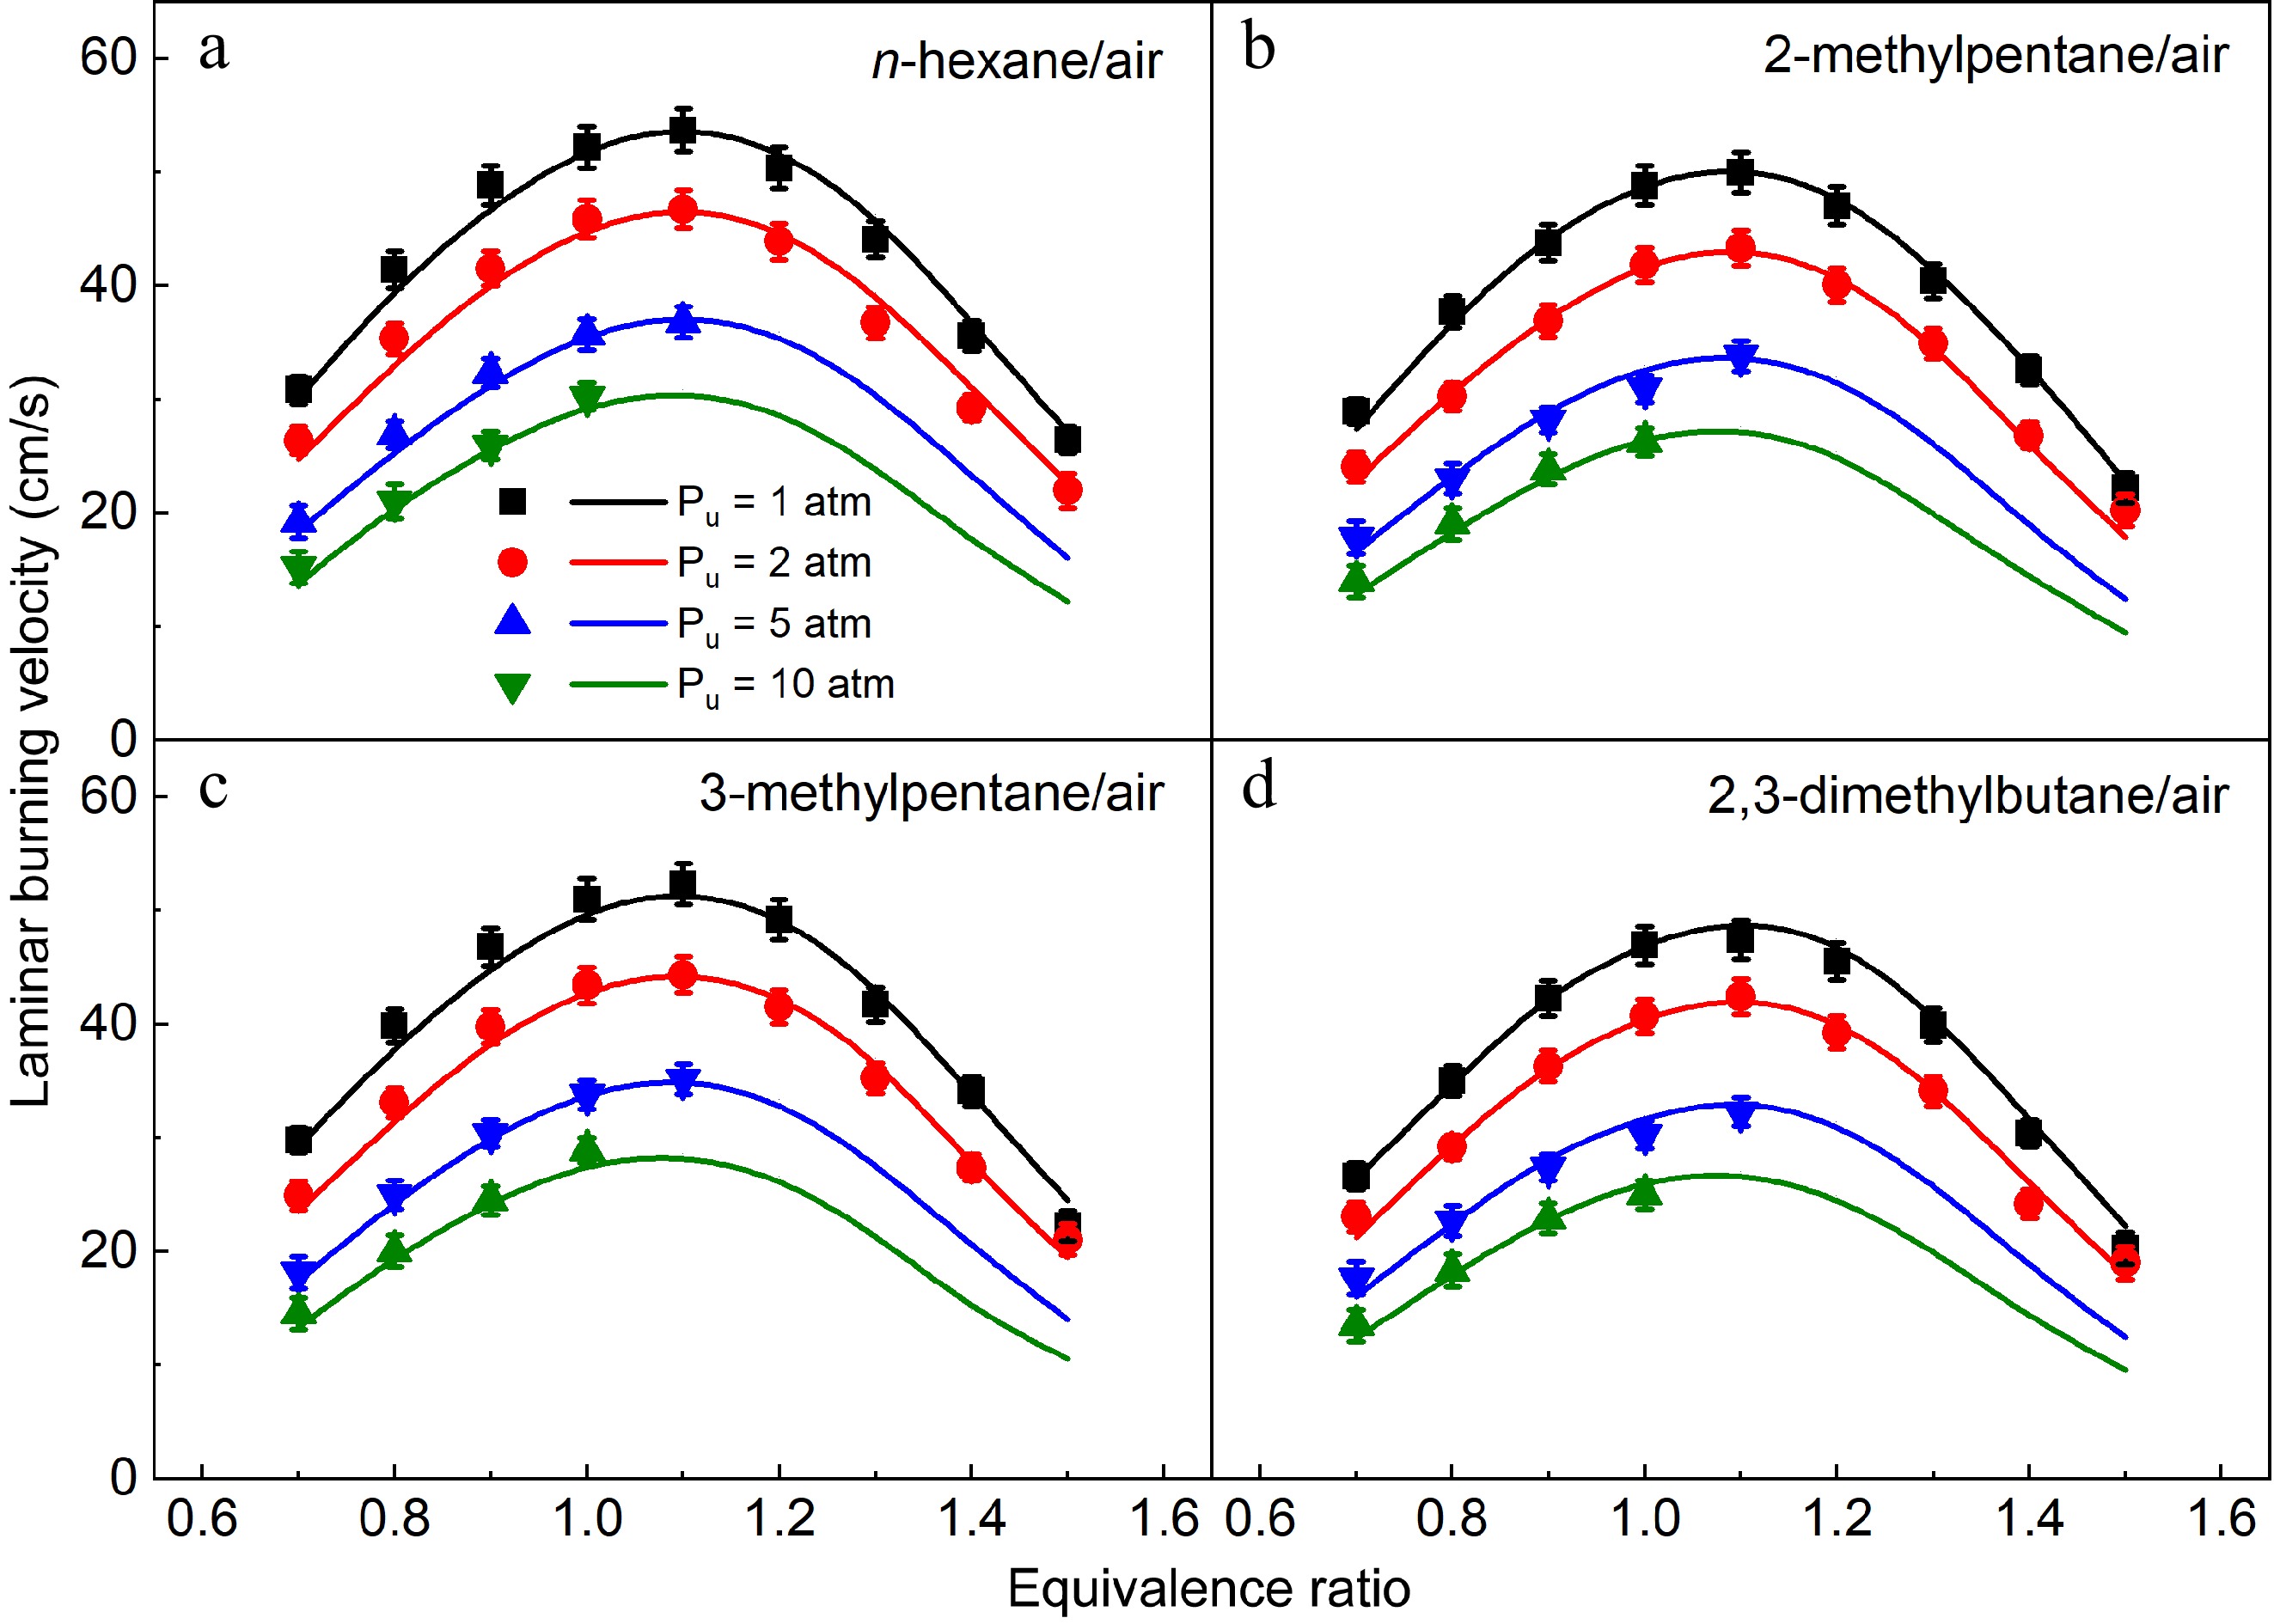
Figure 10.
Laminar burning velocities of (a) n-hexane/air, (b) 2-methylpentane/air, (c) 3-methylpentane/air, and (d) 2,3-dimethylbutane/air mixtures at 1-10 atm and 373 K. Symbols and lines denote the measured and simulated results, respectively.
-
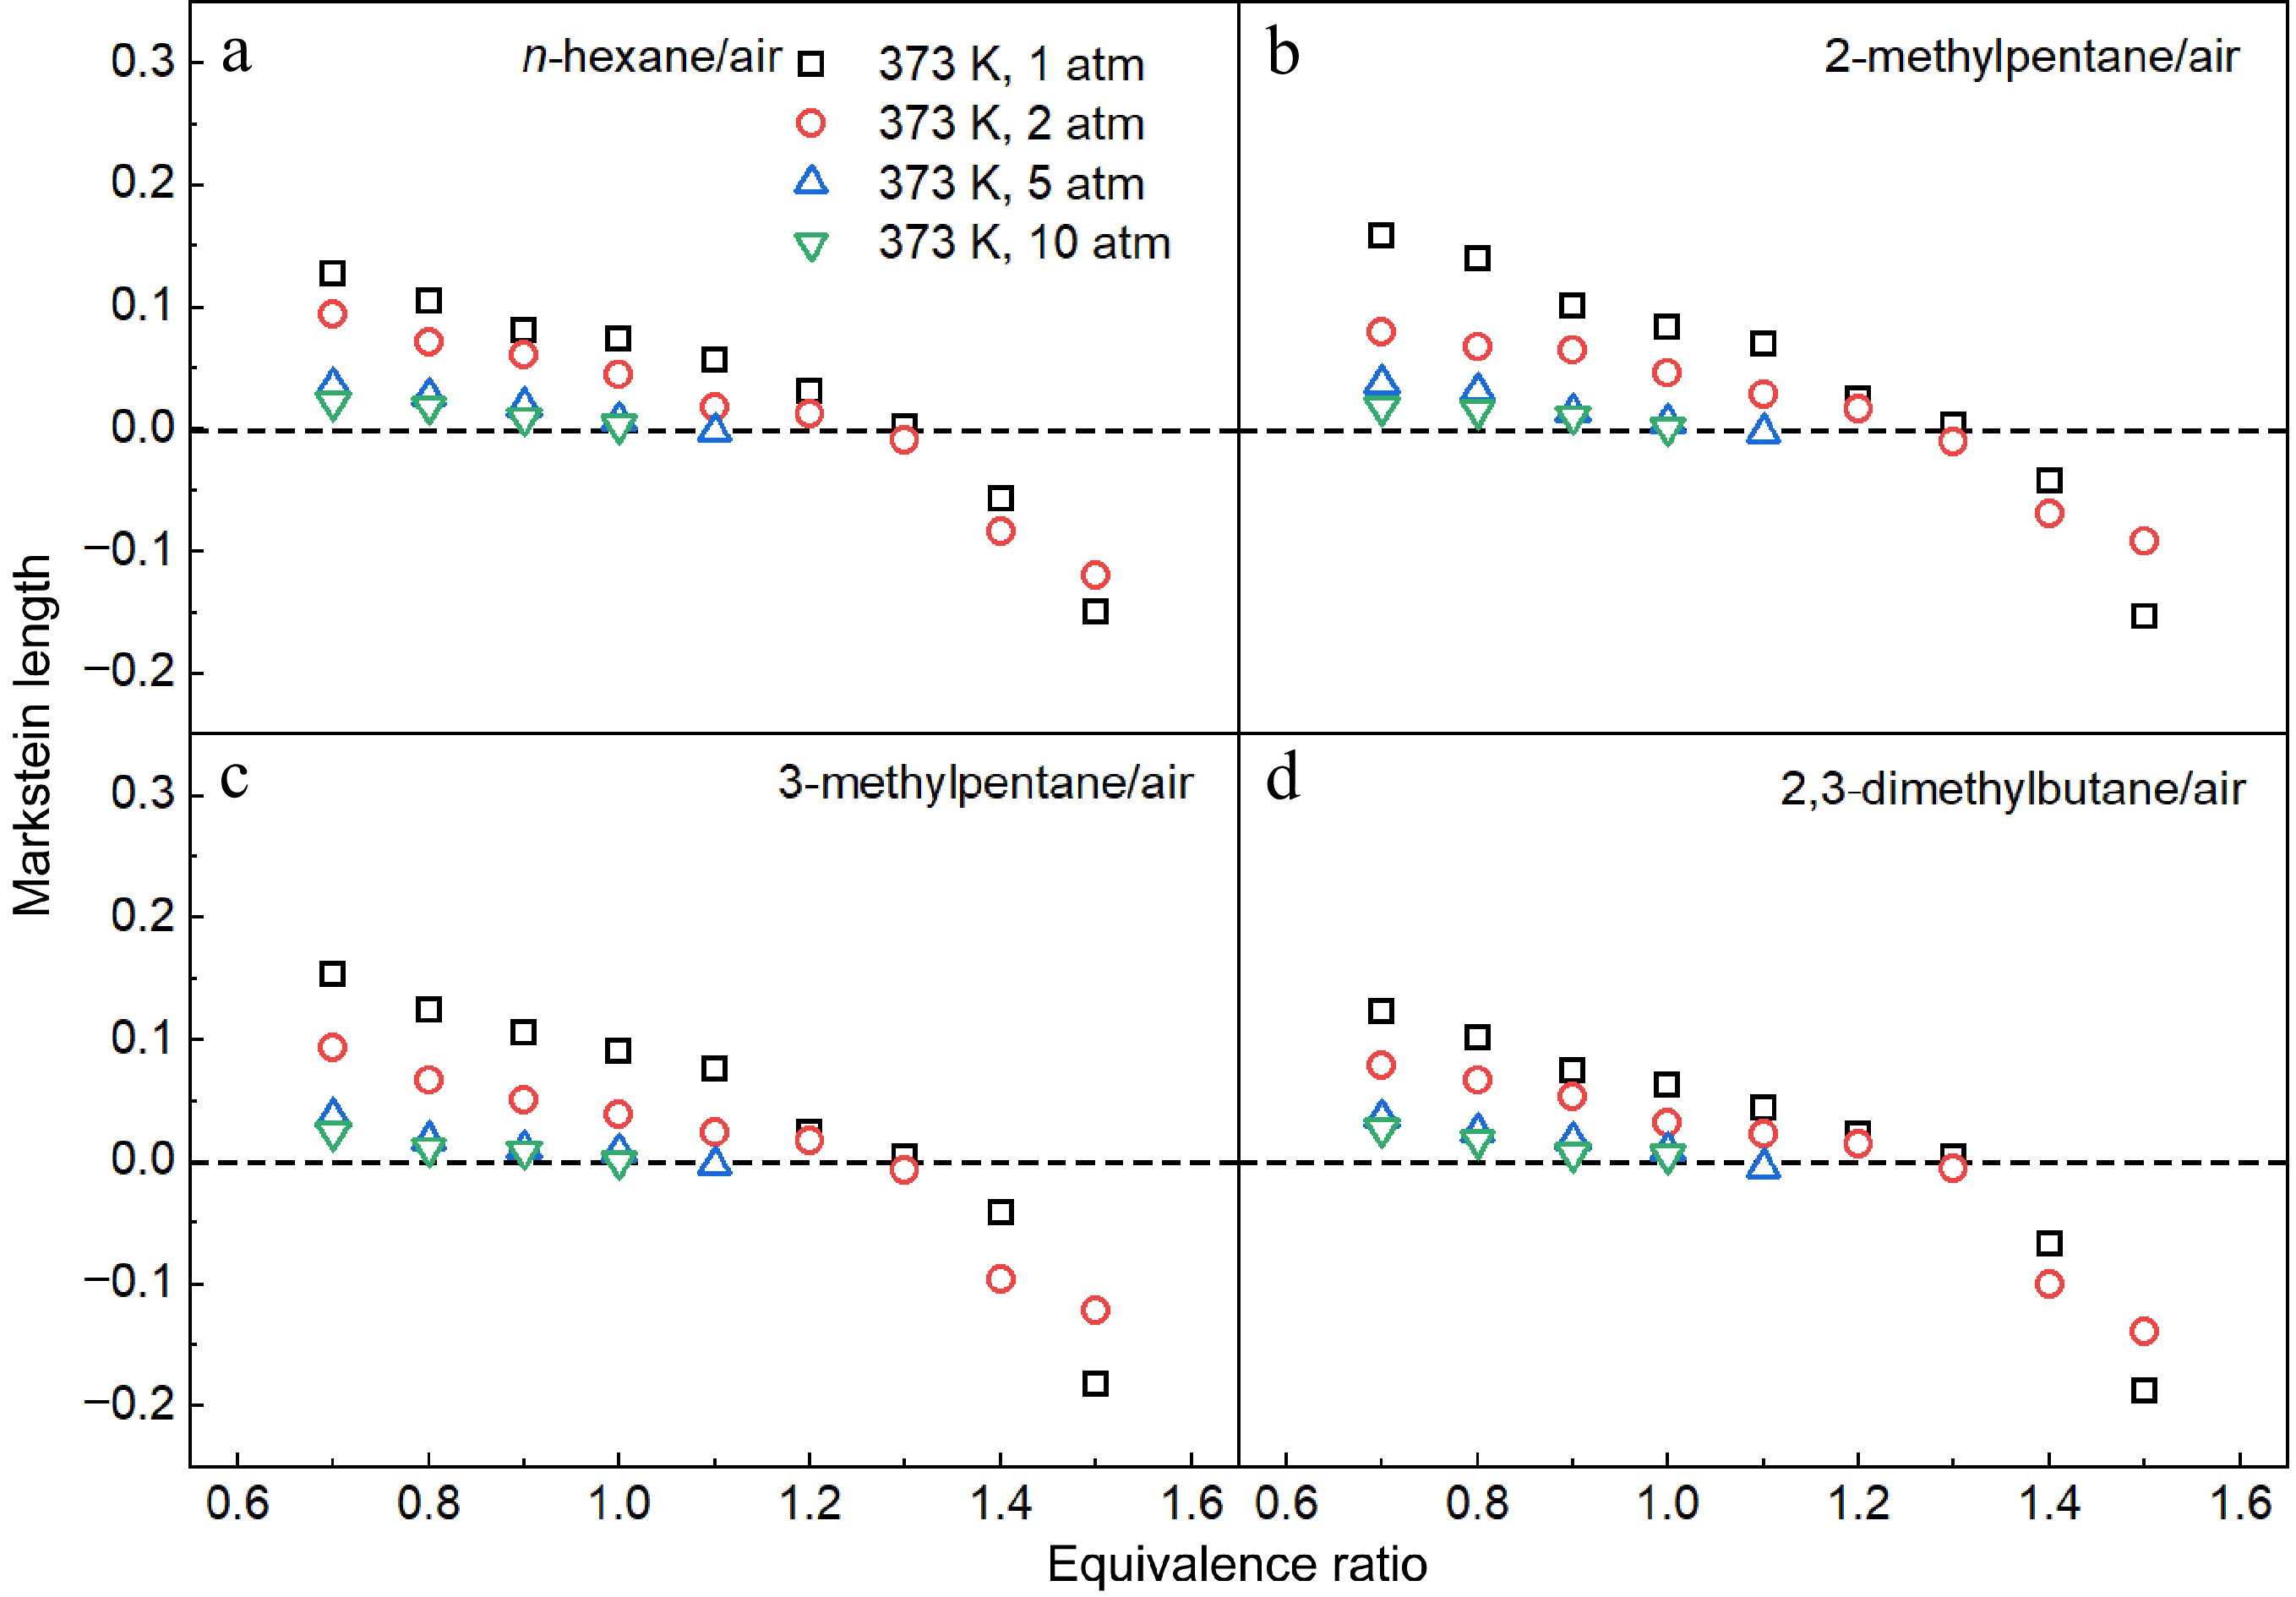
Figure 11.
Measured Markstein lengths of (a) n-hexane/air, (b) 2-methylpentane/air, (c) 3-methylpentane/air, and (d) 2,3-dimethylbutane/air mixtures at 1-10 atm and 373 K.
-
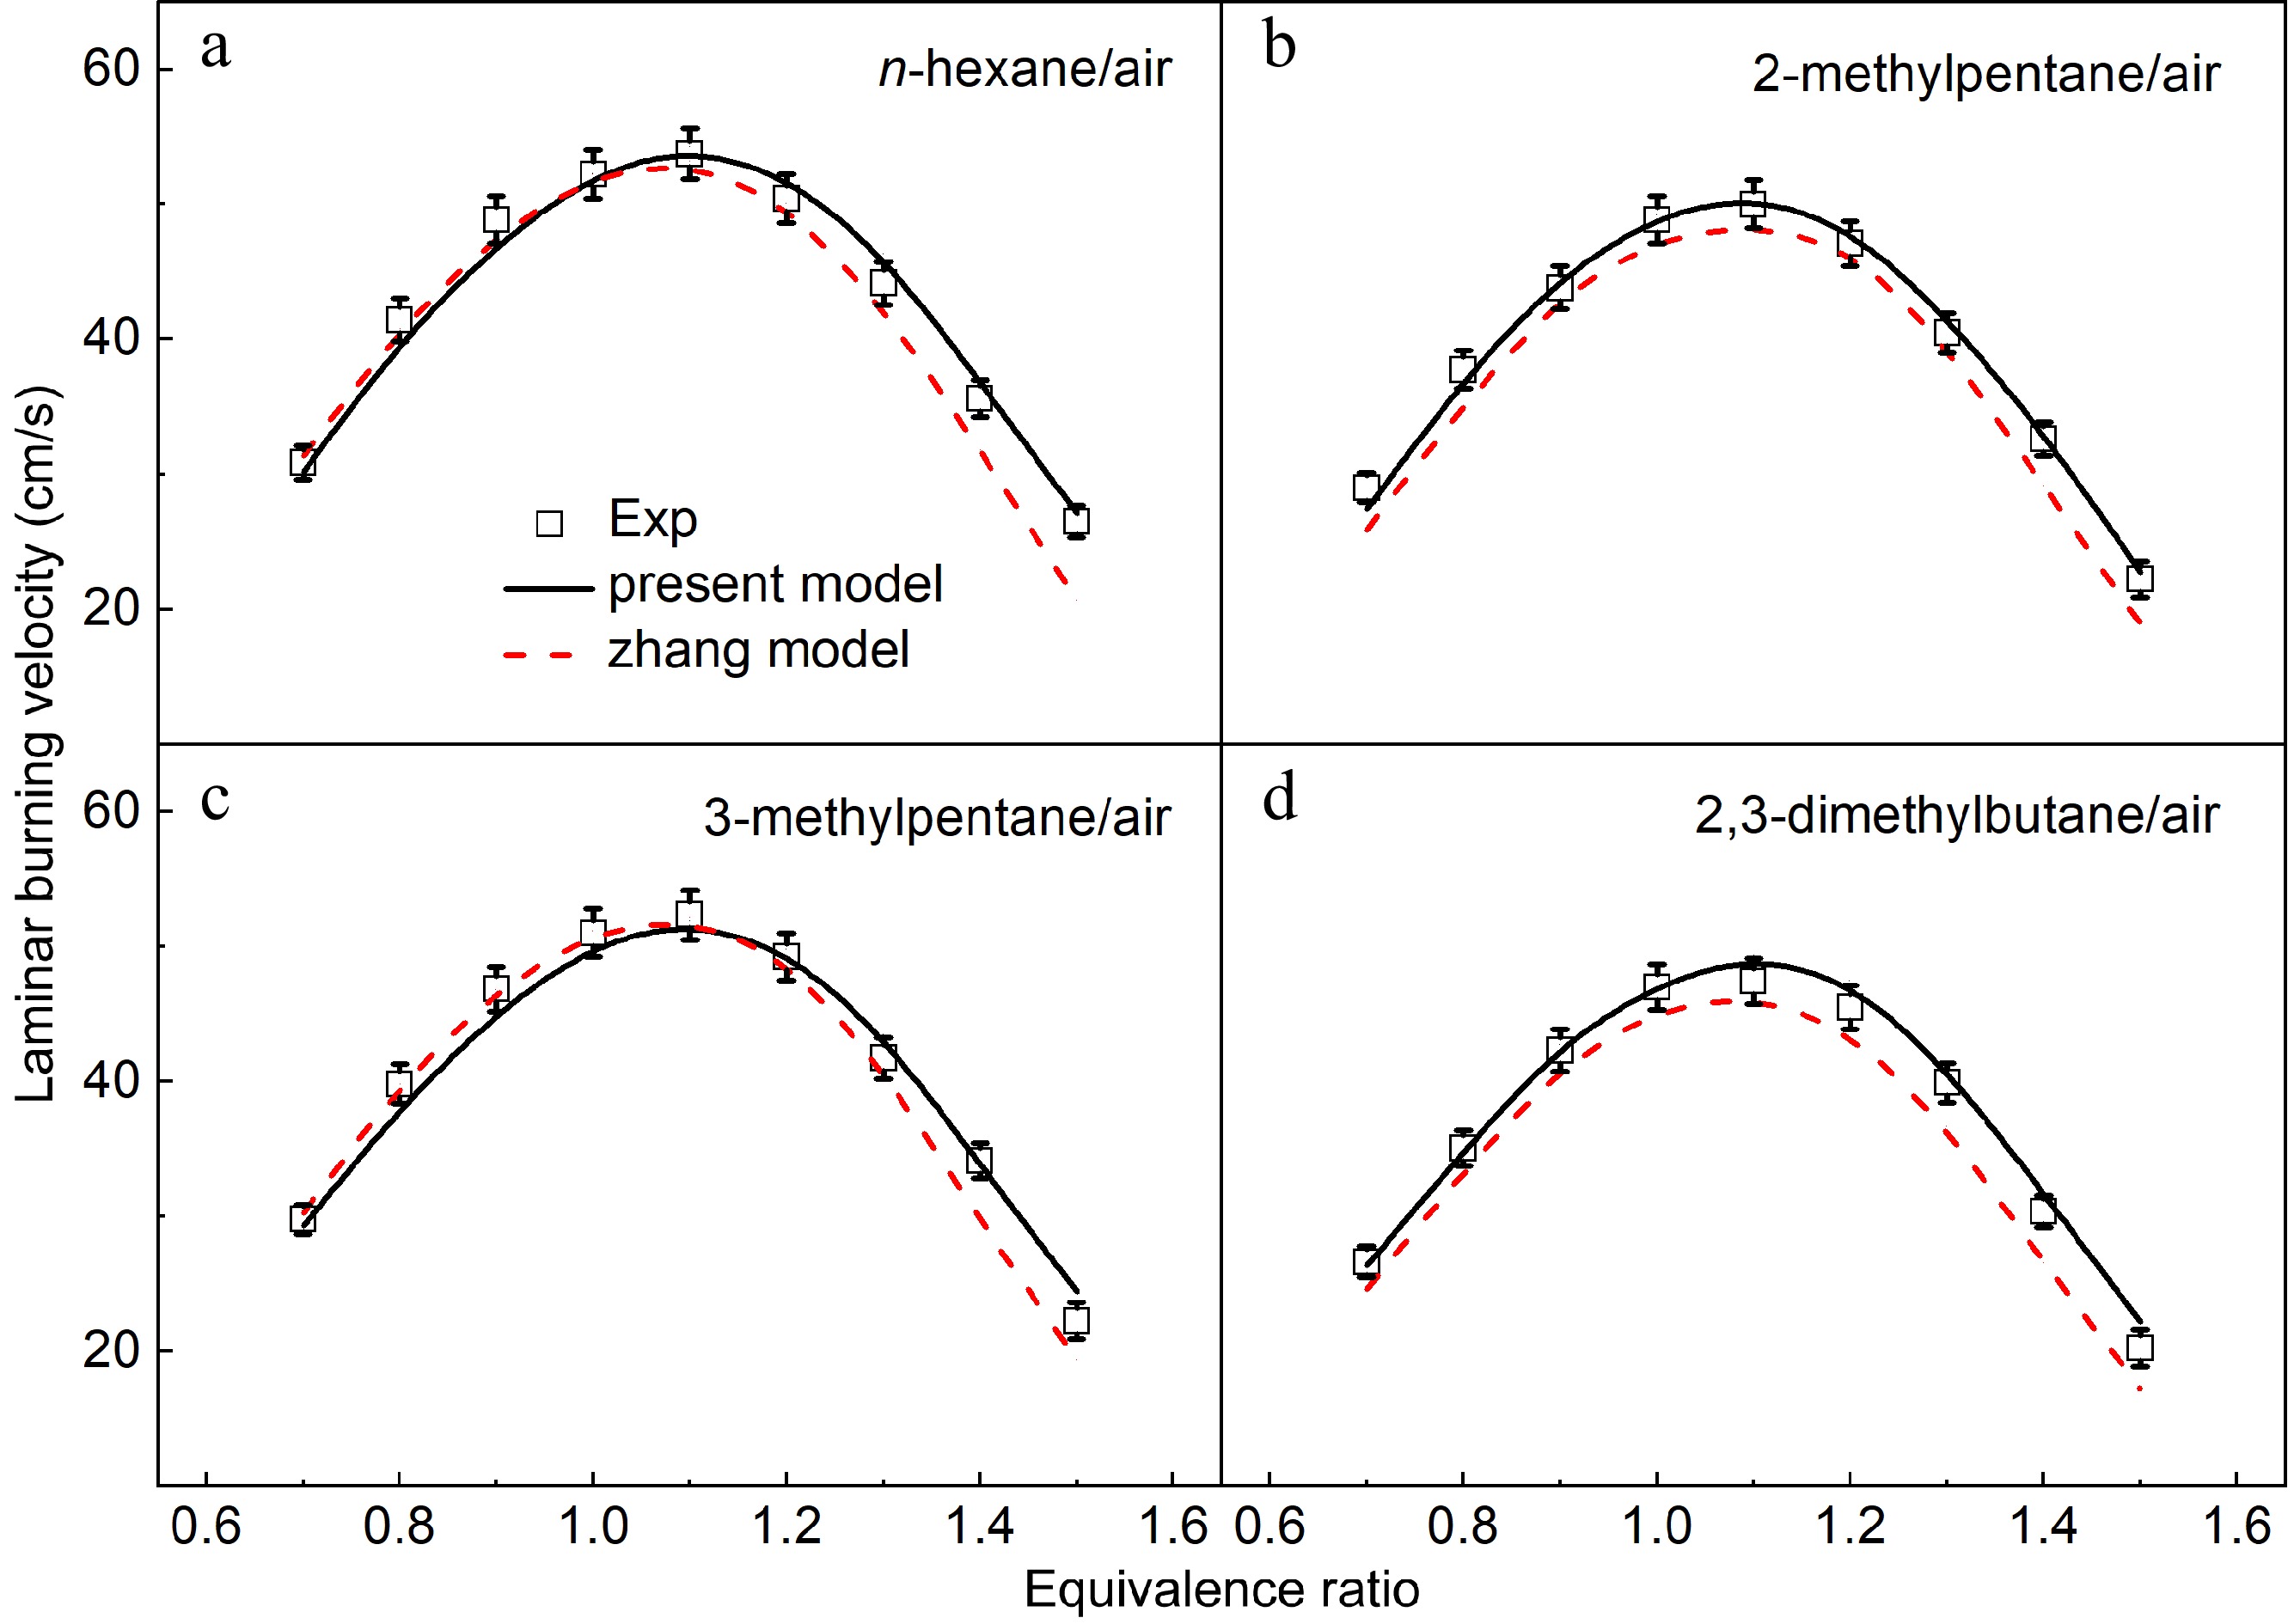
Figure 12.
Laminar burning velocities of (a) n-hexane/air, (b) 2-methylpentane/air, (c) 3-methylpentane/air, and (d) 2,3-dimethylbutane/air mixtures at 1 atm and 373 K. Symbols denote the measured results. Solid lines and dotted lines denote the simulated results by the present model and the Zhang model[12].
-
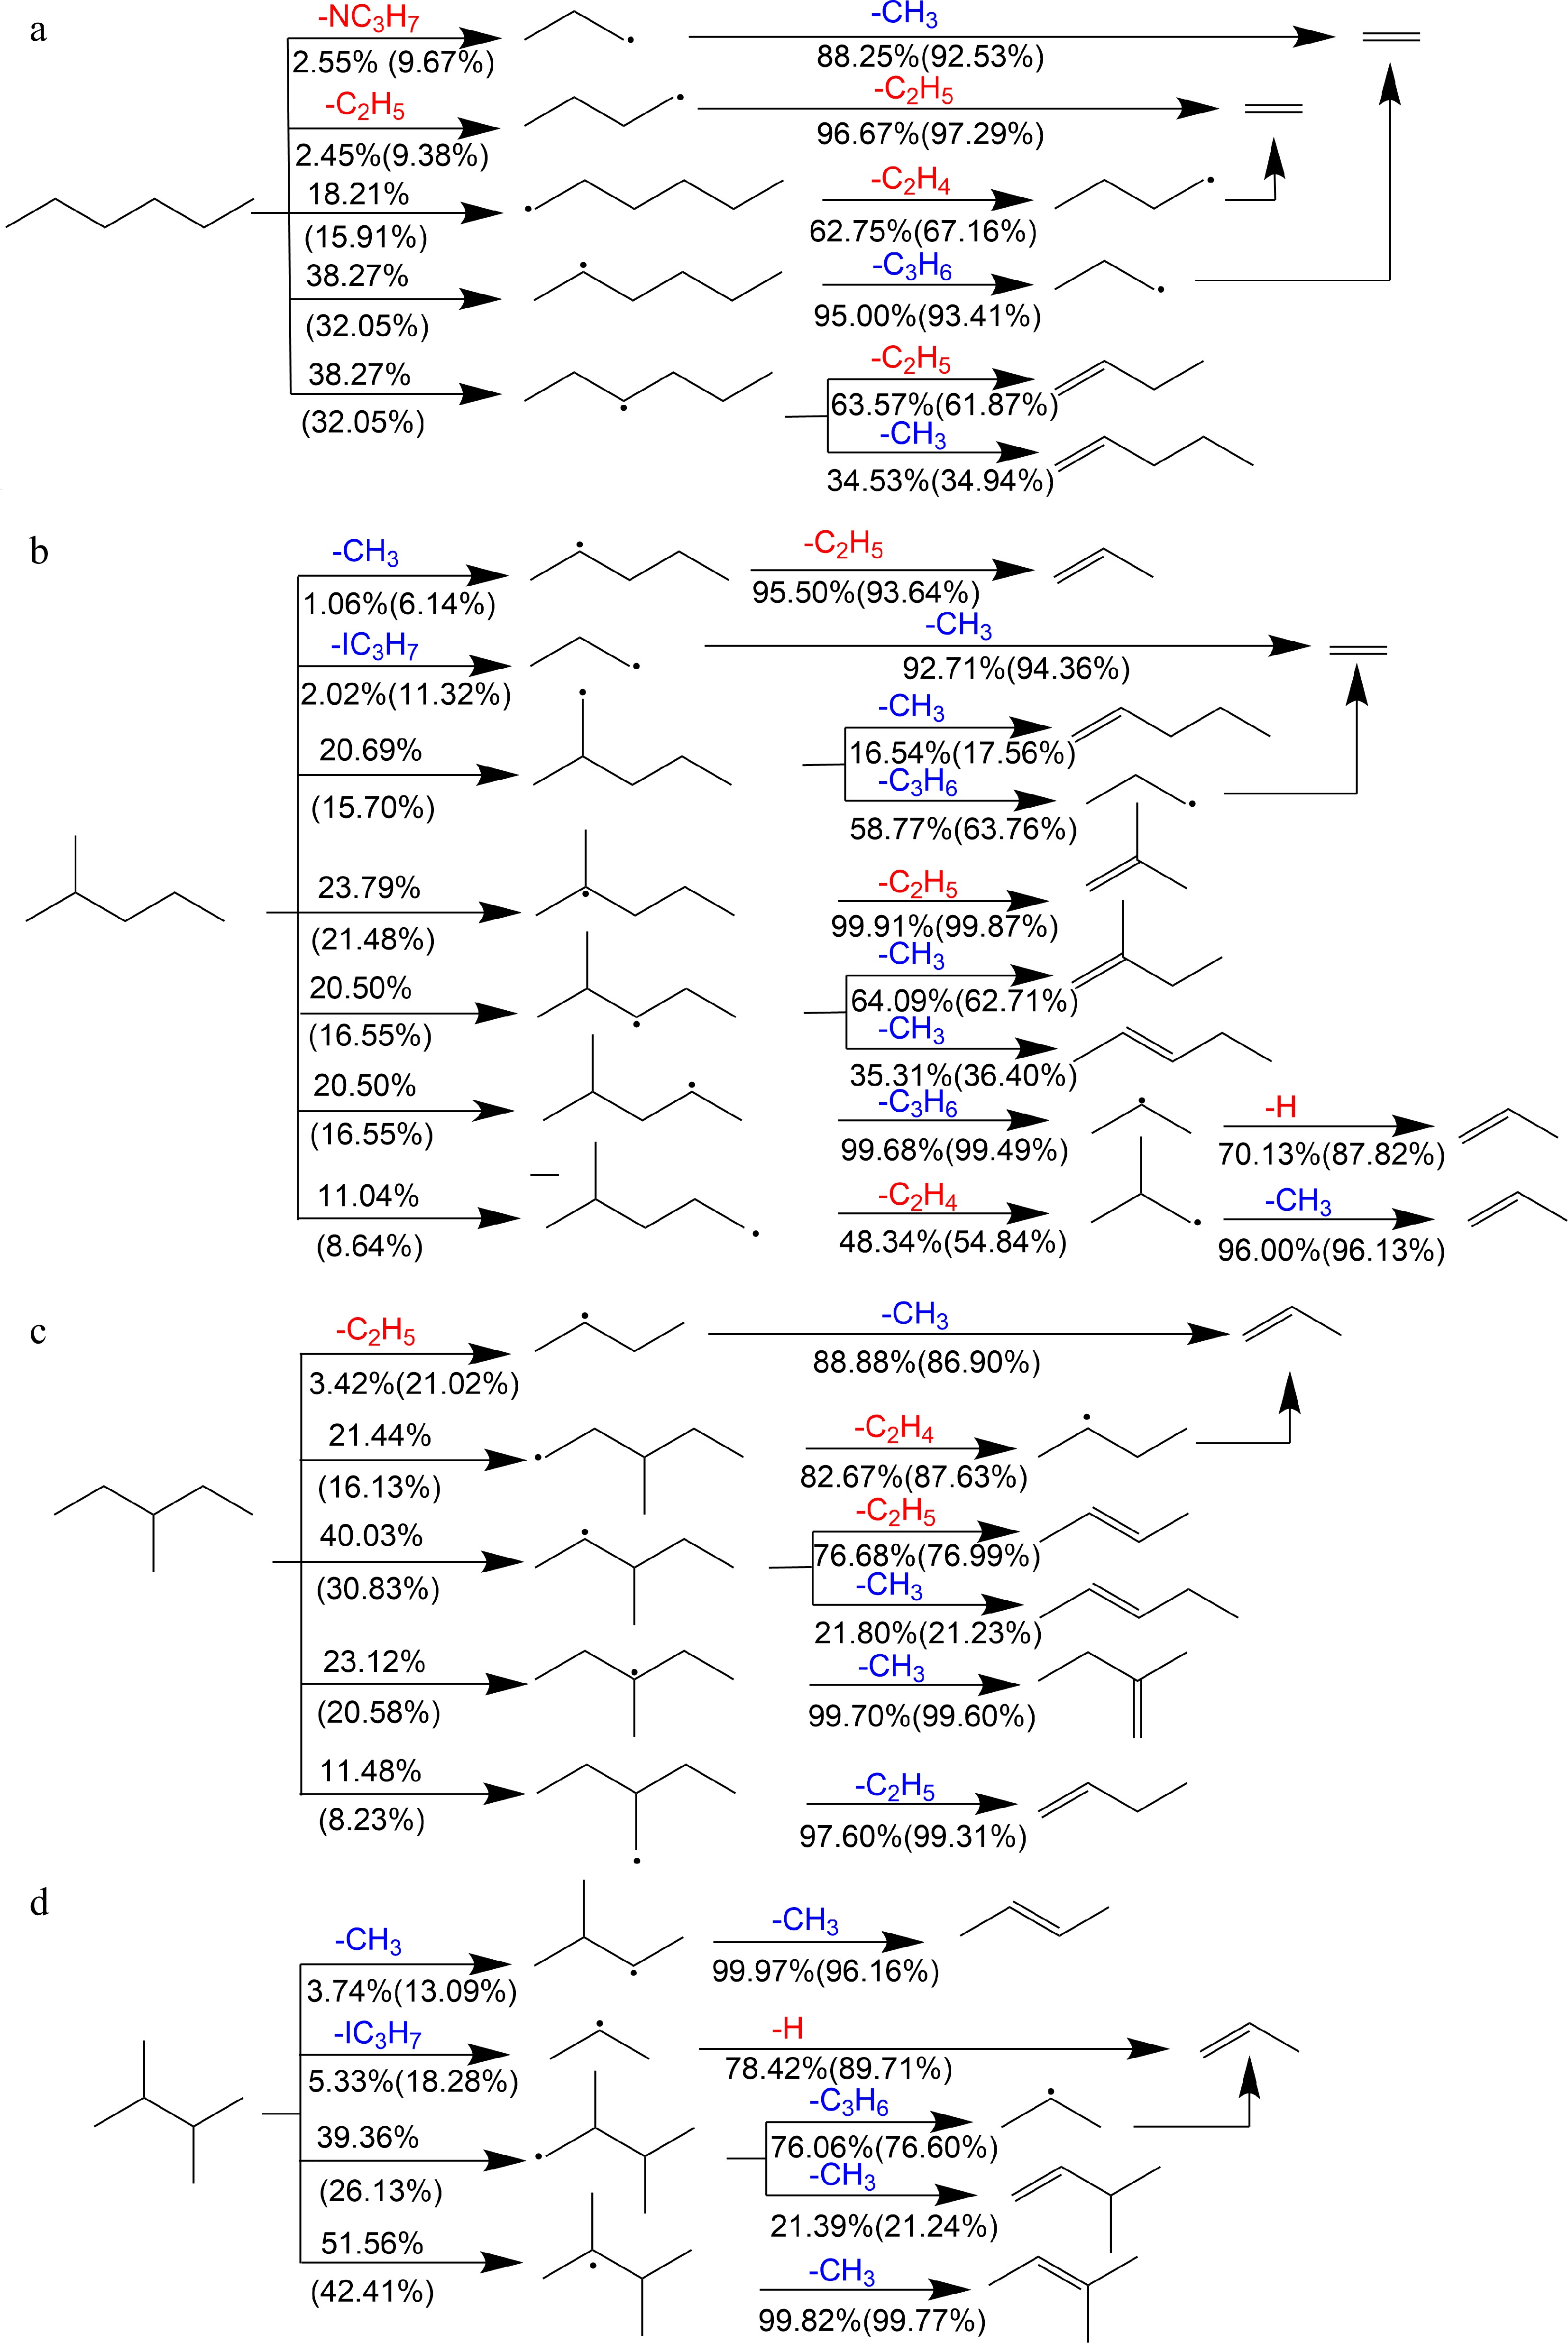
Figure 13.
Reaction schemes of primary decomposition pathways of (a) n-hexane, (b) 2-methylpentane, (c) 3-methylpentane, and (d) 2,3-dimethylbutane at 373 K, 1 atm, ϕ = 0.7 and 1.5. Red and blue highlight the intermediates which generally promotes and inhibits the flame propagation respectively. Numbers represent the percentages of corresponding pathways in total reaction flux (outside the brackets: ϕ = 0.7; in brackets: ϕ = 1.5).
-
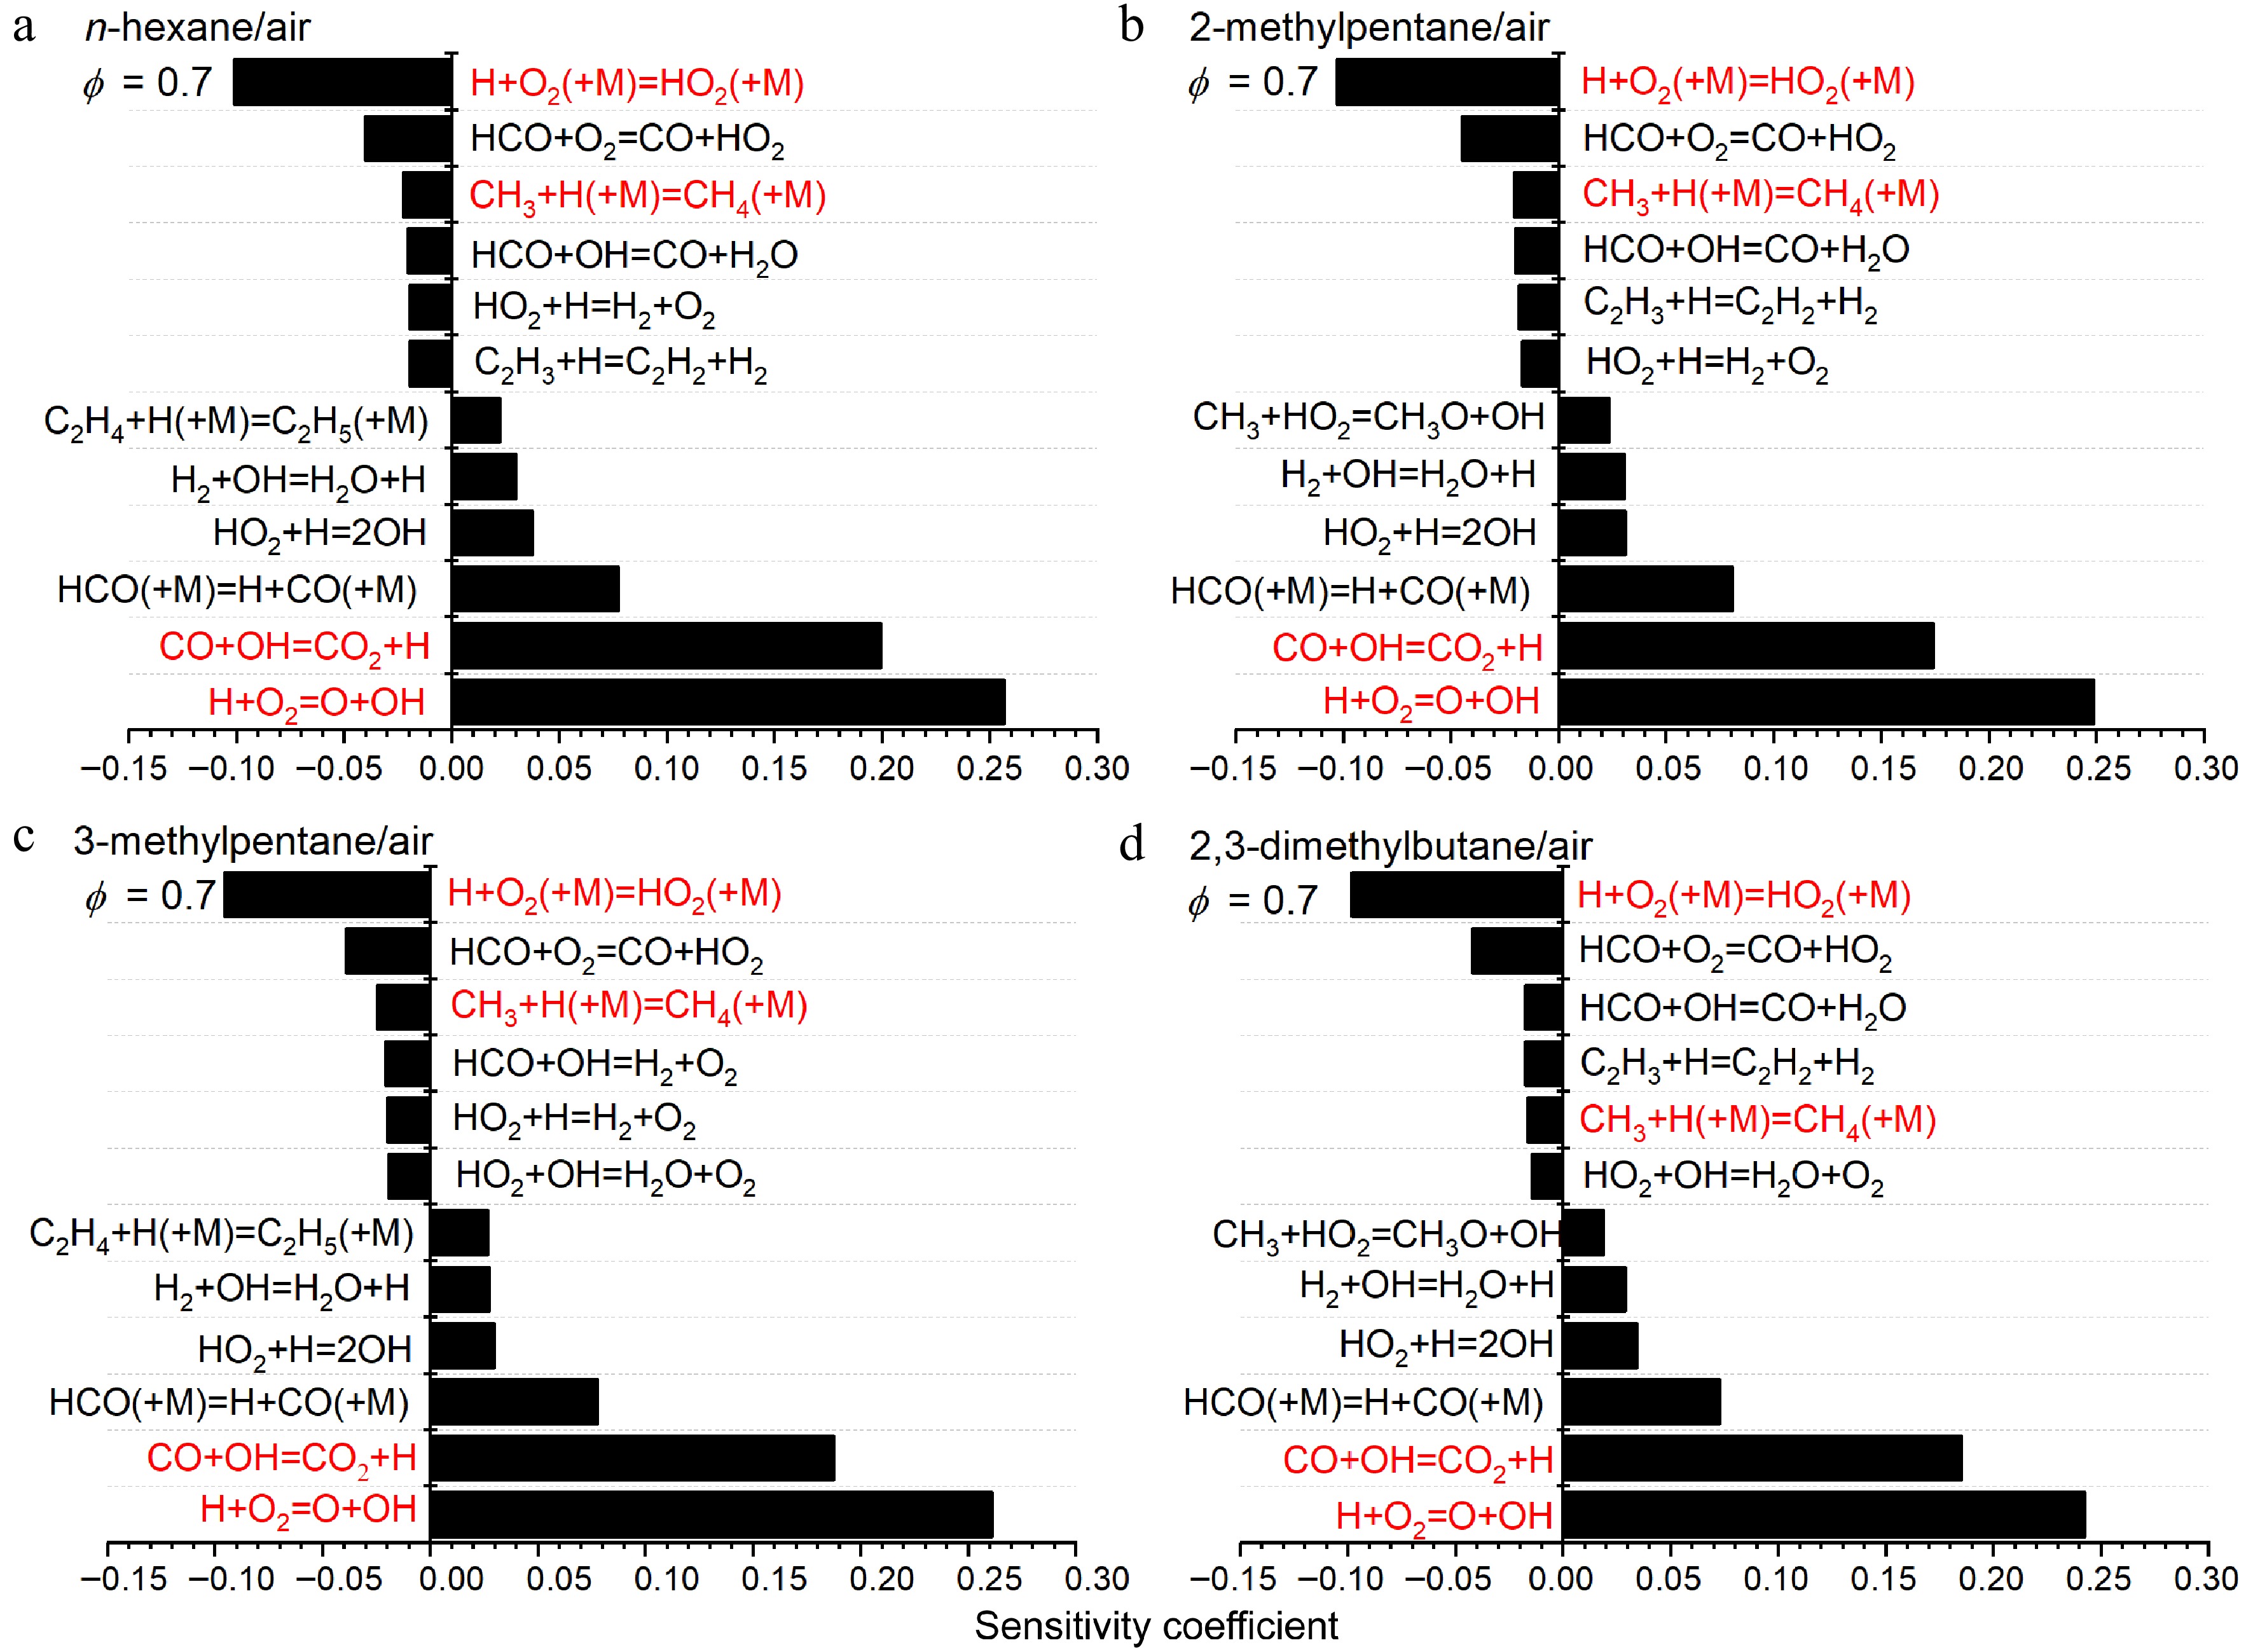
Figure 14.
Sensitivity analysis of LBVs for (a) n-hexane/air, (b) 2-methylpentane/air, (c) 3-methylpentane/air, and (d) 2,3-dimethylbutane/air at 373 K, 1 atm and ϕ = 0.7. Some important reactions are highlighted in red.
-
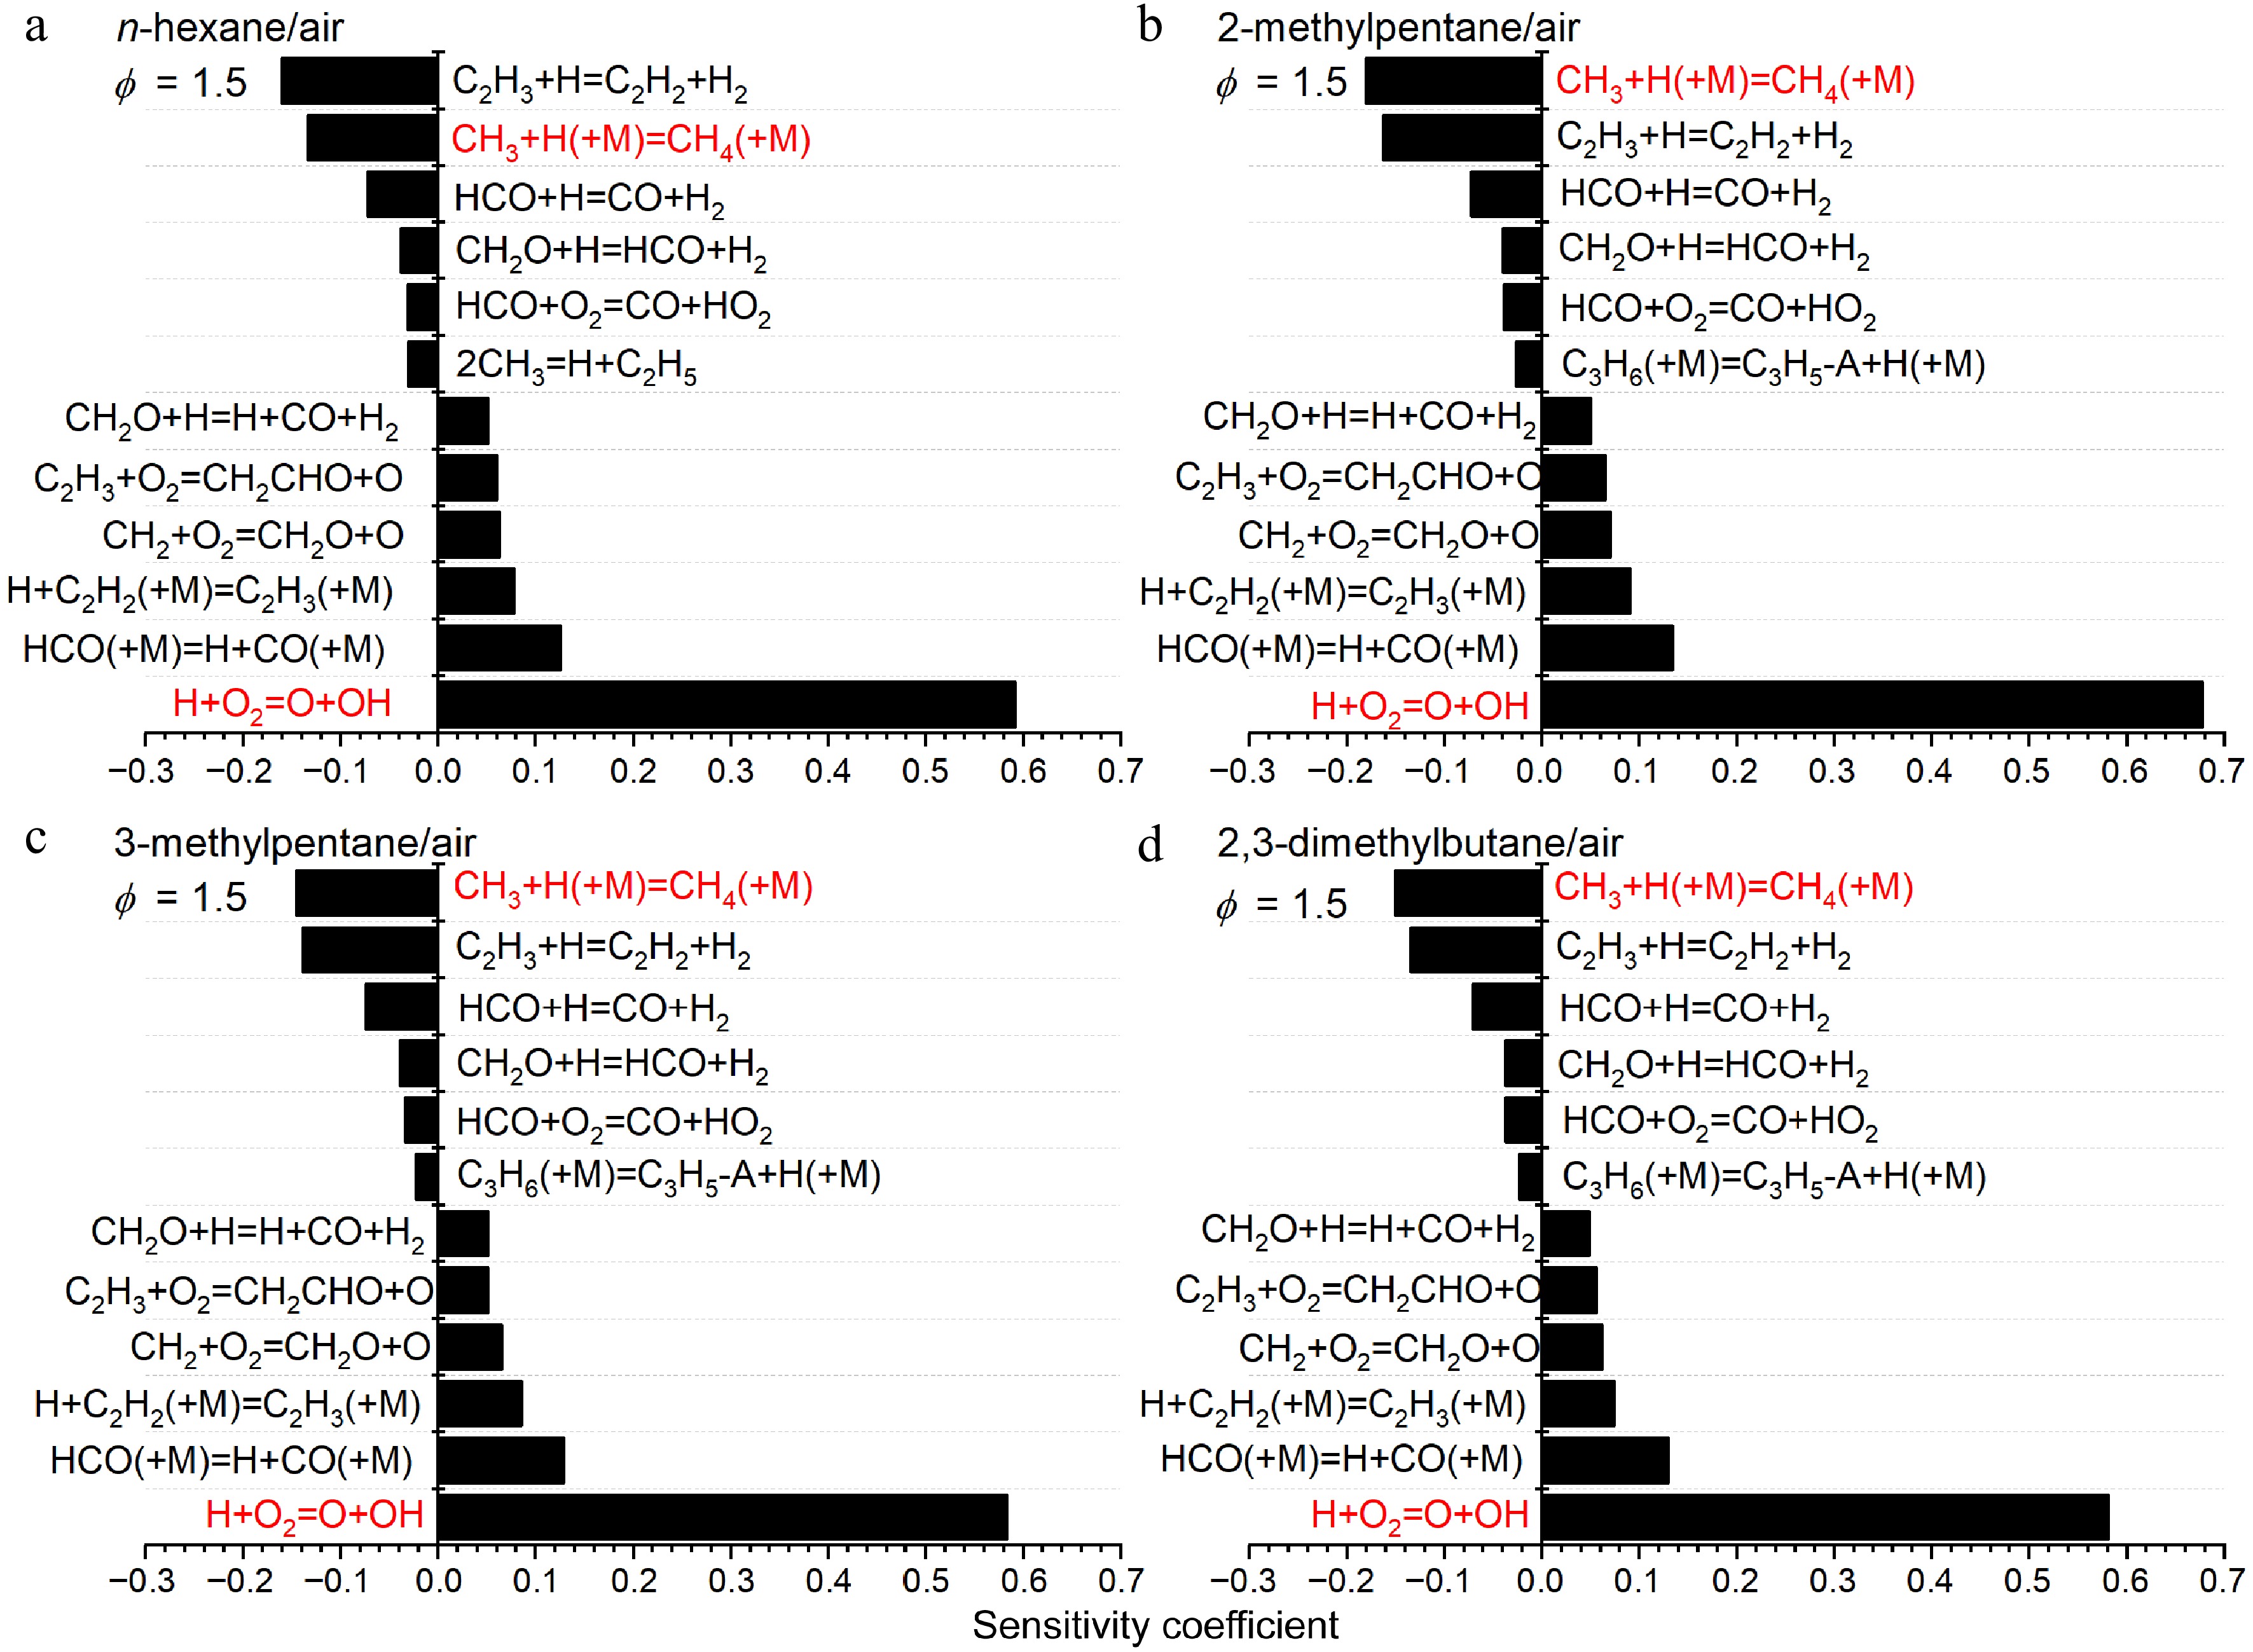
Figure 15.
Sensitivity analysis of LBVs for (a) n-hexane/air, (b) 2-methylpentane/air, (c) 3-methylpentane/air, and (d) 2,3-dimethylbutane/air at 373 K, 1 atm and ϕ = 1.5. Some important reactions are highlighted in red.
-
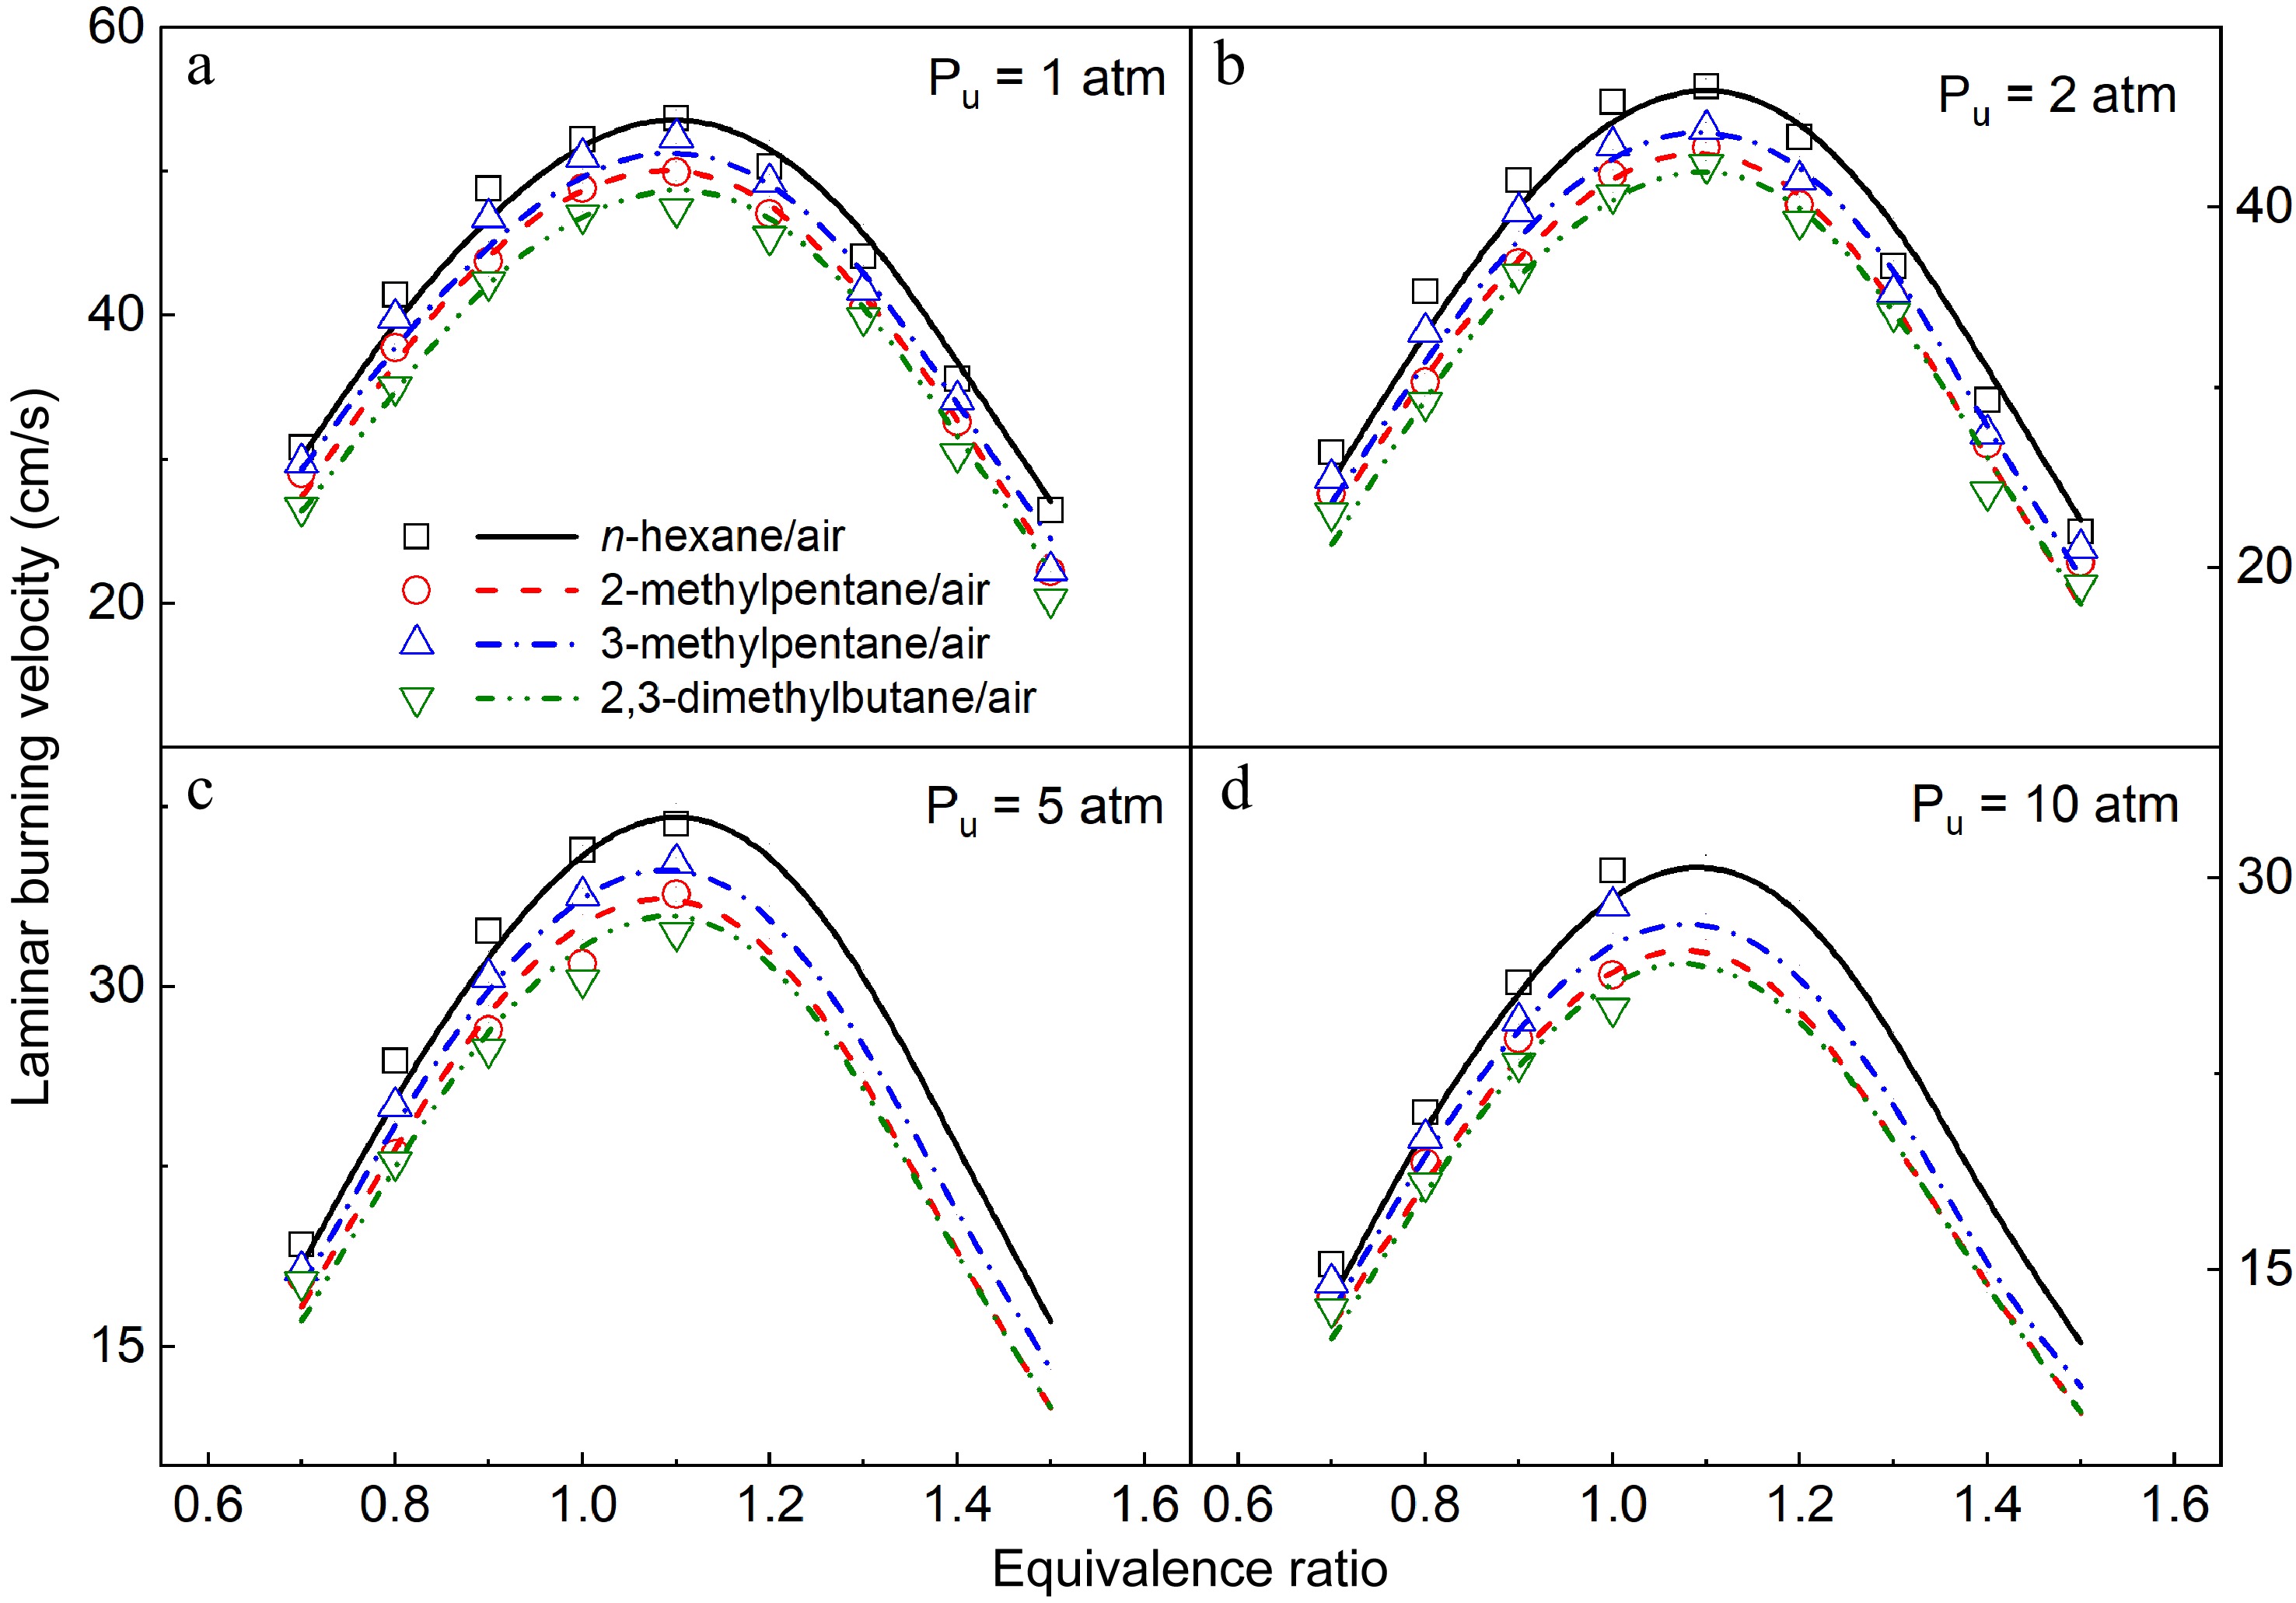
Figure 16.
Comparison of measured (symbols) and simulated (lines) LBVs of the four hexane isomers at 1−10 atm and 373 K.
-
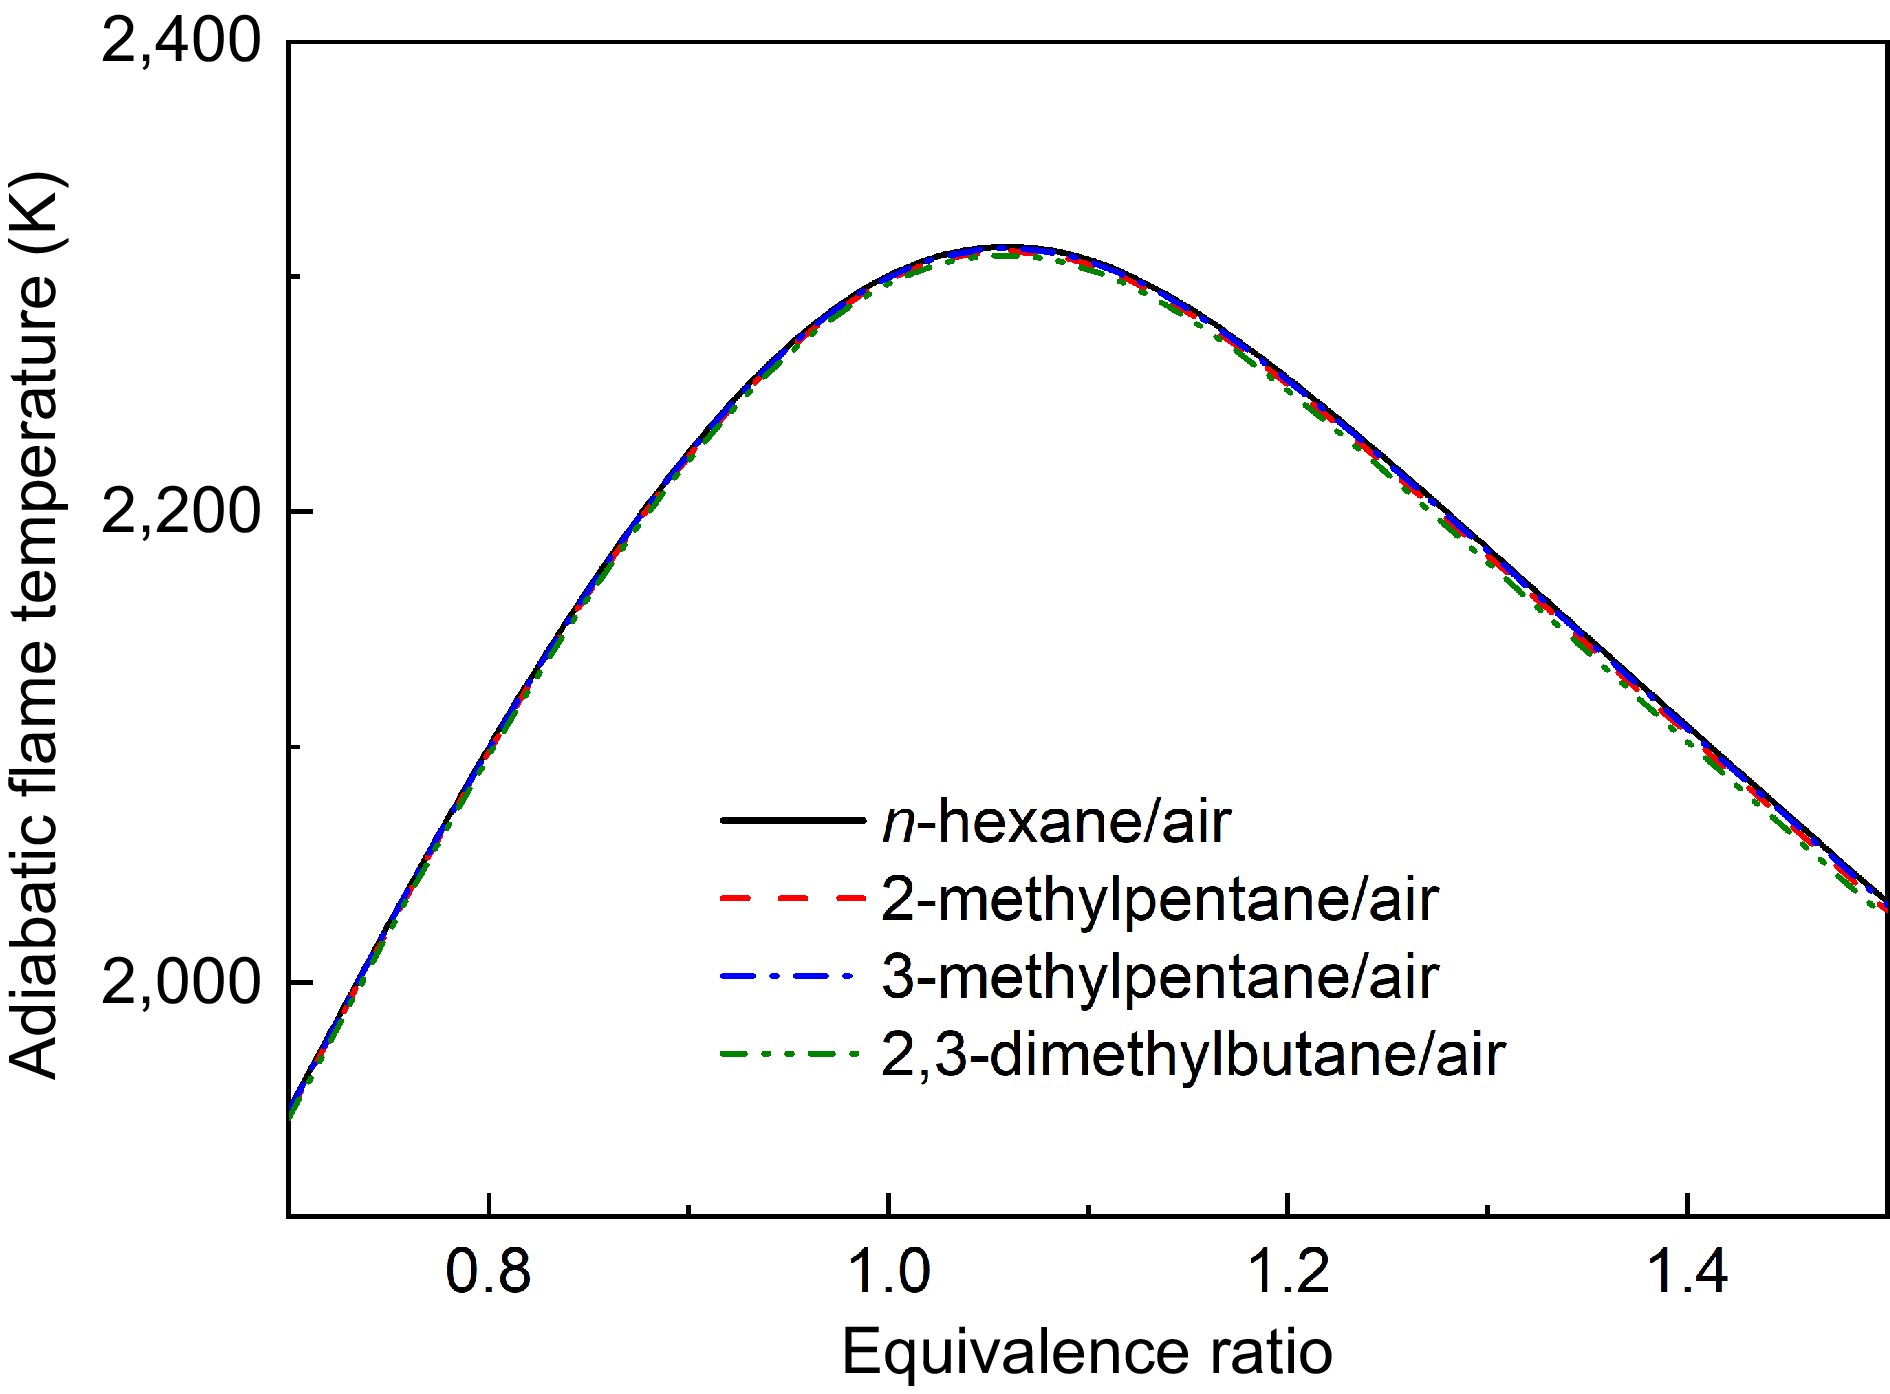
Figure 17.
Comparisons of calculated adiabatic flame temperatures of four hexanes flames at Pu = 1 atm.
-
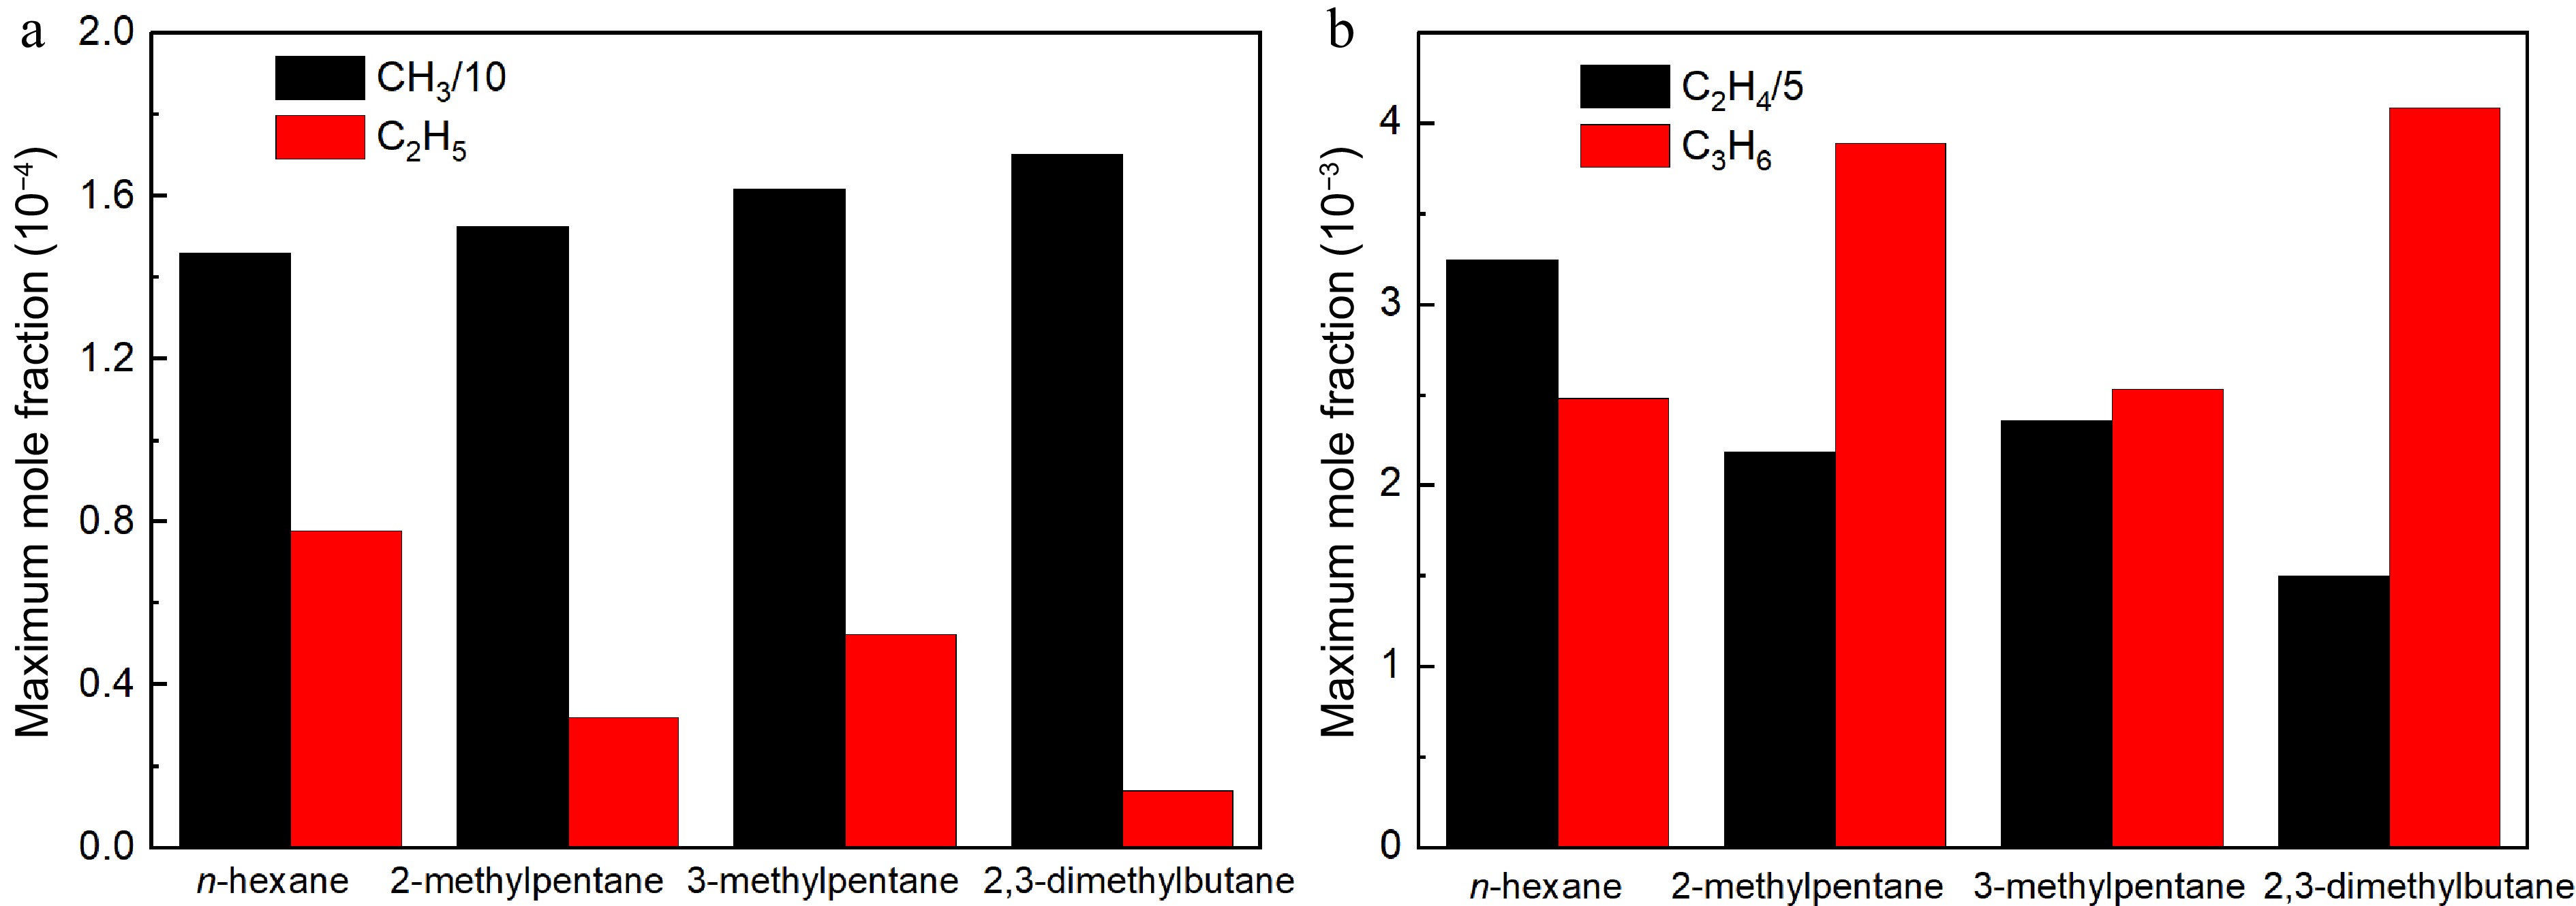
Figure 18.
Comparisons of simulated maximum mole fraction of critical radicals by the present model in n-hexane, 2-methylpentane, 3-methylpentane, and 2,3-dimethylbutane flames at 373 K, 1 atm and ϕ = 1.5: (a) methyl and ethyl, (b) ethylene and propene.
Figures
(18)
Tables
(0)