-
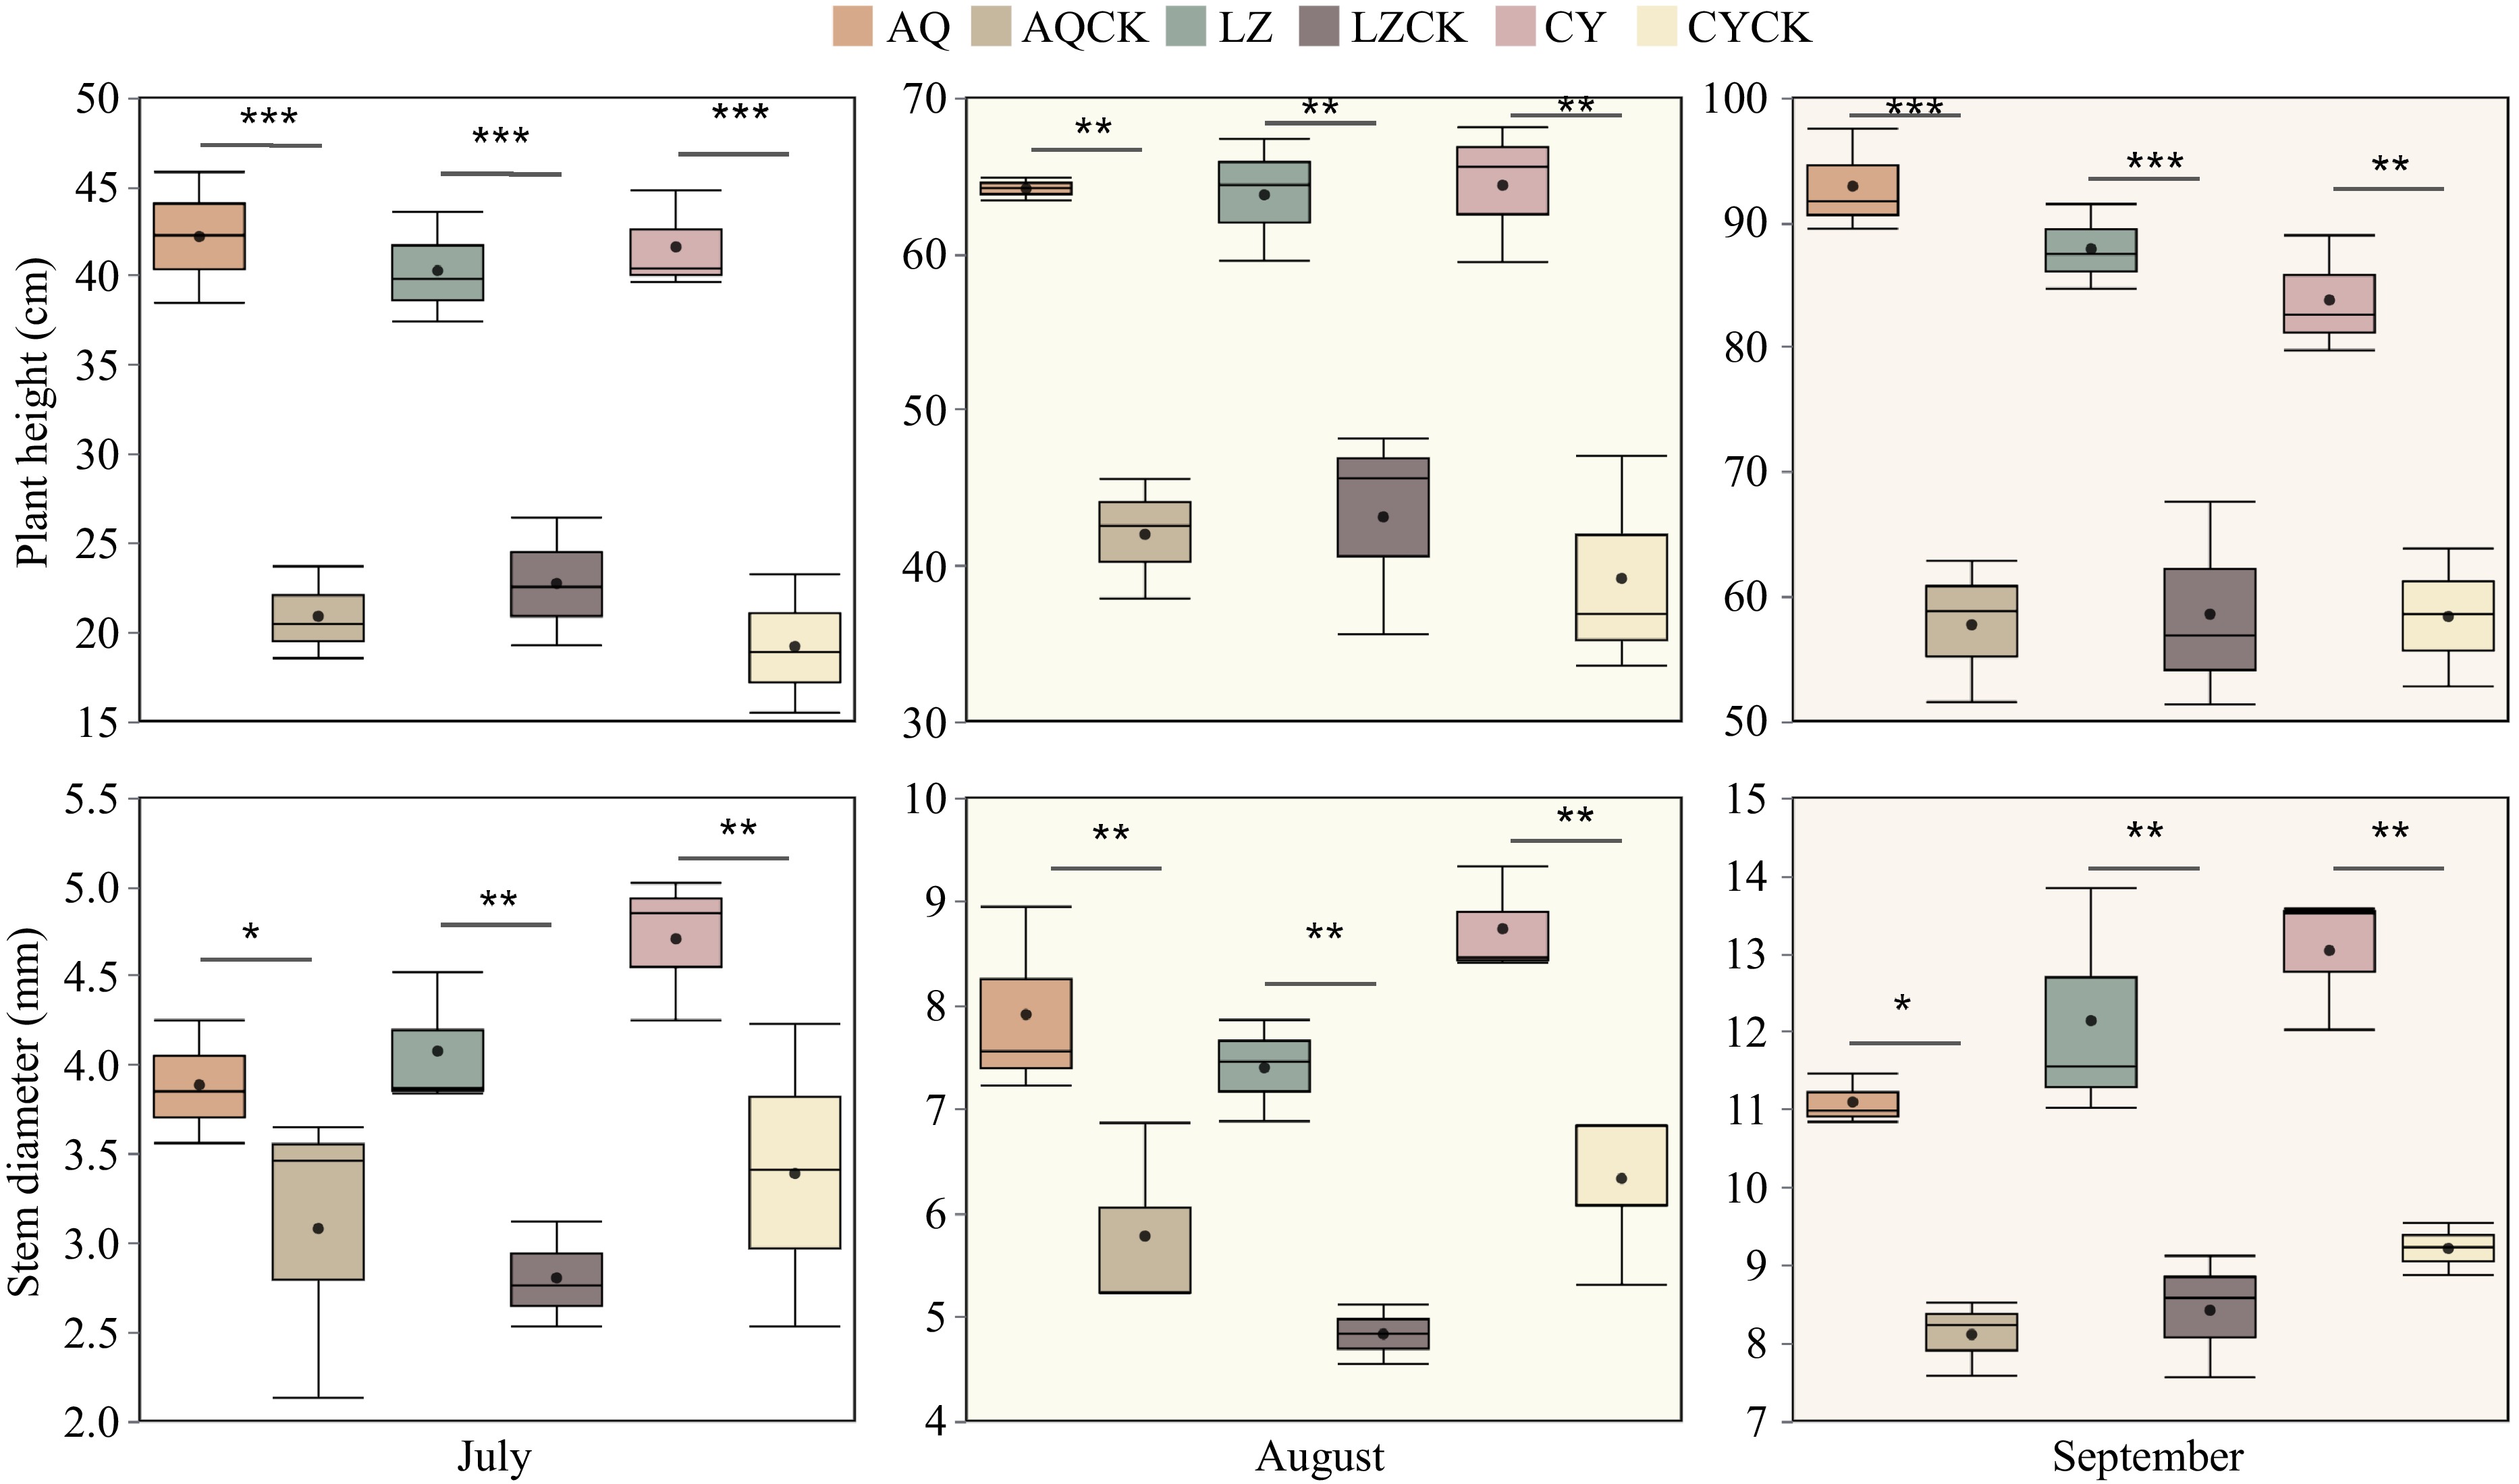
Figure 1.
Effects of continuous cropping on seedling biomass of X. sorbifolium Bunge planted in different regions. A t-test was used to determine the significant differences between the two treatment groups. Data in the box plots are expressed as mean ± SE. AQ: Untreated soil in Anqiu; AQCK: Continuous planting of X. sorbifolium Bunge in Anqiu; LZ: Untreated soil in Linzi; LZCK: Continuous planting of X. sorbifolium Bunge in Linzi; CY: Untreated soil in Changyi; CYCK: Continuous planting of X. sorbifolium Bunge in Changyi. Significant differences are presented as follows: * 0.01 ≤ p < 0.05, ** 0.001 < p ≤0.01, and *** p ≤ 0.001.
-
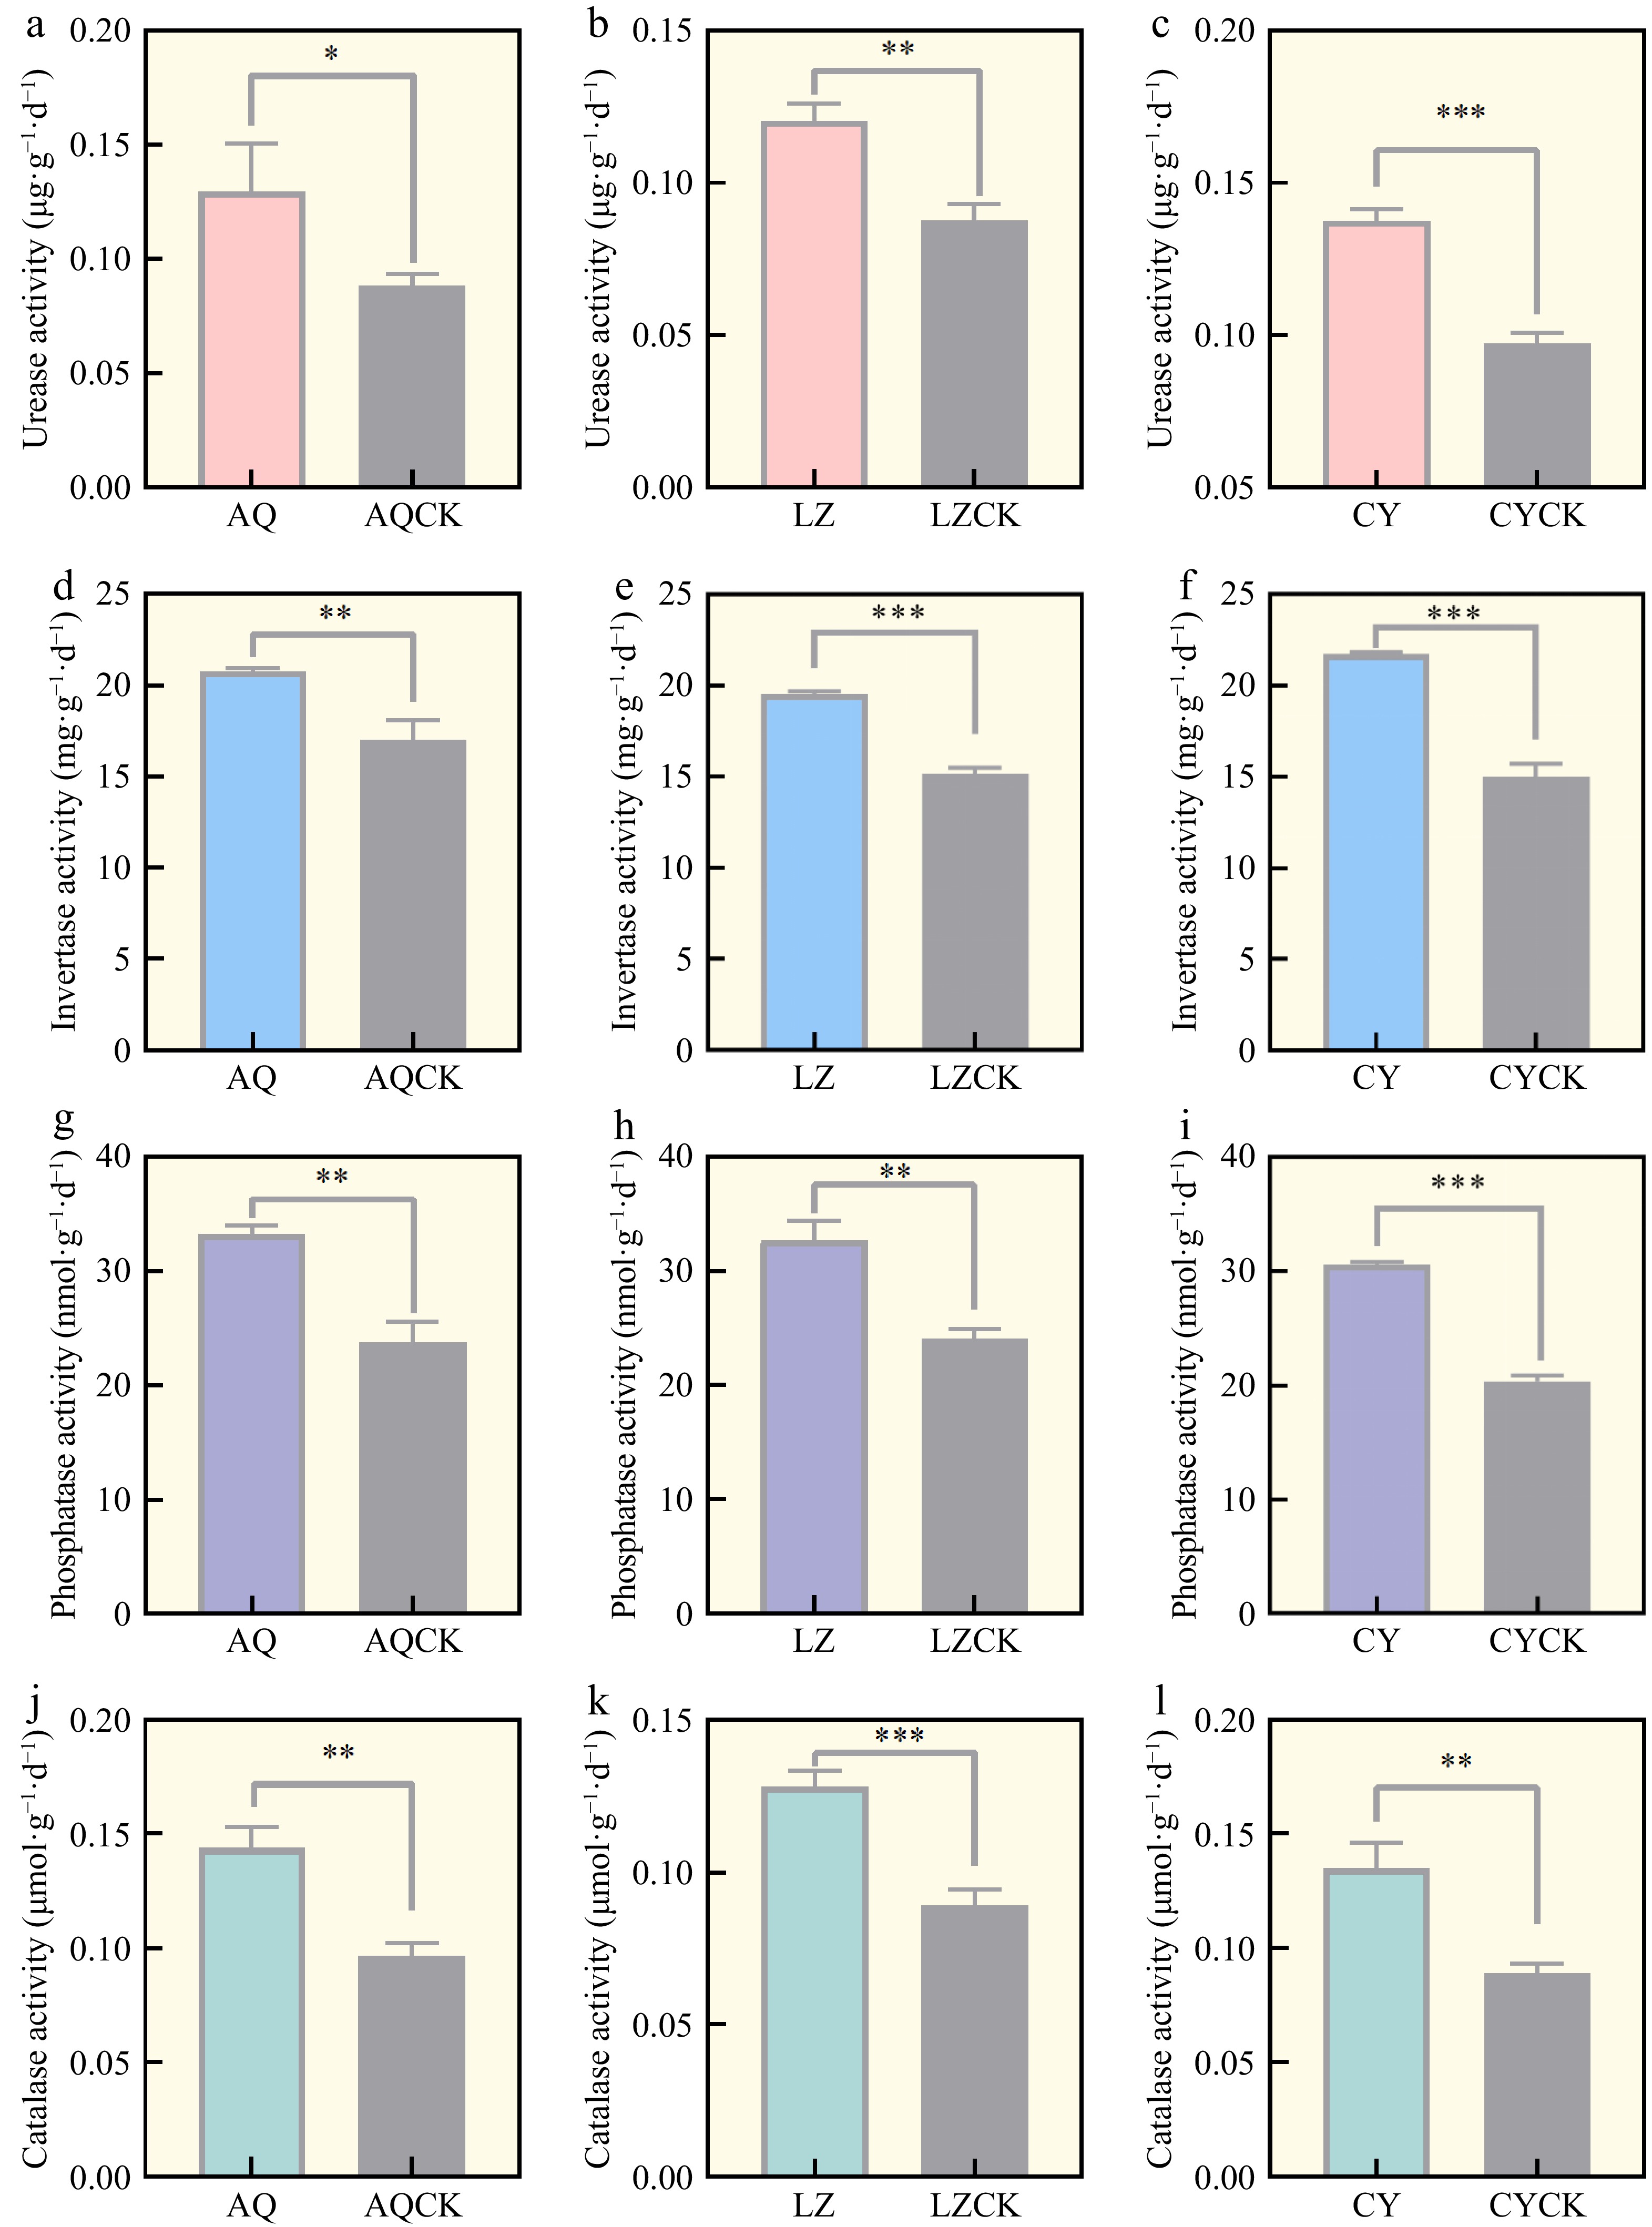
Figure 2.
Soil enzyme activities in different regions. AQ: Untreated soil in Linzi; AQCK: Continuous planting of X. sorbifolium Bunge in Linzi; LZ: Untreated soil in Cangyi; LZCK: Continuous planting of X. sorbifolium Bunge in Cangyi; CY: Untreated soil in Anqiu; CYCK: Continuous planting of X. sorbifolium Bunge in Anqiu. T-test analysis was conducted to determine the significant differences between the two treatment methods. Data are expressed as mean ± SE. Significant differences are represented as follows: * 0.01 ≤ p < 0.05, ** 0.001 < p ≤ 0.01, and *** p ≤ 0.001.
-
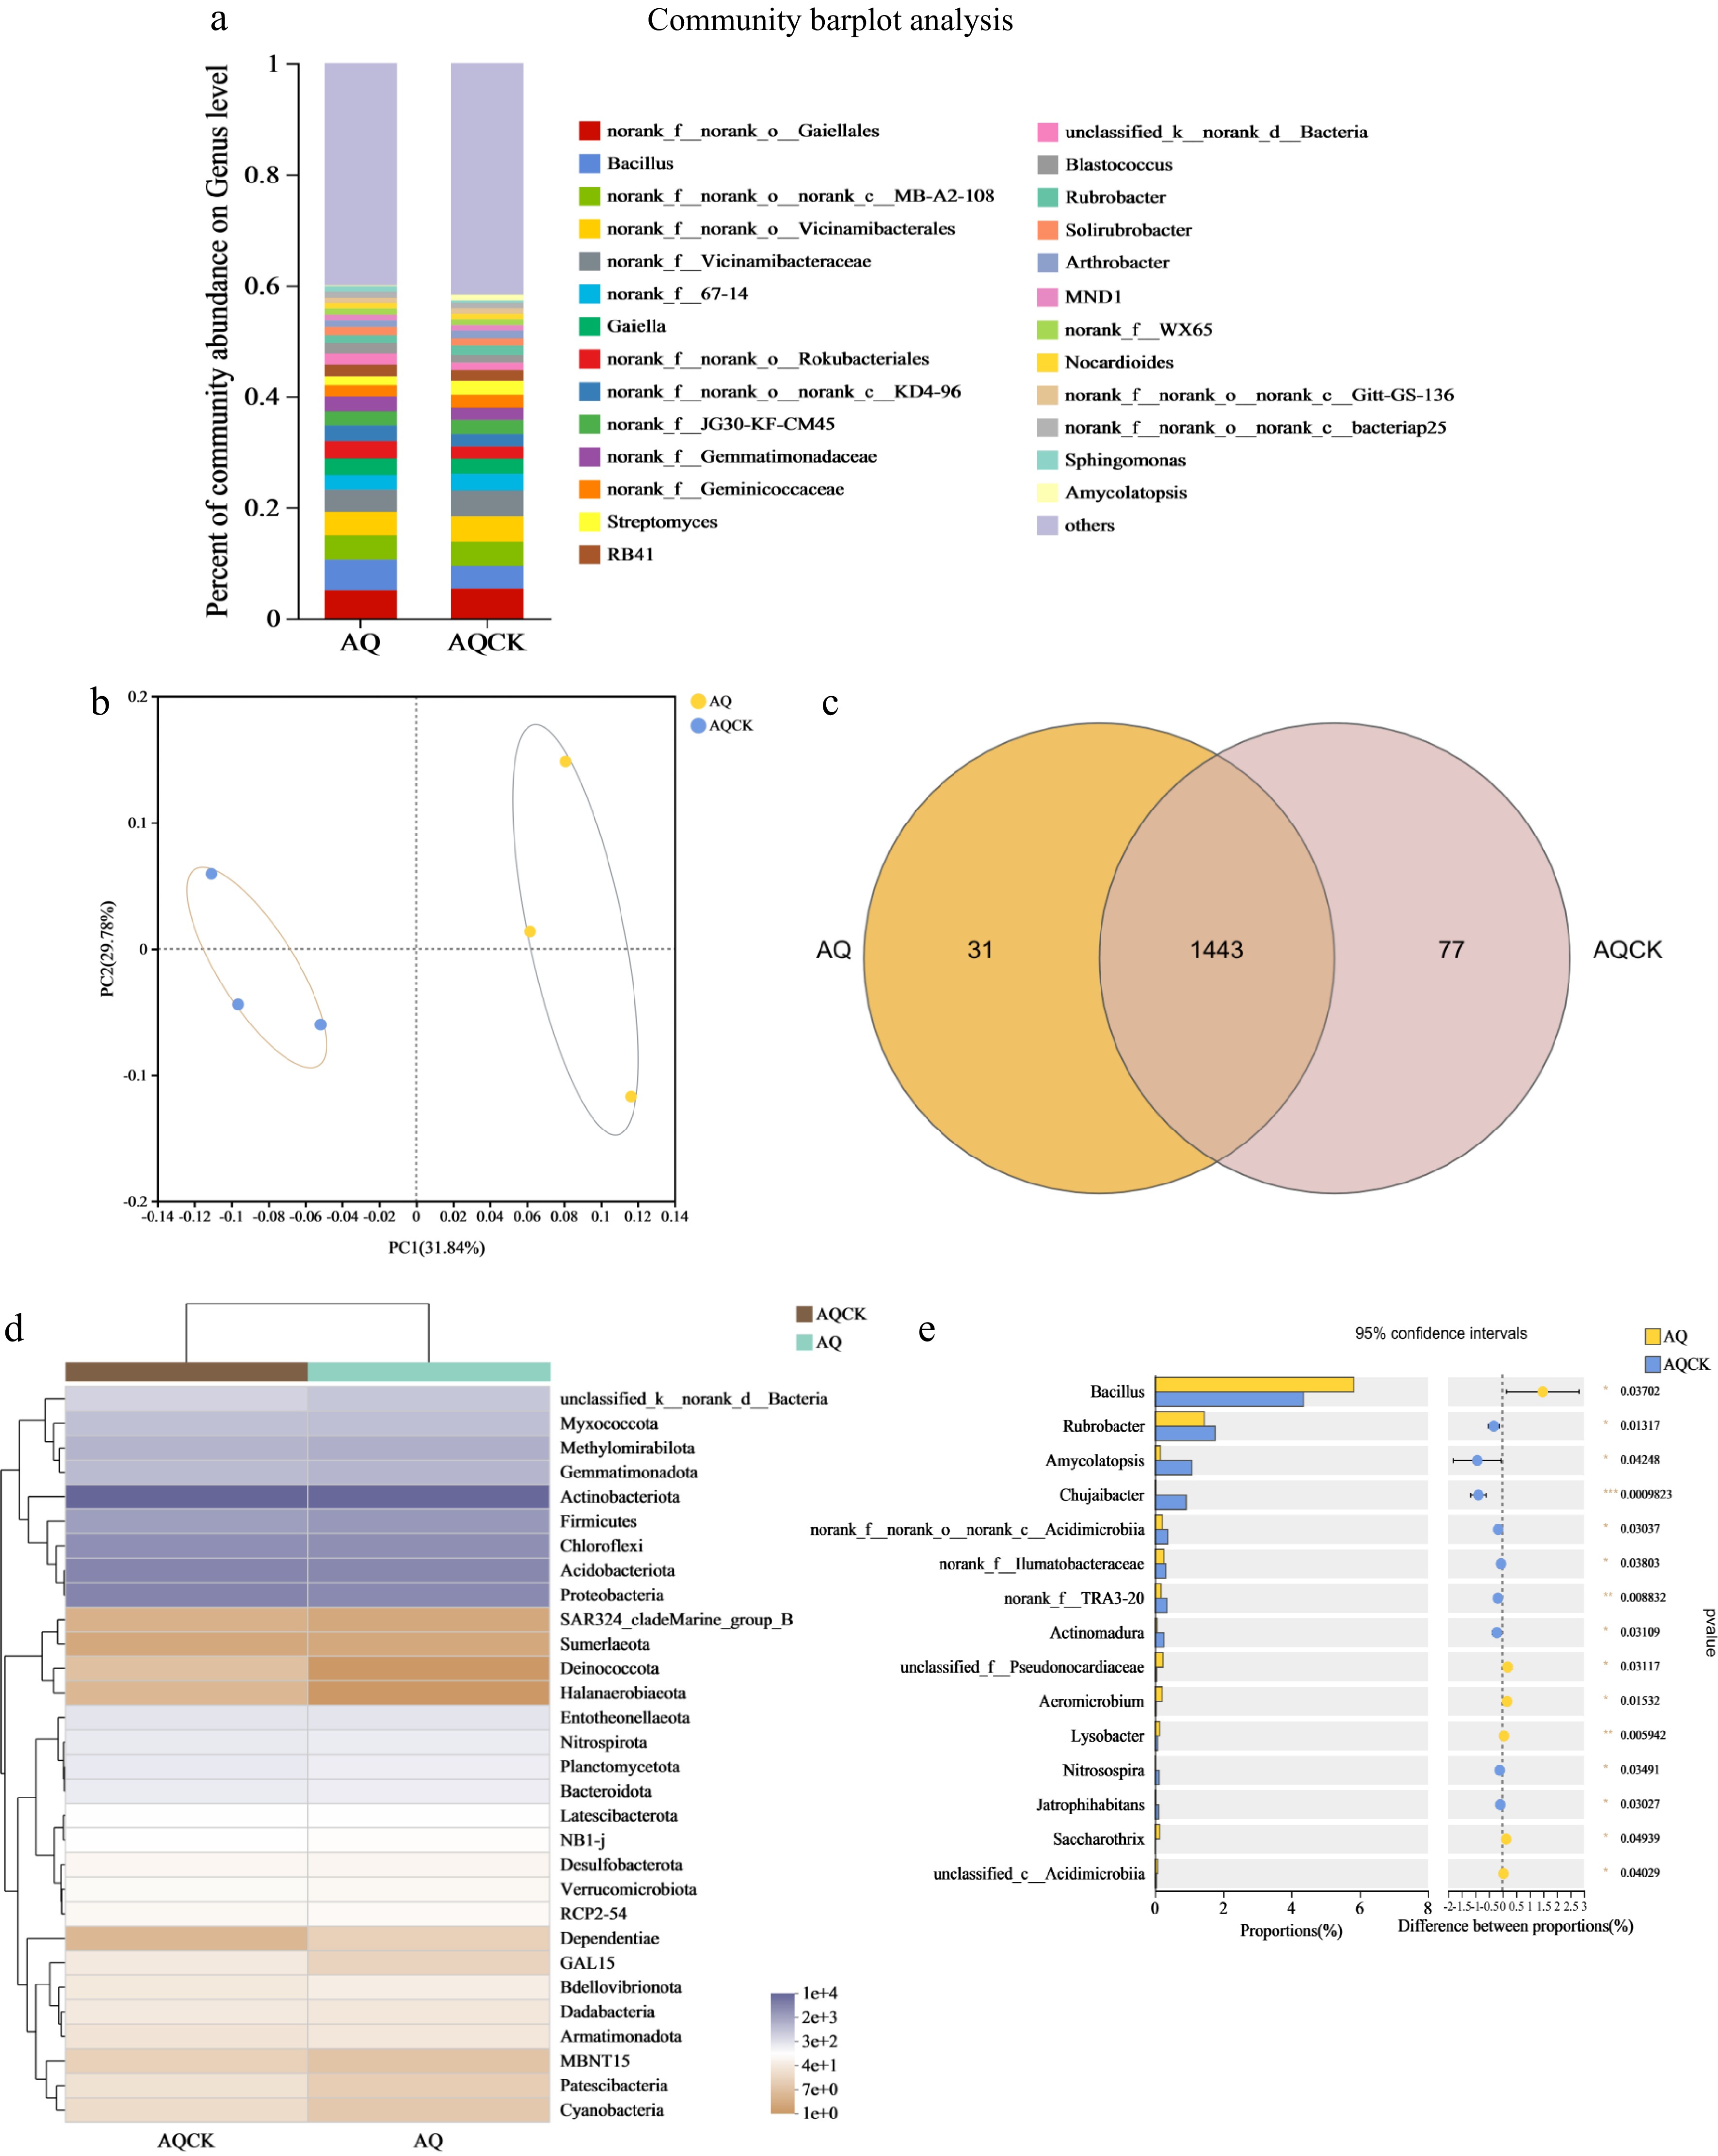
Figure 3.
Effects of continuous cropping of X. sorbifolium Bunge on soil bacterial community structure in the AQ area. (a) Horizontal abundance analysis of bacterial genera; (b) PCoA plot showing the distribution of bacteria genera; (c) Venn diagram showing the distribution of bacterial species; (d) A heat map showing the bacterial community composition; (e) Bacterial community differences at the genus level between the treatment groups. AQ: Untreated soil in Anqiu; AQCK: Continuous planting of X. sorbifolium Bunge in Anqiu.
-
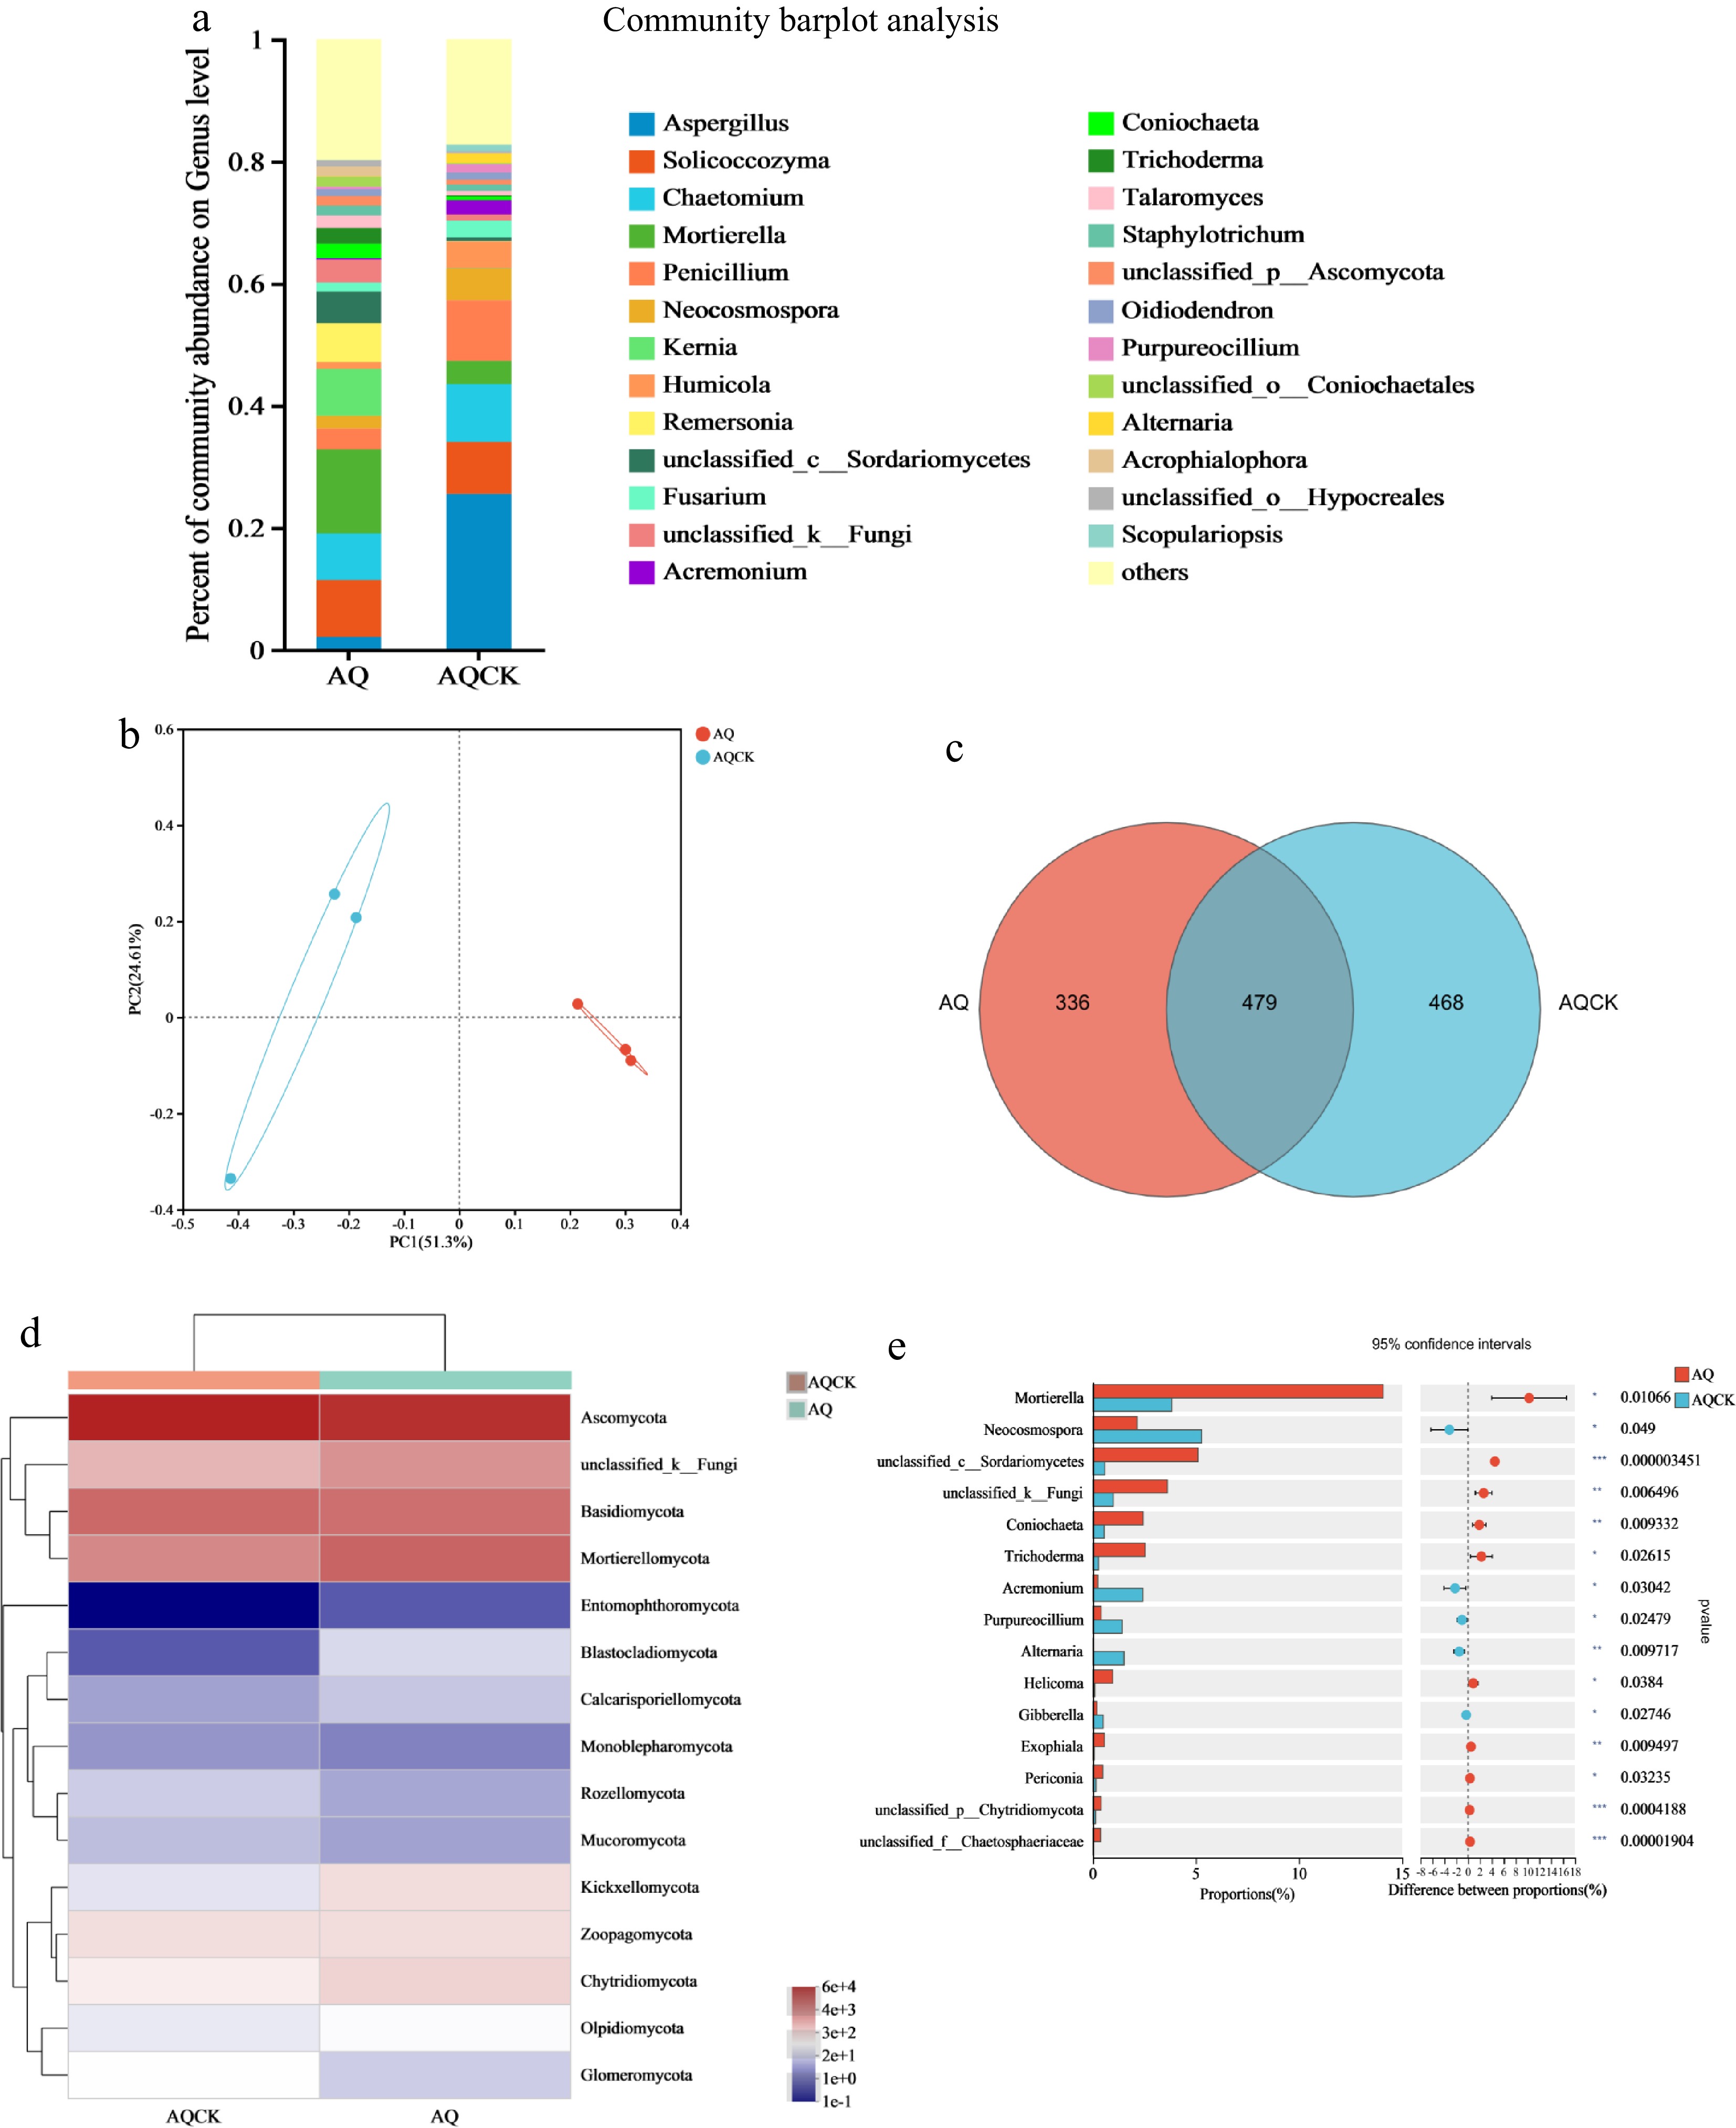
Figure 4.
Effects of continuous cropping of X. sorbifolium Bunge on soil fungal community structure in the AQ area. (a) Horizontal abundance of fungi at the genus level; (b) PCoA plot illustrating fungi distribution under the two treatments; (c) Venn diagram showing the distribution of fungal OTU species; (d) A heat map showing fungal community composition; (e) Differences in the fungal horizontal community between the two treatment groups. AQ: Untreated soil in Anqiu; AQCK: Continuous planting of X. sorbifolium Bunge in Anqiu.
-
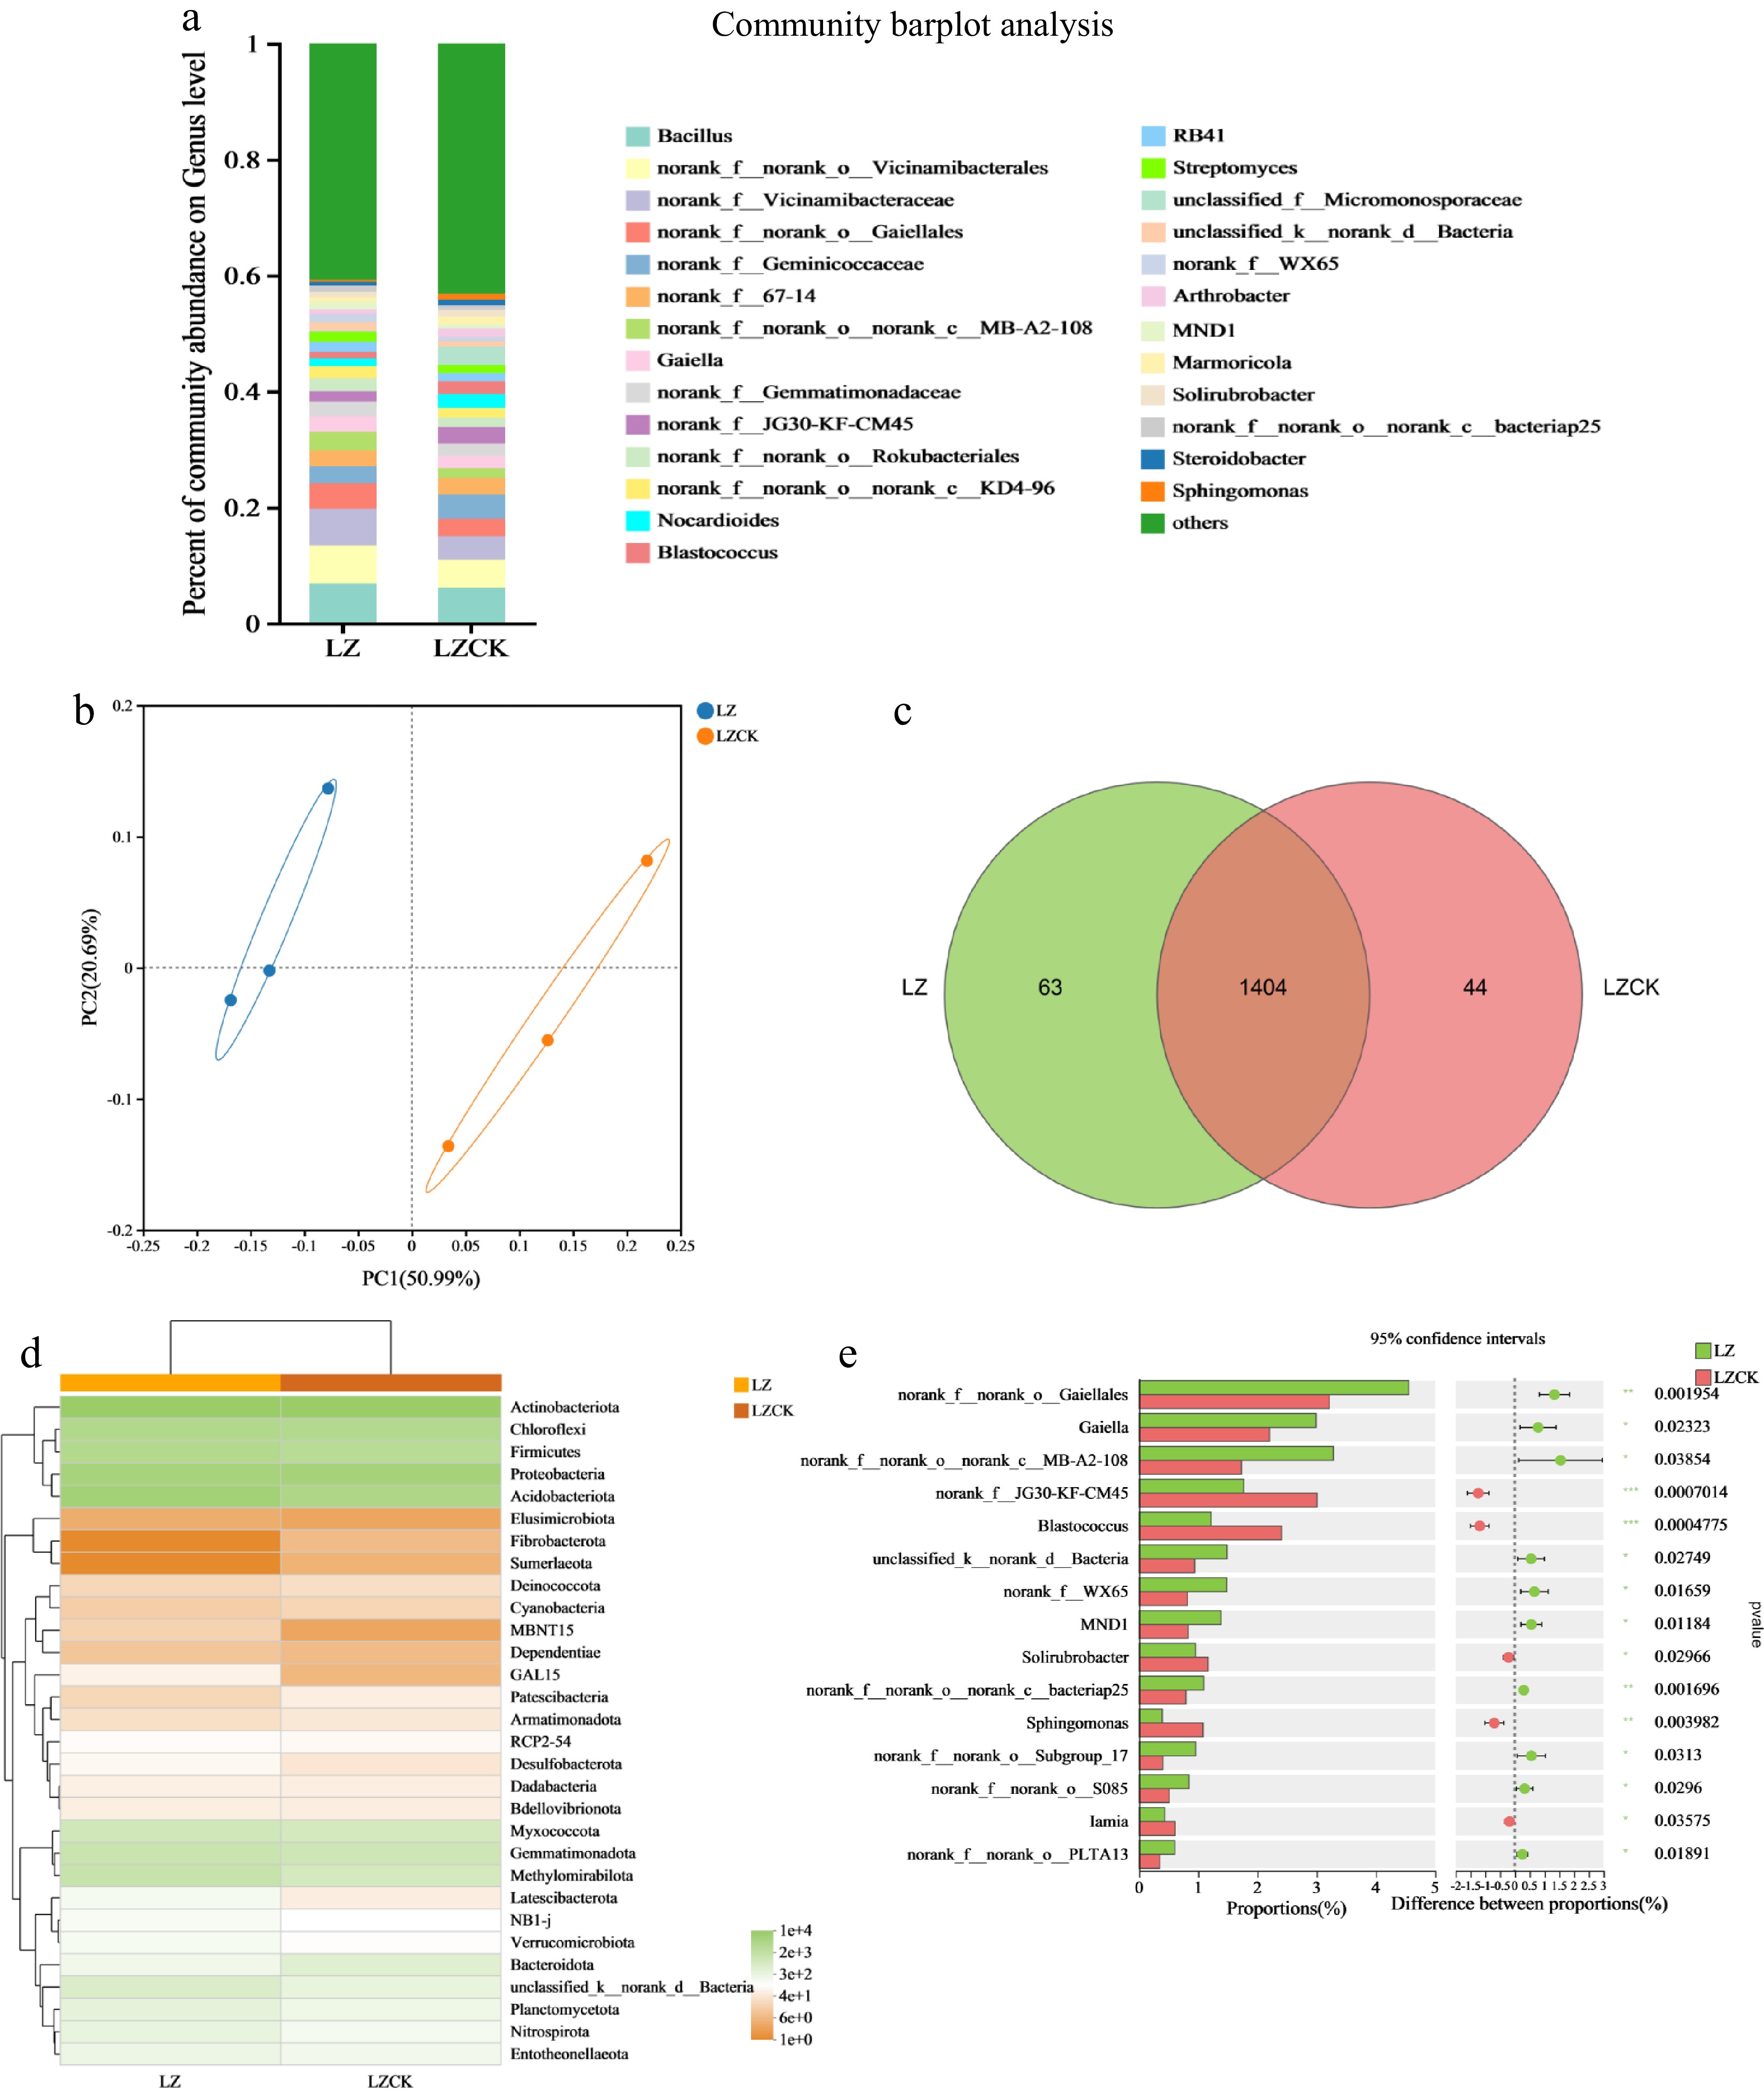
Figure 5.
Effect of continuous cropping of X. sorbifolium Bunge on soil bacterial community structure in the LZ area. (a) Horizontal abundance of bacterial genera; (b) Bacterial PCoA illustrating the distribution of bacteria genera under the two treatments; (c) Venn diagram analysis showing differences in bacterial species under the two treatments; (d) A heat map showing bacterial community composition under the two treatments; (e) Community differences at the bacterial genus level between the two groups. LZ: Untreated soil in Linzi; LZCK: Continuous planting of X. sorbifolium Bunge in Linzi.
-
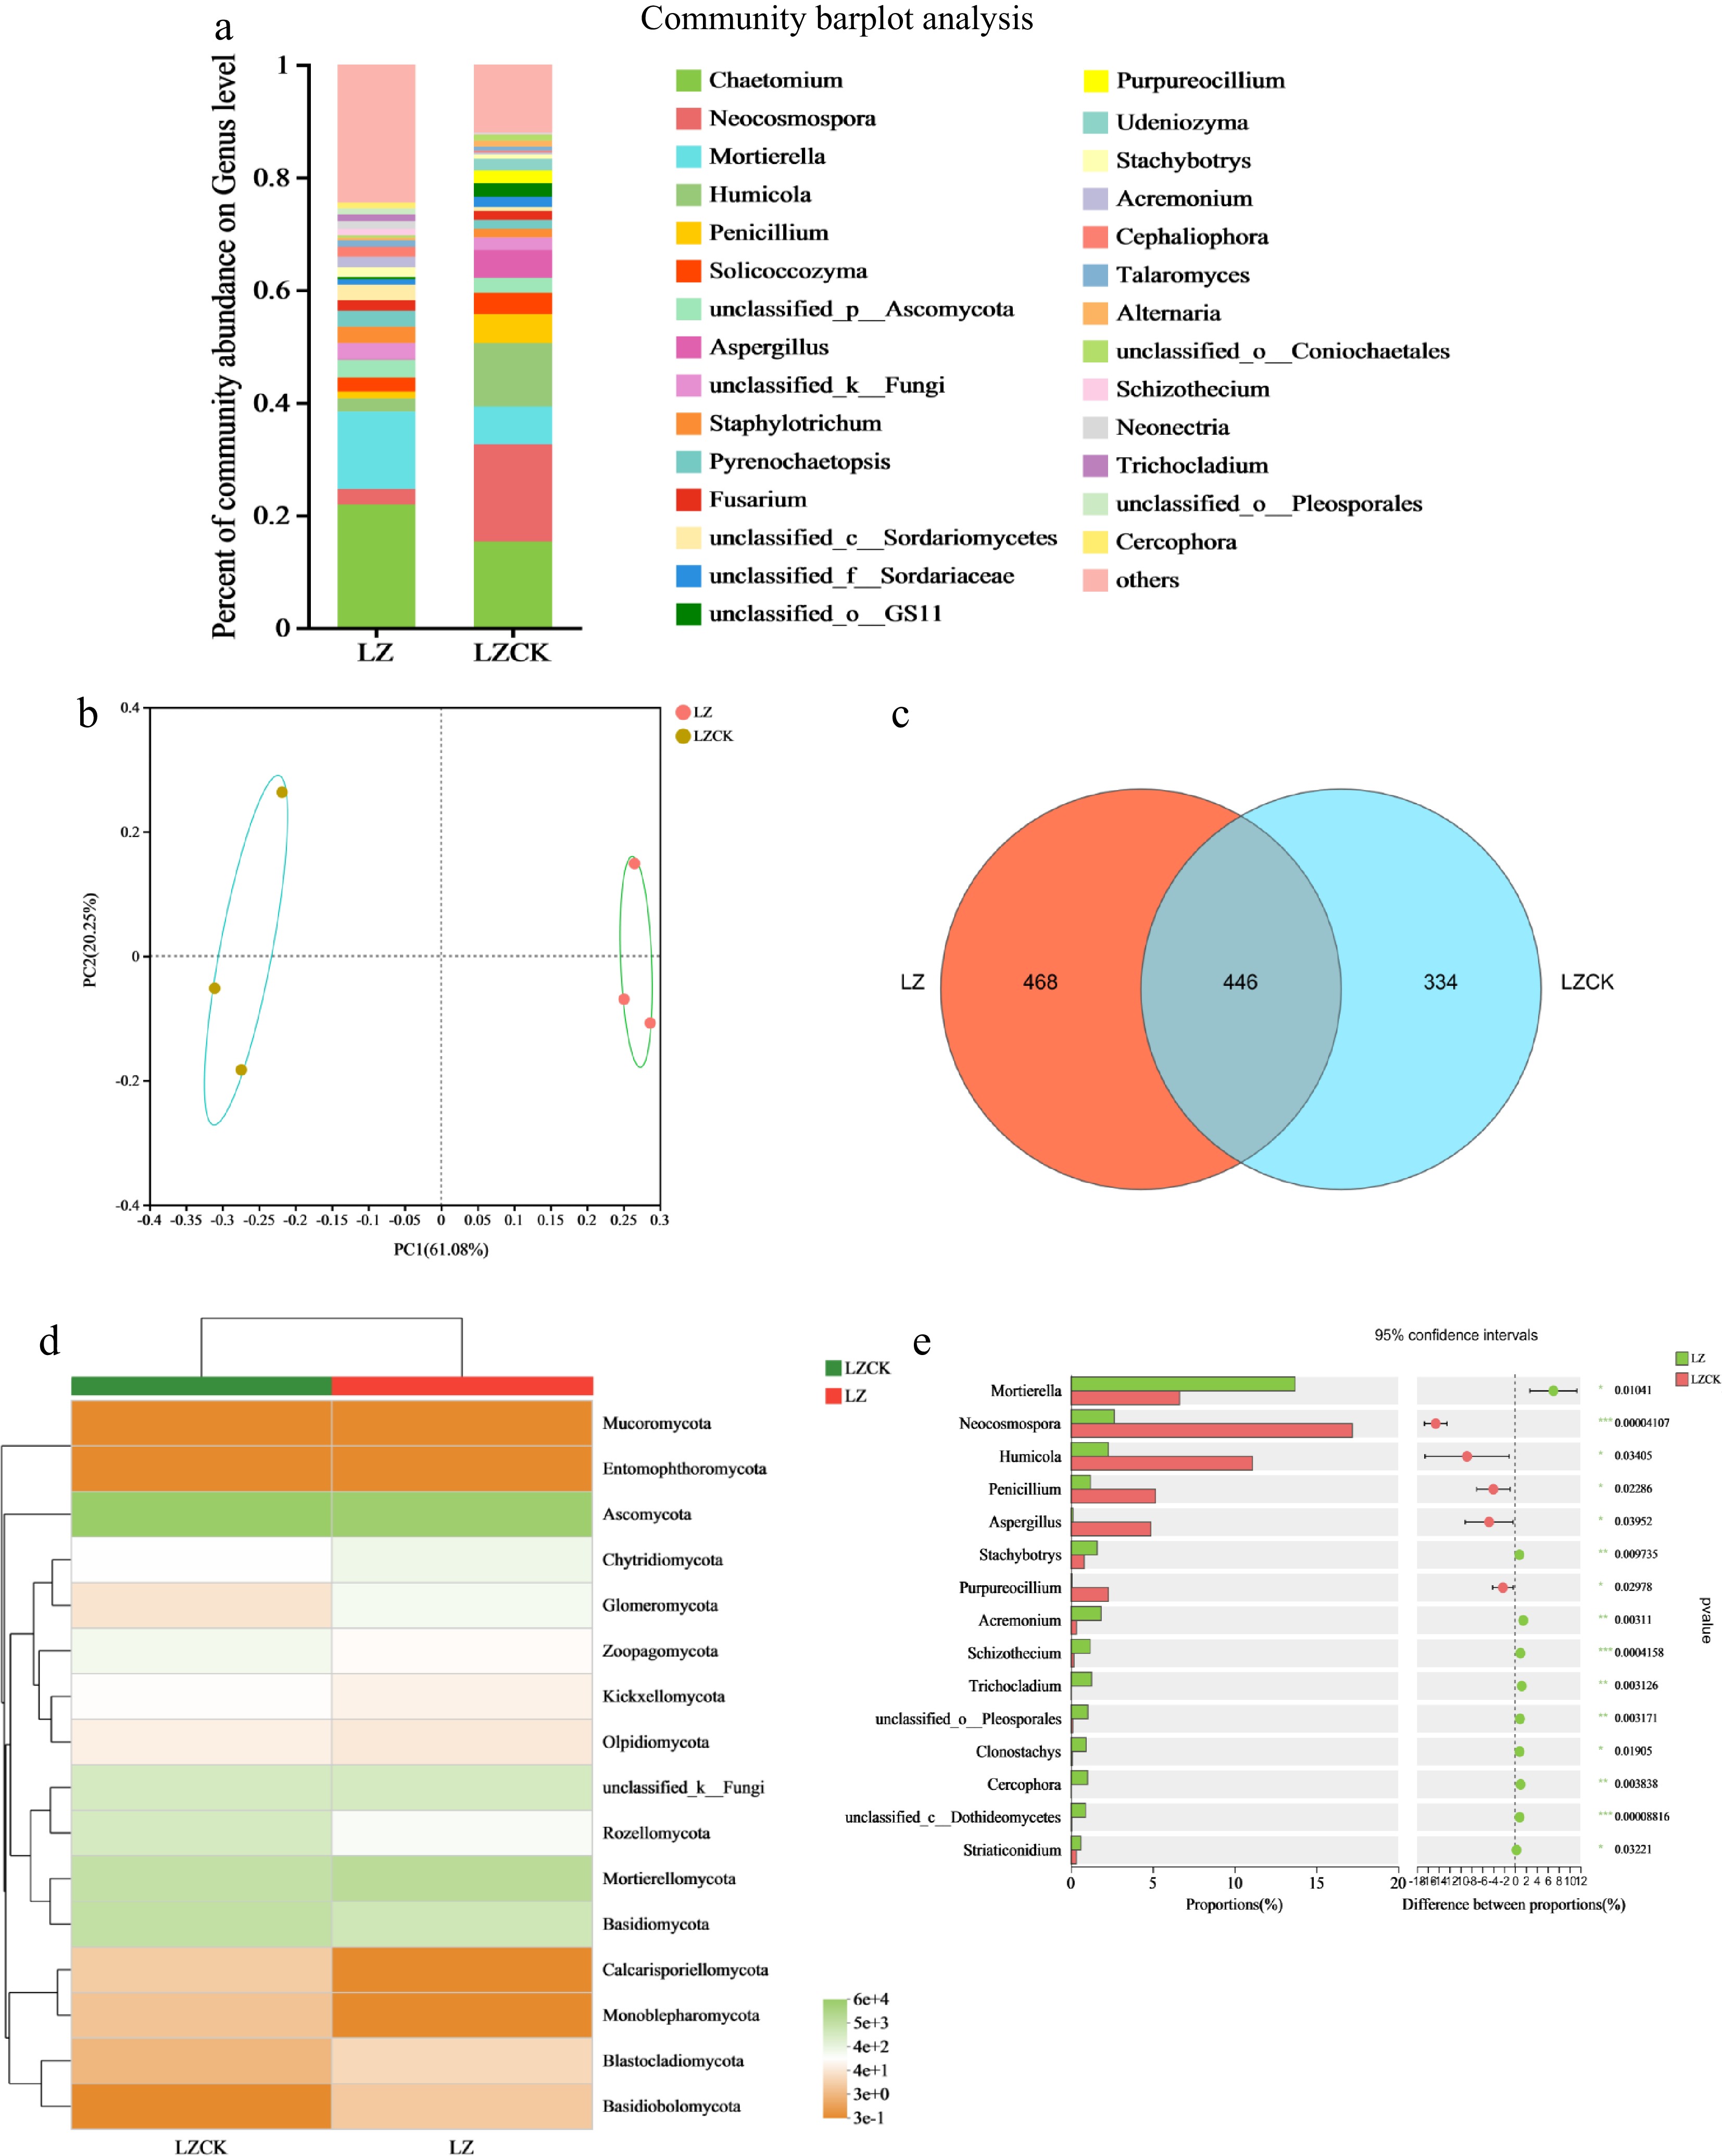
Figure 6.
Effects of continuous cropping of X. sorbifolium Bunge on soil fungal community structure in the LZ area. (a) Horizontal abundance of fungi at the genus level; (b) PCoA showing fungal distribution; (c) Venn diagram analysis of fungal OTU species; (d) A heat map showing fungal community composition under the two treatments; (e) Differences in fungal horizontal community between two treatment groups. LZ: Untreated soil in Linzi; LZCK: Continuous planting of X. sorbifolium Bunge in Linzi.
-
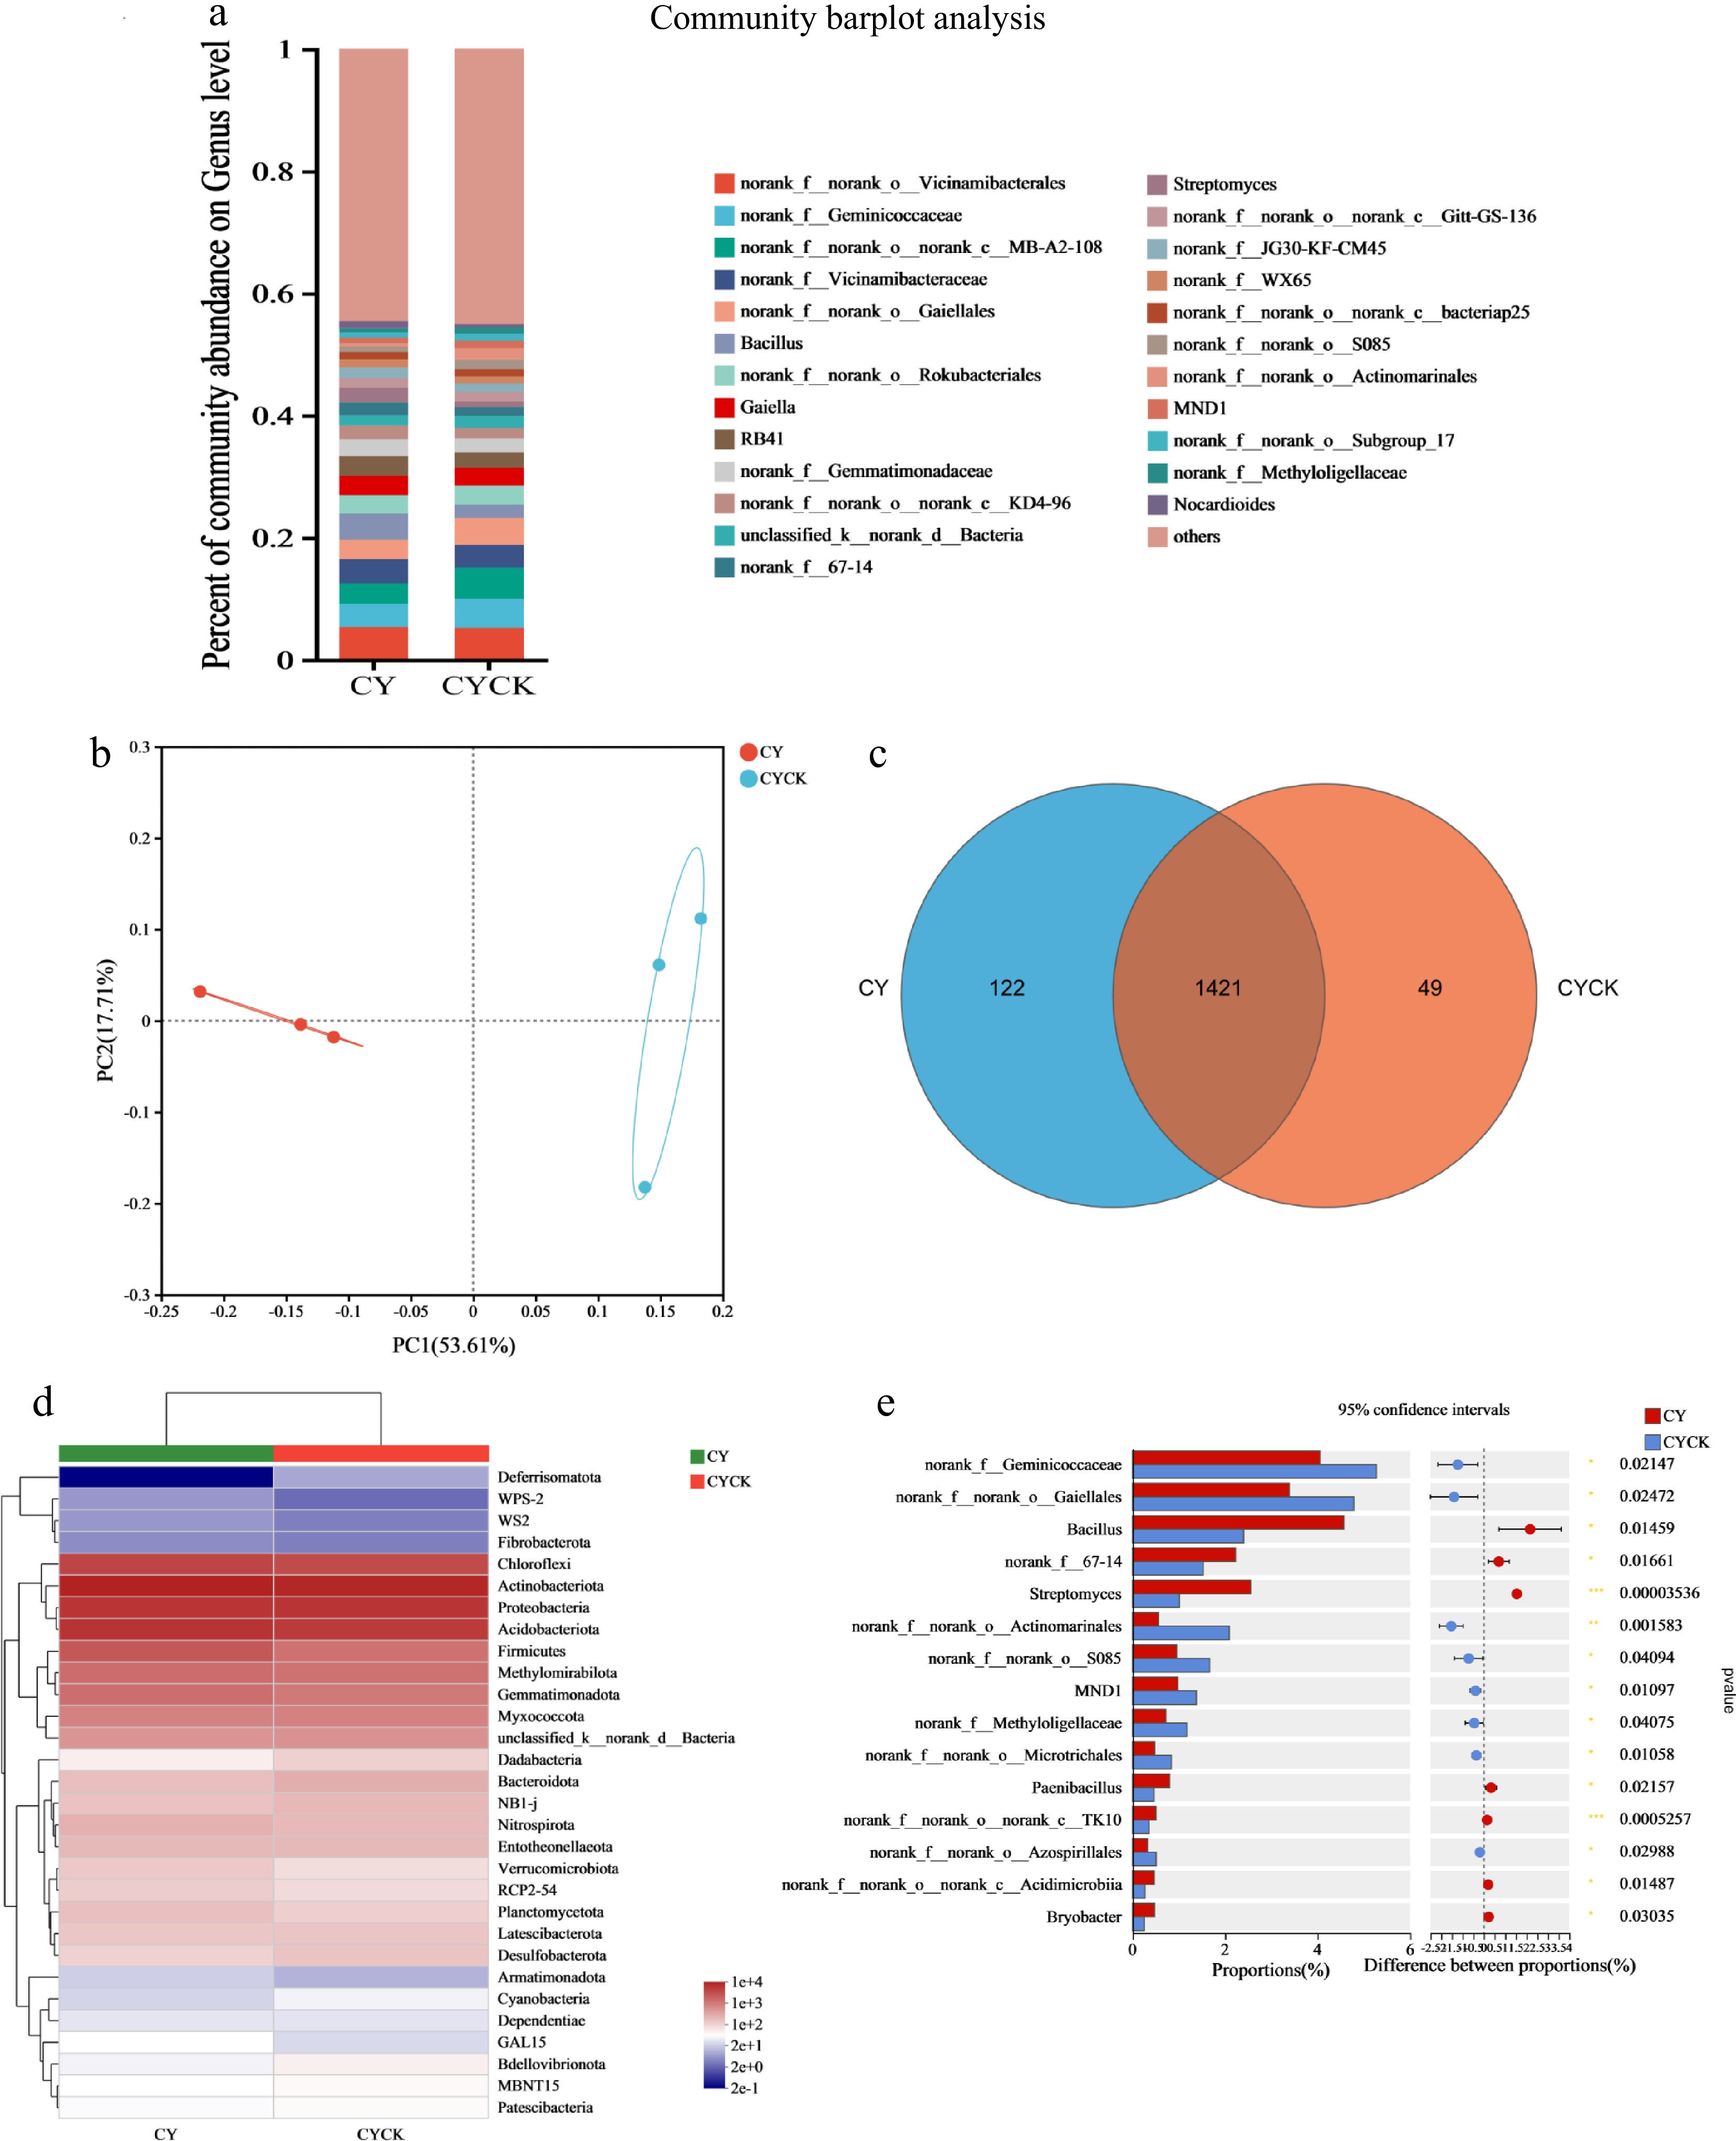
Figure 7.
Effect of continuous cropping of X. sorbifolia Bunge on soil bacterial community structure in the CY area. (a) Horizontal abundance and distribution of bacterial genera; (b) PCoA plot showing bacterial distribution under the two treatments; (c) Venn diagram analysis of bacterial species distribution; (d) A heat map showing bacterial community composition; (e) Community differences at the bacterial genus level between the two treatment groups. CY: Untreated soil in Changyi; CYCK: Continuous planting of X. sorbifolium Bunge in Changyi.
-
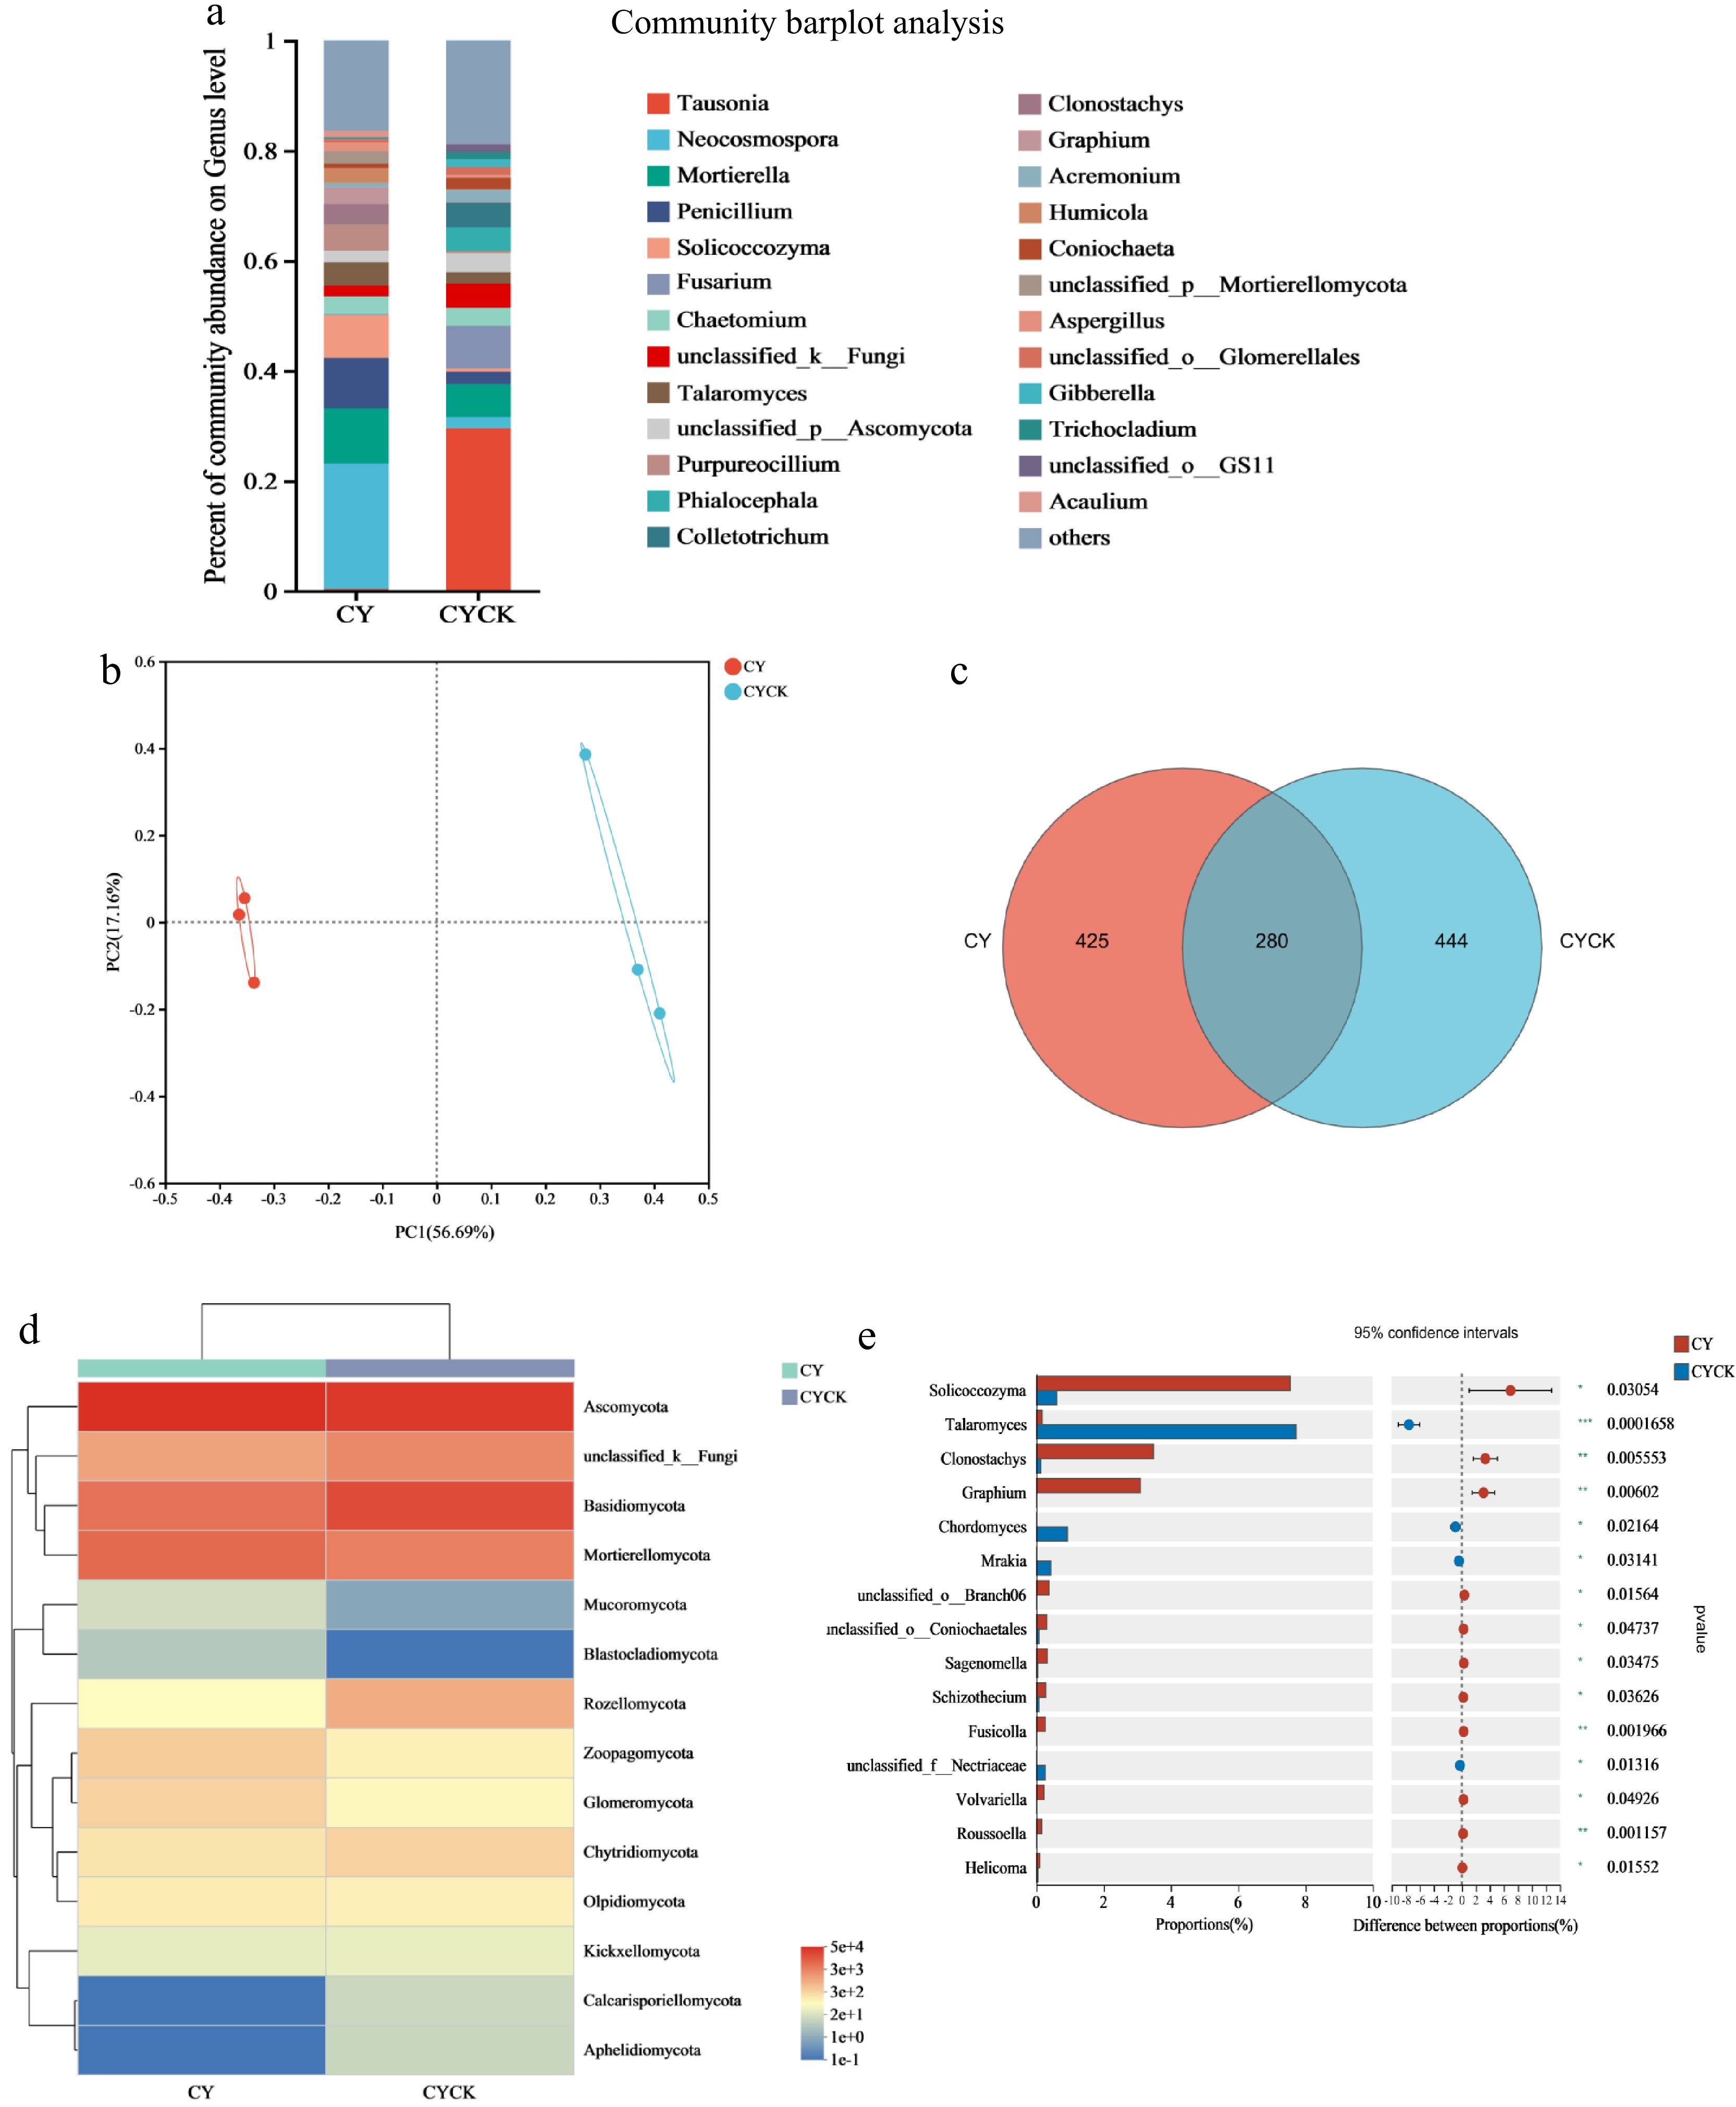
Figure 8.
Effects of continuous cropping of X. sorbifolium Bunge on soil fungal community structure in CY area. (a) Relative abundance of fungi under the two treatments; (b) PCoA plot showing the fungal distribution under the two treatments; (c) Venn diagram showing the distribution of fungal OTU species; (d) A heat map showing fungal community composition in the two groups; (e) Differences in the fungal horizontal community between the two treatment groups. CY: Untreated soil in Changyi; CYCK: Continuous planting of X. sorbifolium Bunge in Changyi.
-
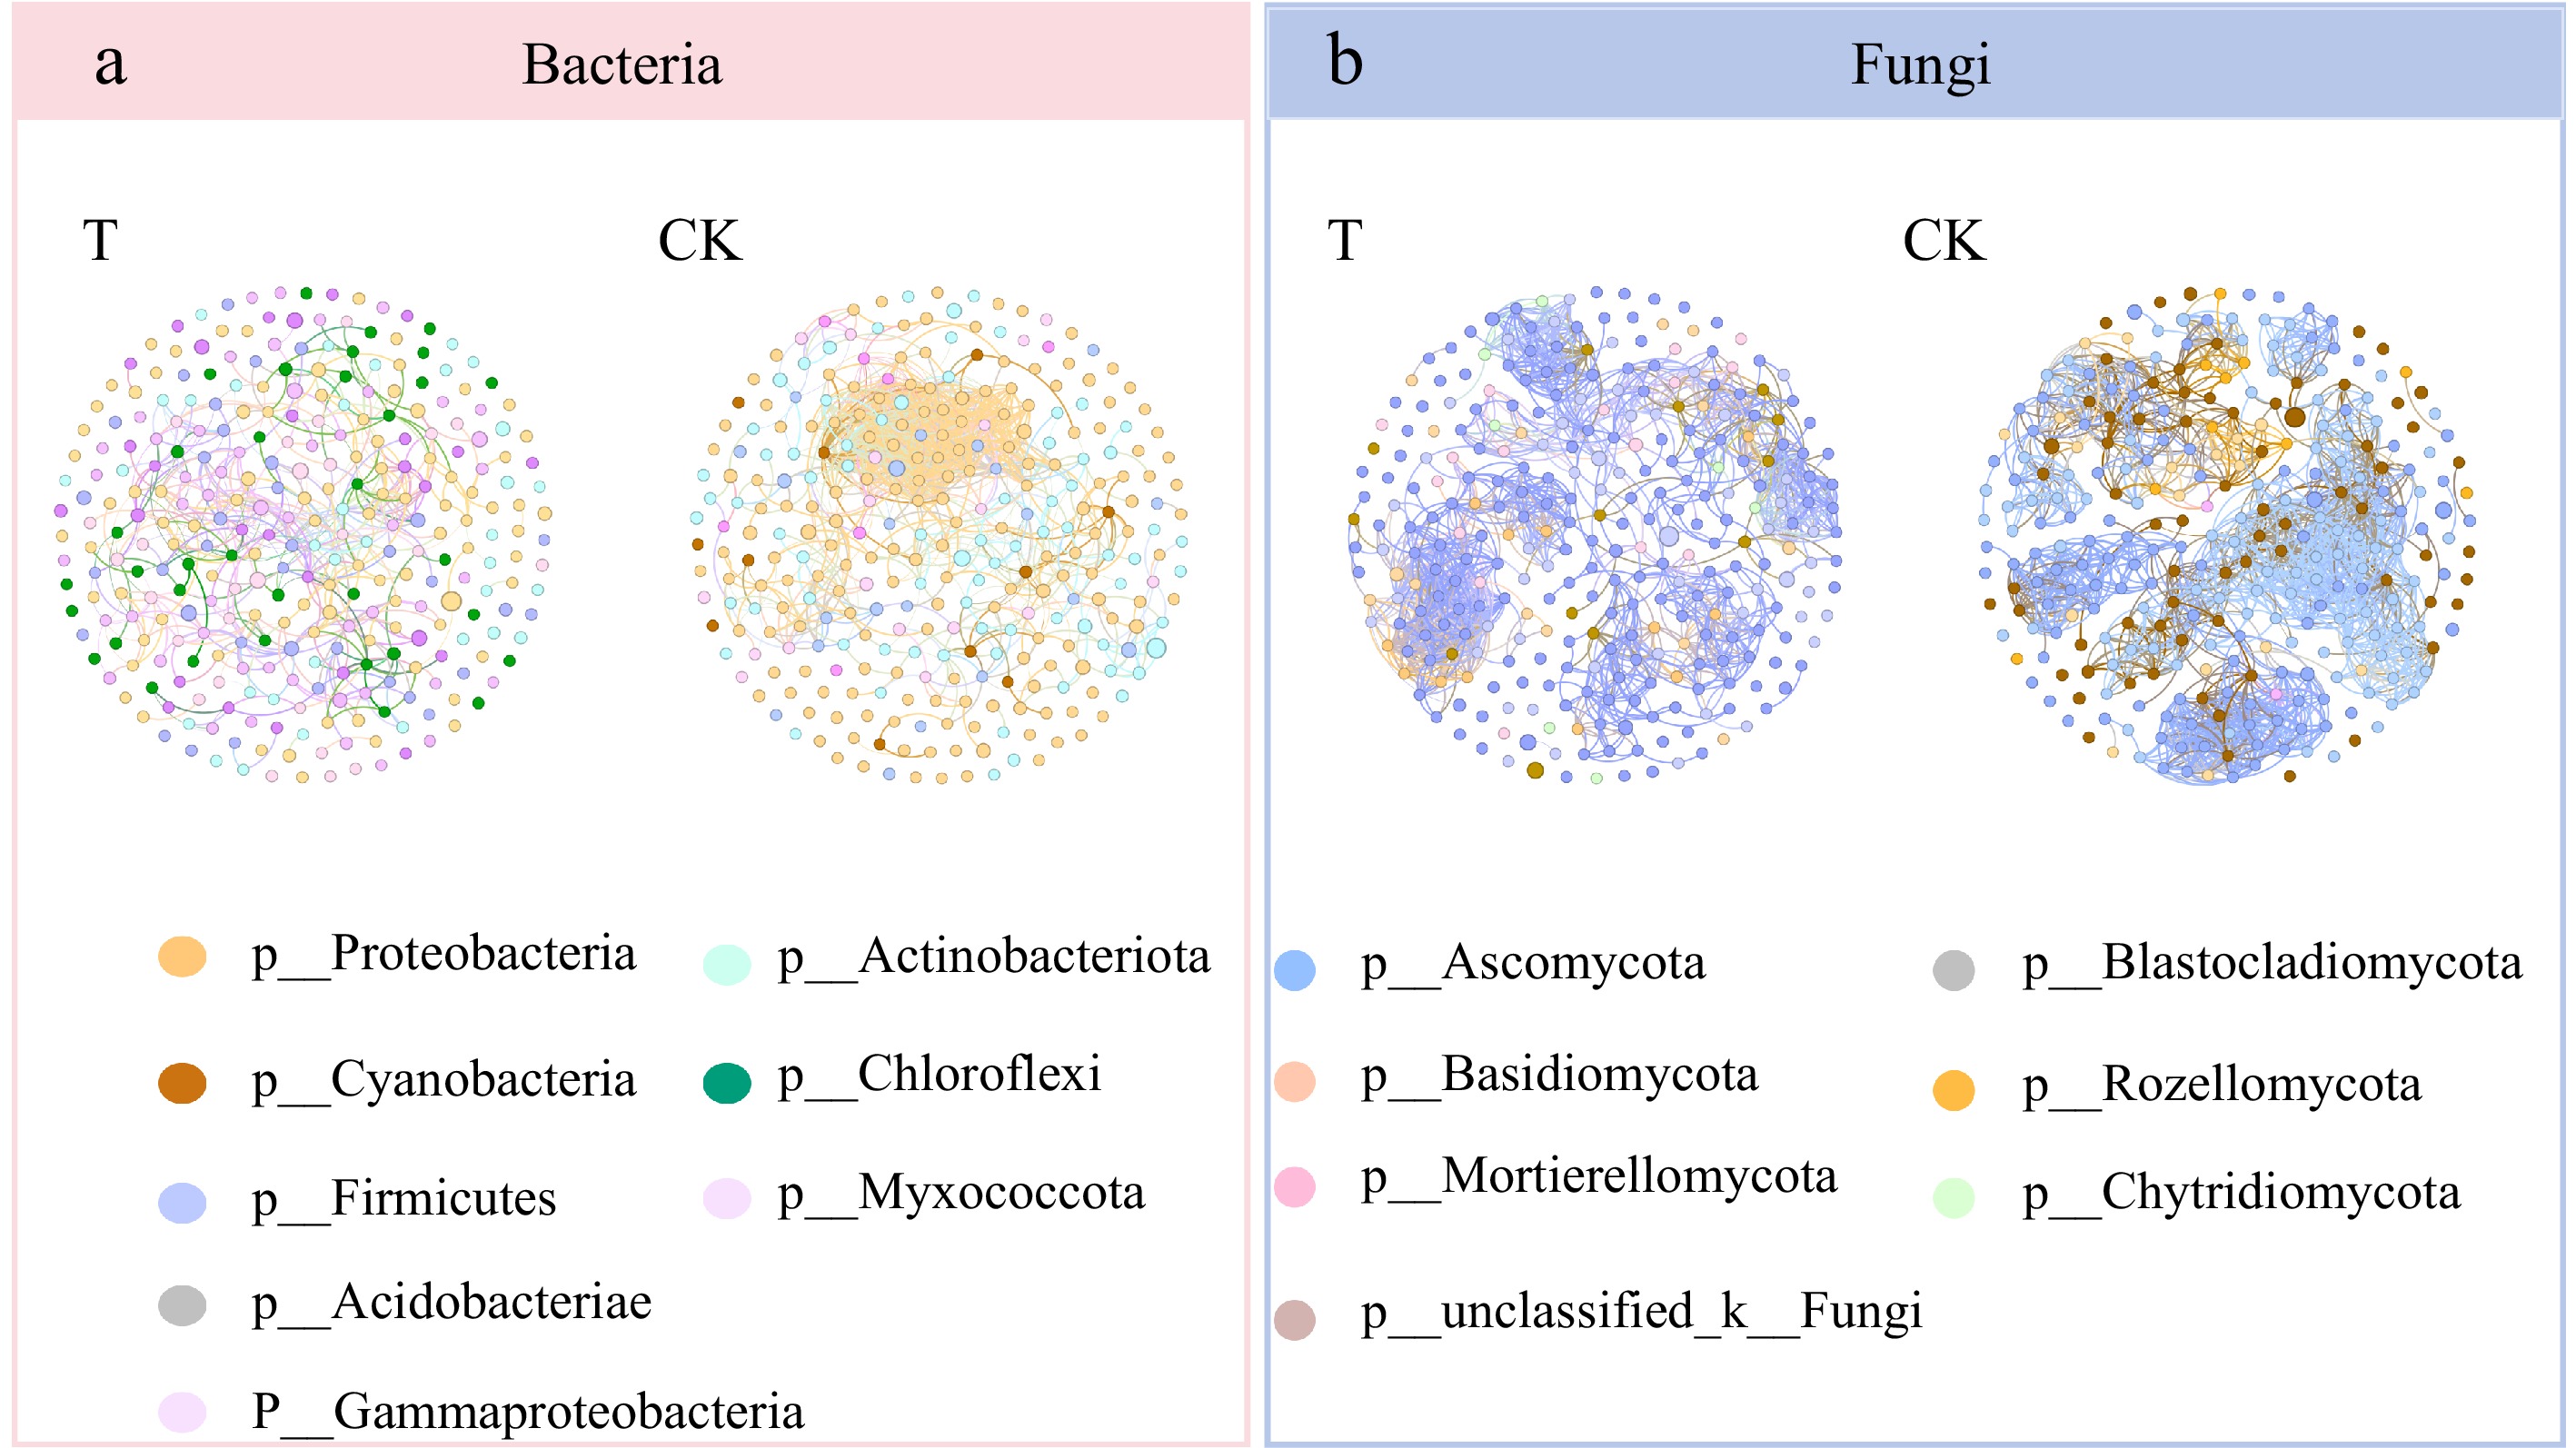
Figure 9.
Soil microbial OTU co-occurrence network ((a) bacteria, (b) fungi) for the continuously cropped X. sorbifolium Bunge based on Spearman's coefficient. Each point represents a genus, the color indicates the bacterial or fungal phylum, and the size of the point represents the relative abundance. T: Untreated soil; CK: Continuous planting of X. sorbifolium Bunge. Species information with an absolute value of correlation coefficient greater than or equal to 0.6, p < 0.05 for the two treatment conditions is displayed.
-
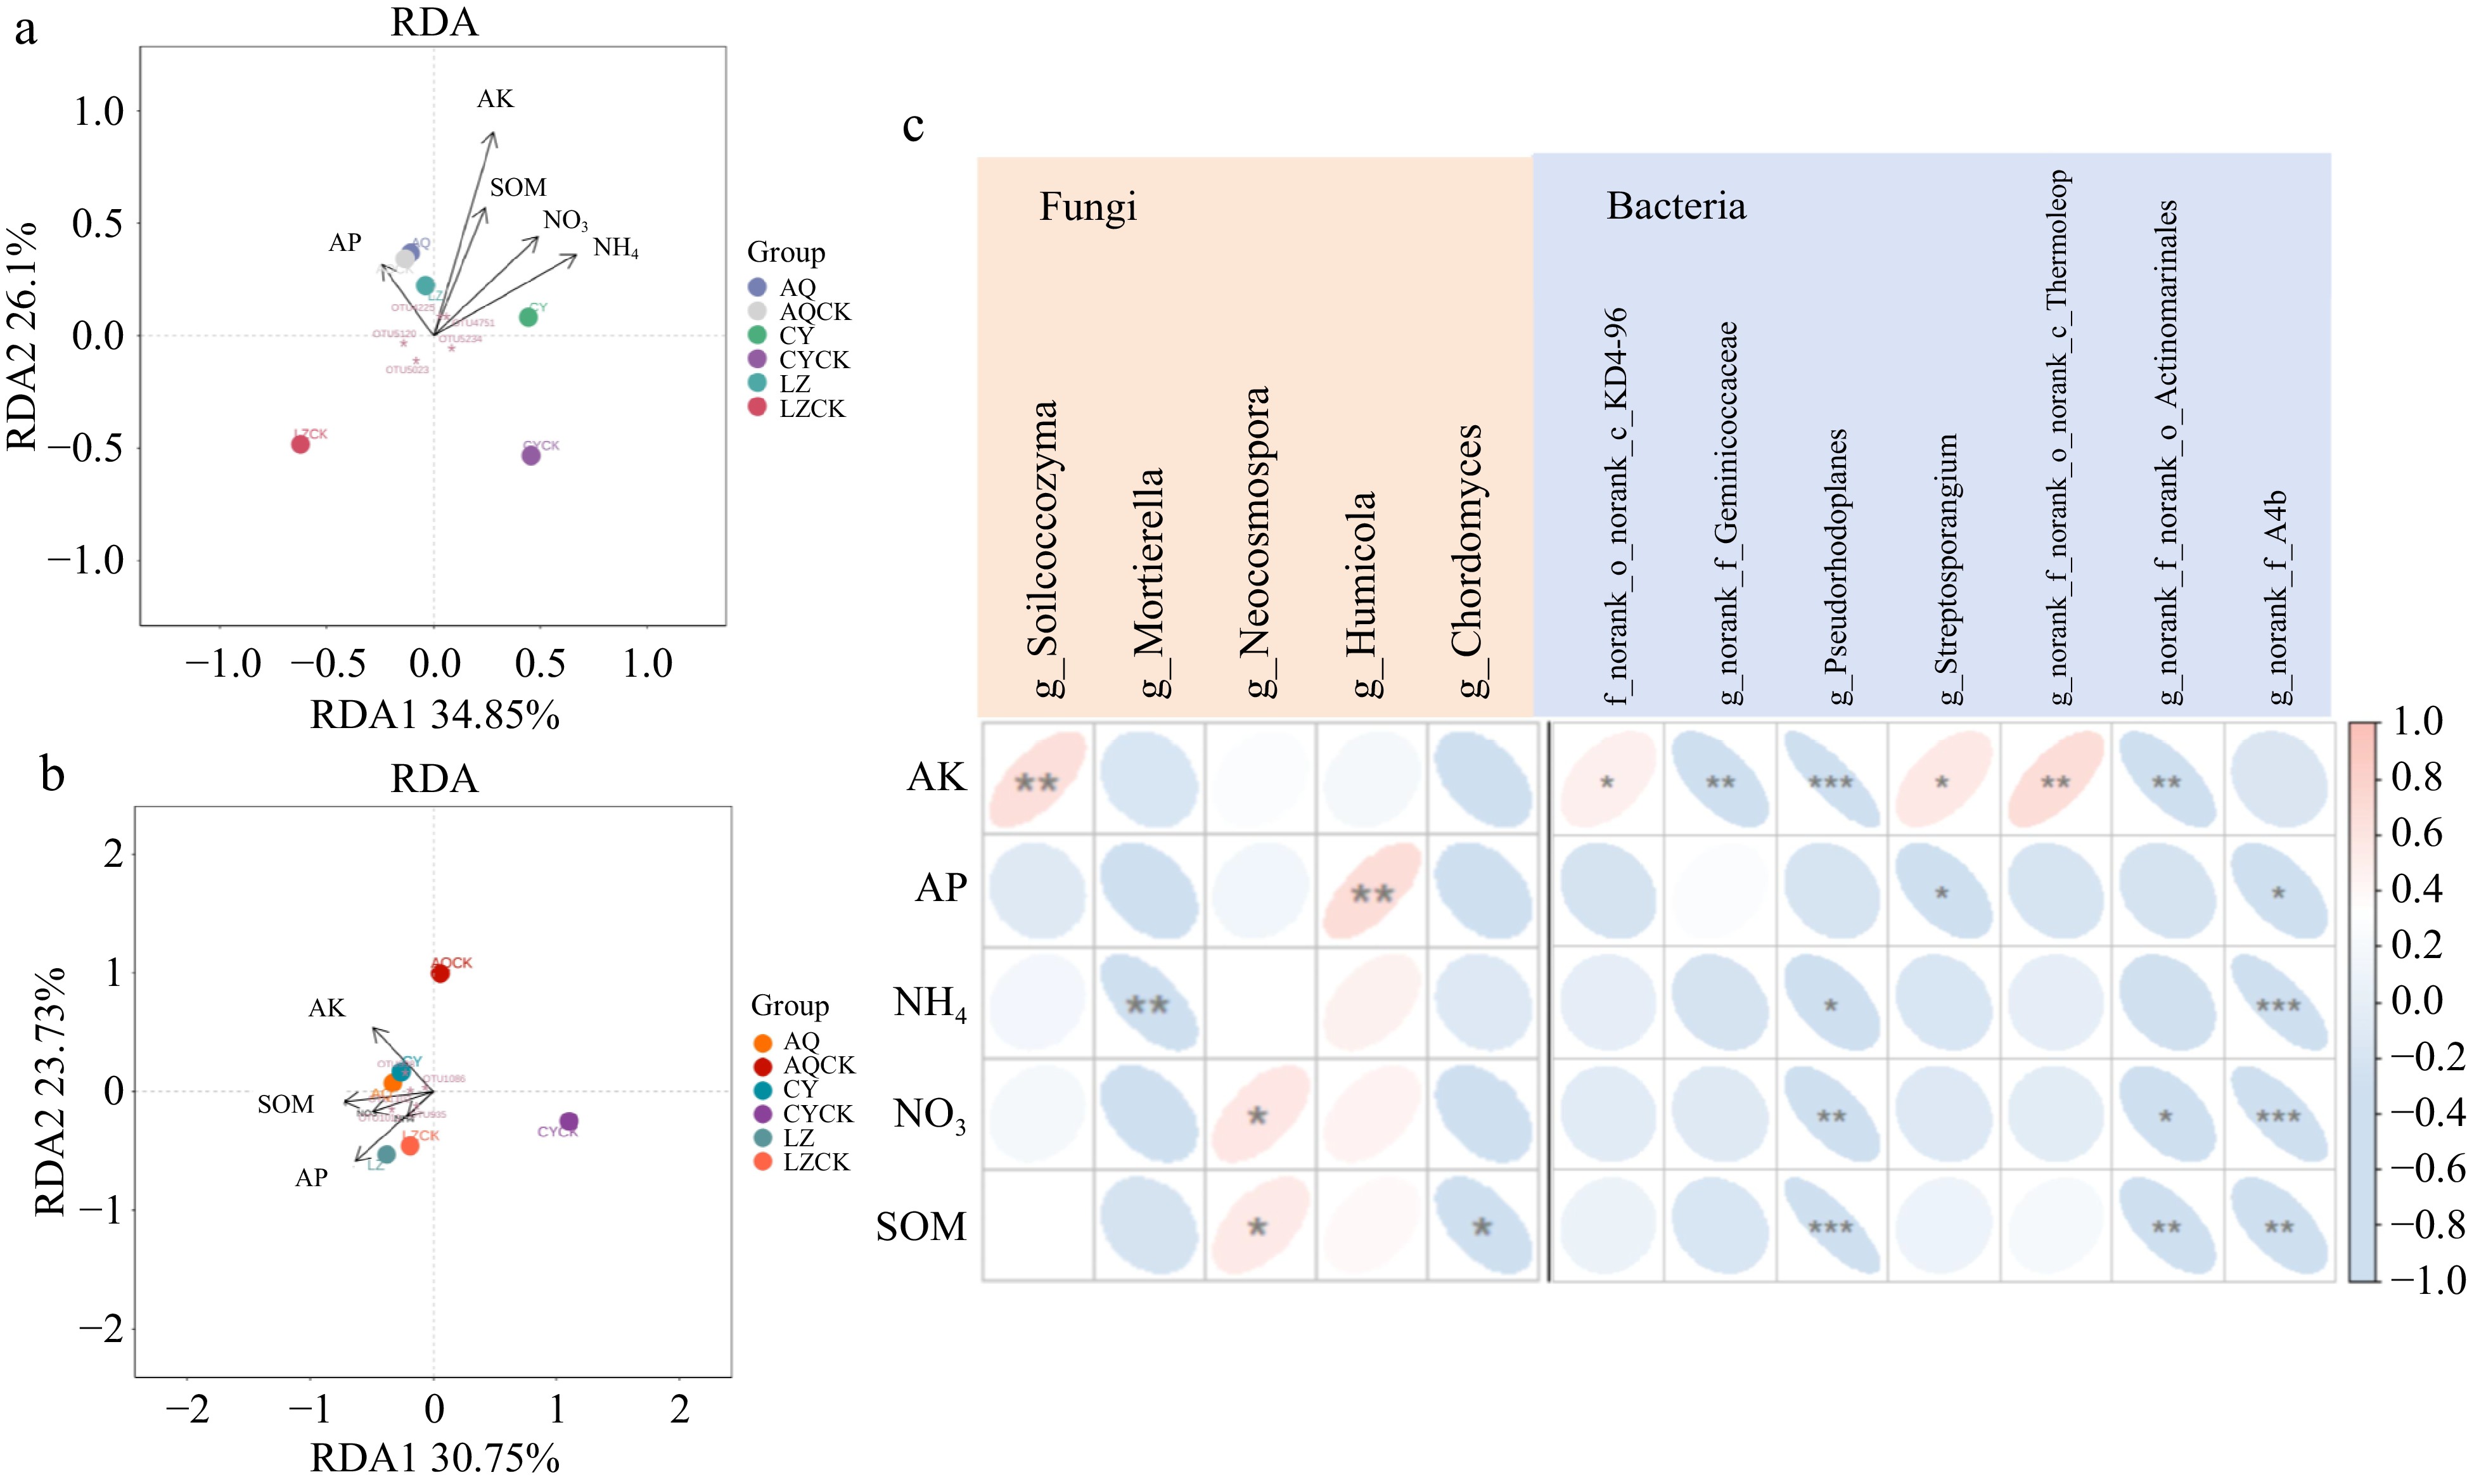
Figure 10.
A scatter diagram of RDA of X. sorbifolium Bunge continuous cropping. (a) RDA of the correlation between soil physicochemical properties and soil bacterial community; (b) RDA of the correlation between soil physicochemical properties and soil fungal community; (c) The relationships between soil physicochemical properties and strains representing soil microbial community changes. SOM: organic matter, NH4: Ammonium nitrogen, NO3: Nitrate nitrogen , AP: Available phosphorus, AK: Available potassium. Different colors in the heat map represent positive and negative correlation, color depth represents positive and negative correlation, and asterisks in color blocks represent the significance level. * 0.01 ≤ p < 0.05, ** 0.001 < p ≤ 0.01, *** p ≤ 0.001.
-
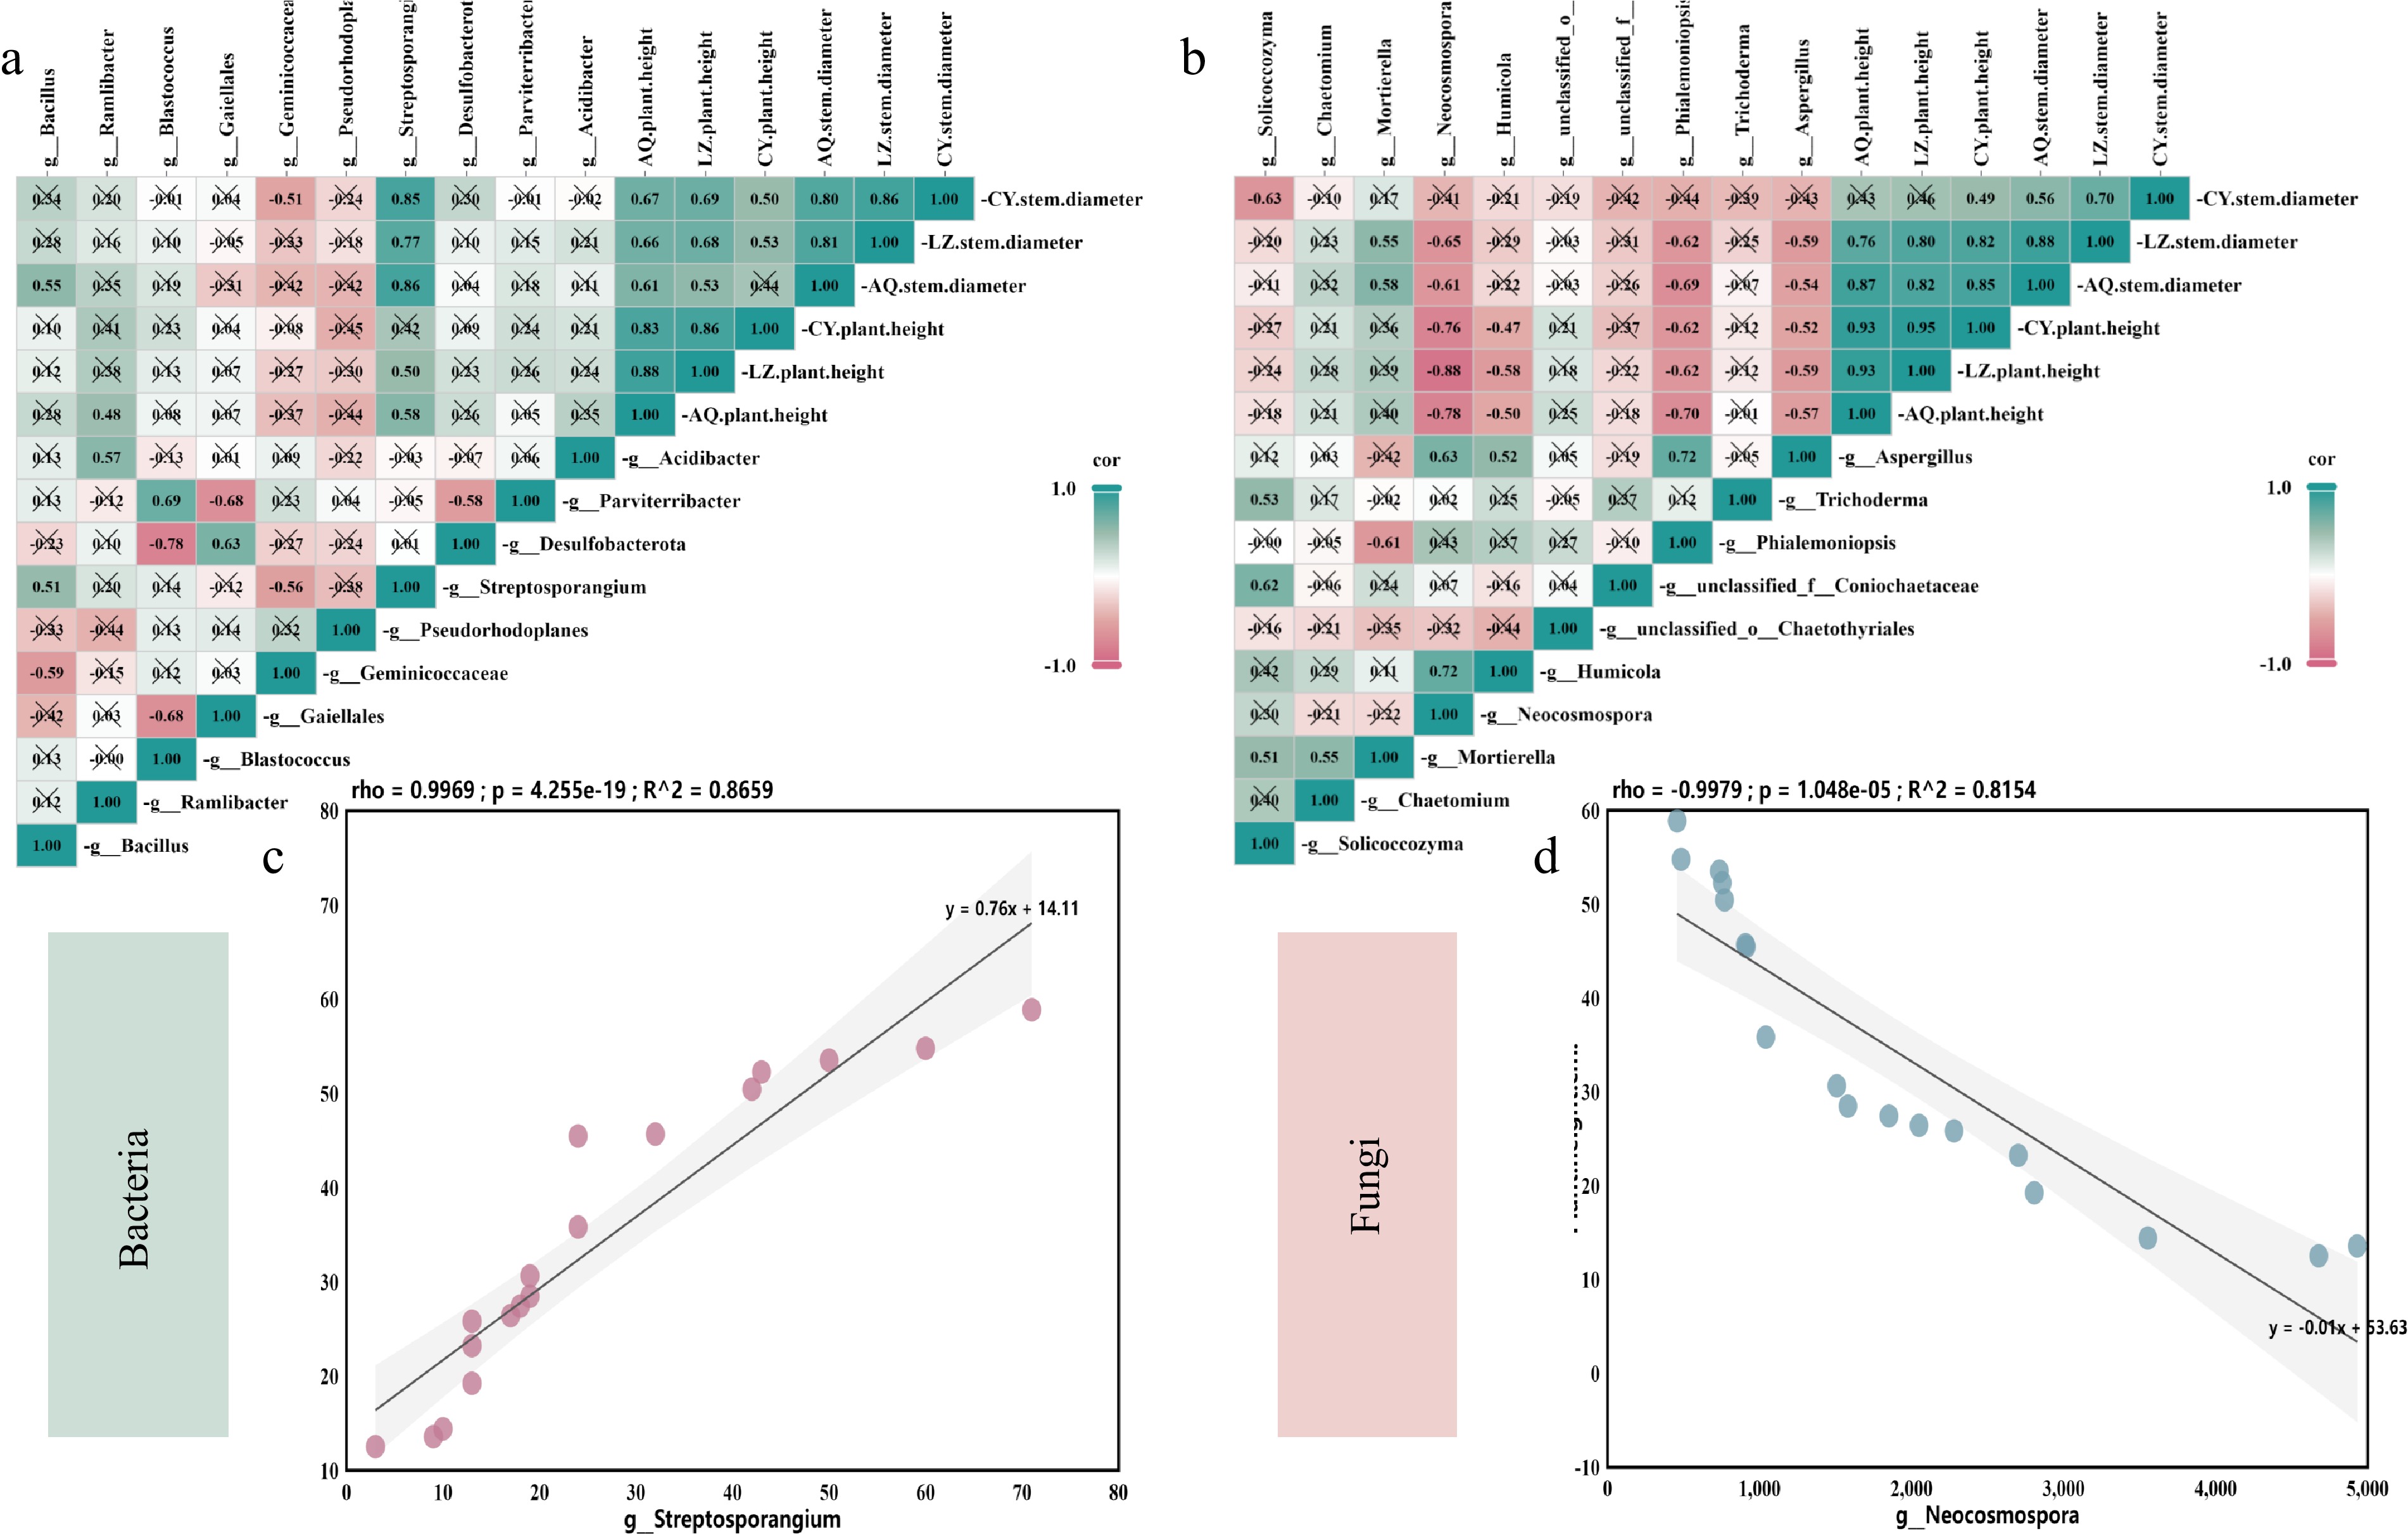
Figure 11.
Correlation between rhizosphere microbial abundance and X. sorbifolia biomass under continuous cropping. (a) Correlation between the biomass of X. sorbifolium Bunge and soil bacterial community; (b) Correlation between the biomass of X. sorbifolium Bunge and soil fungal community. Different colors in the heat map represent positive and negative correlation; color depth represents positive and negative correlation; * in color blocks represents statistical significance. * 0.01 ≤ p < 0.05, ** 0.001 < p ≤ 0.01, *** p ≤ 0.001; (c) The relationships between soil indicator microorganisms and plant biomass indicators. Pearson correlation coefficient indicates the linear correlation between two random variables. The value of R ranges from −1~1, with R > 0 denoting a positive correlation and R < 0 representing a negative correlation. The p value represents the significance of the correlation degree.
-
AQ
(μgTTF·g−1·h−1)LZ
(μgTTF·g−1·h−1)CY
(μgTTF·g−1·h−1)T1 13.46 ± 0.68** 14.59 ± 1.68* 15.73 ± 0.50*** CK 7.40 ± 0.54 7.21 ± 0.83 6.64 ± 0.50 A t-test was used to determine the significant differences between the two treatment groups. Data in the table are expressed as mean ± SE. T1 represents untreated soil; CK denotes continuous planting of X. sorbifolium Bunge. Significant differences are presented as follows: * 0.01 ≤ p < 0.05, ** 0.001 < p ≤ 0.01, and *** p ≤ 0.001. Table 1.
Root activity of crown fruit in different regions.
-
Treatment Organic matter
(g·kg−1)Nitrate nitrogen
(mg·kg−1)Ammonium nitrogen
(mg·kg−1)Available phosphorus
(mg·kg−1)Available potassium
(mg·kg−1)AQ 10.58 ± 0.20* 1.23 ± 0.00** 0.09 ± 0.00** 1.13 ± 0.06*** 16.79 ± 0.11*** AQCK 9.47 ± 0.19 0.23 ± 0.01 0.06 ± 0.00 0.75 ± 0.01 14.56 ± 0.56 LZ 11.62 ± 0.20*** 0.32 ± 0.01*** 0.10 ± 0.00** 0.10 ± 0.01** 15.13 ± 0.09** LZCK 8.42 ± 0.37 0.14 ± 0.00 0.08 ± 0.00 0.86 ± 0.01 13.54 ± 0.17 CY 10.59 ± 0.19** 0.27 ± 0.01** 0.09 ± 0.01*** 1.24 ± 0.03* 12.81 ± 0.03*** CYCK 9.34 ± 0.07 0.17 ± 0.01 0.08 ± 0.01 1.06 ± 0.03 8.50 ± 0.20 A t-test was used to determine the significant differences between the two treatment methods. Data in the table are expressed as mean ± SE. AQ: Untreated soil in Anqiu; AQCK: continuous planting of X. sorbifolium Bunge in Anqiu; LZ: Untreated soil in Linzi; LZCK: Continuous planting of X. sorbifolium Bunge in Linzi; CY: Untreated soil in Changyi; CYCK: Continuous planting of X. sorbifolium Bunge in Changyi. Significant differences are denoted as follows: * 0.01 ≤ p < 0.05, ** 0.001 < p ≤ 0.01, and *** p ≤ 0.001. Table 2.
Soil physicochemical properties in different areas.
Figures
(11)
Tables
(2)