-
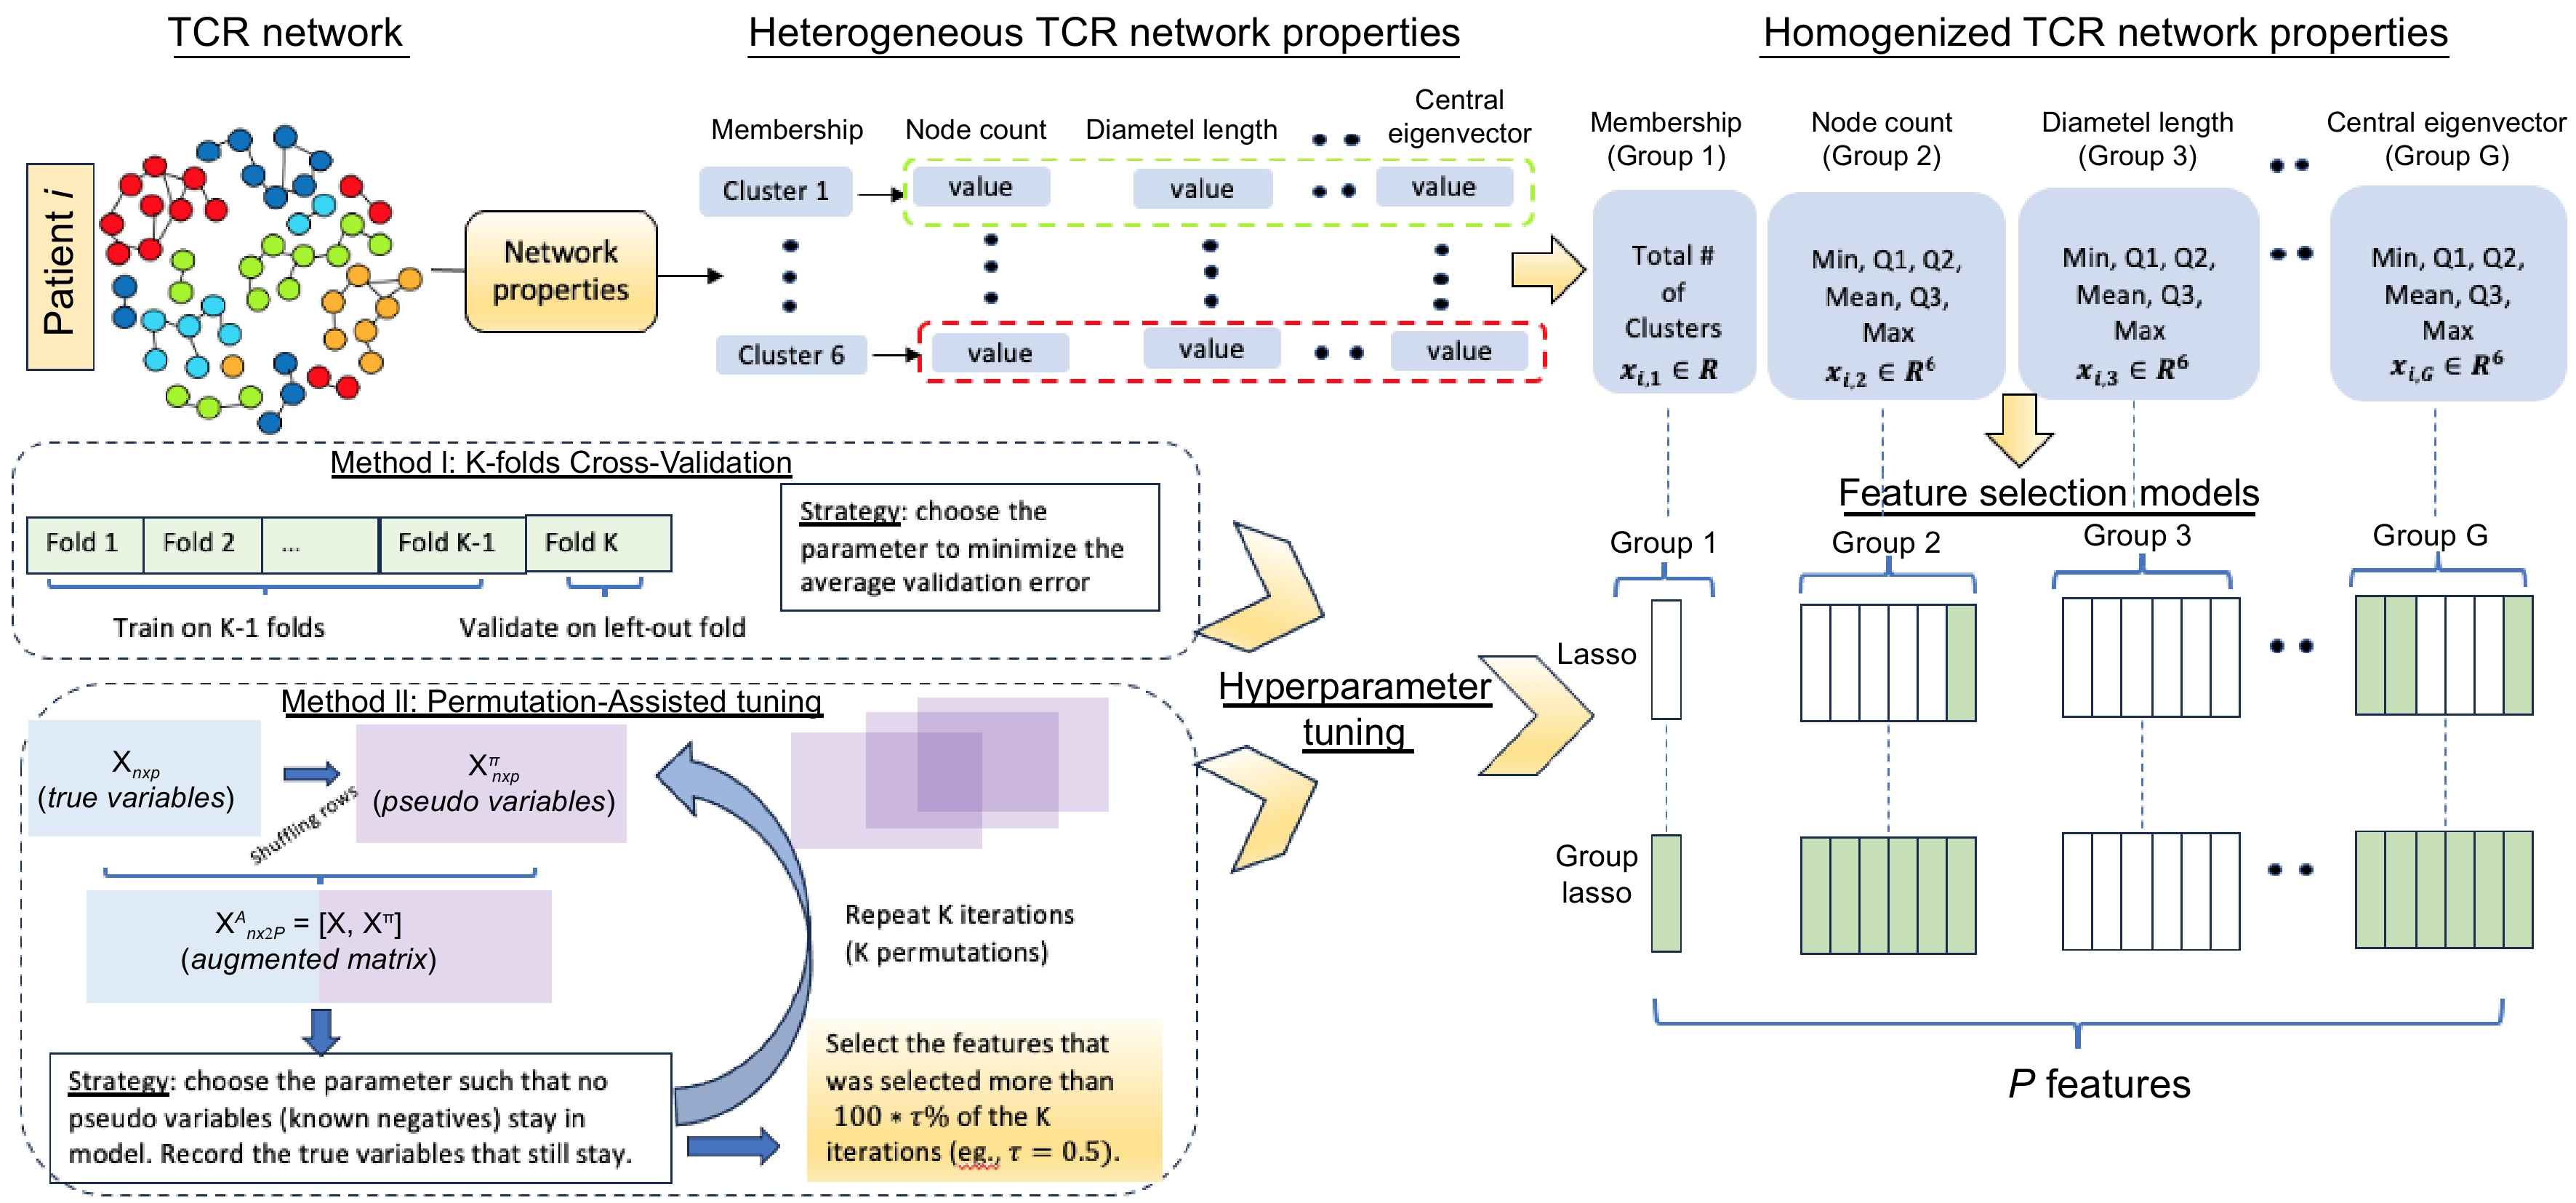
Figure 1.
Proposed pipeline. Top: Derivation of the network properties to network property features; Bottom left: Cross-Validation (CV) tuning and permutation-assisted tuning; Bottom right: Summary of the feature selection models (Lasso and Group Lasso).
-
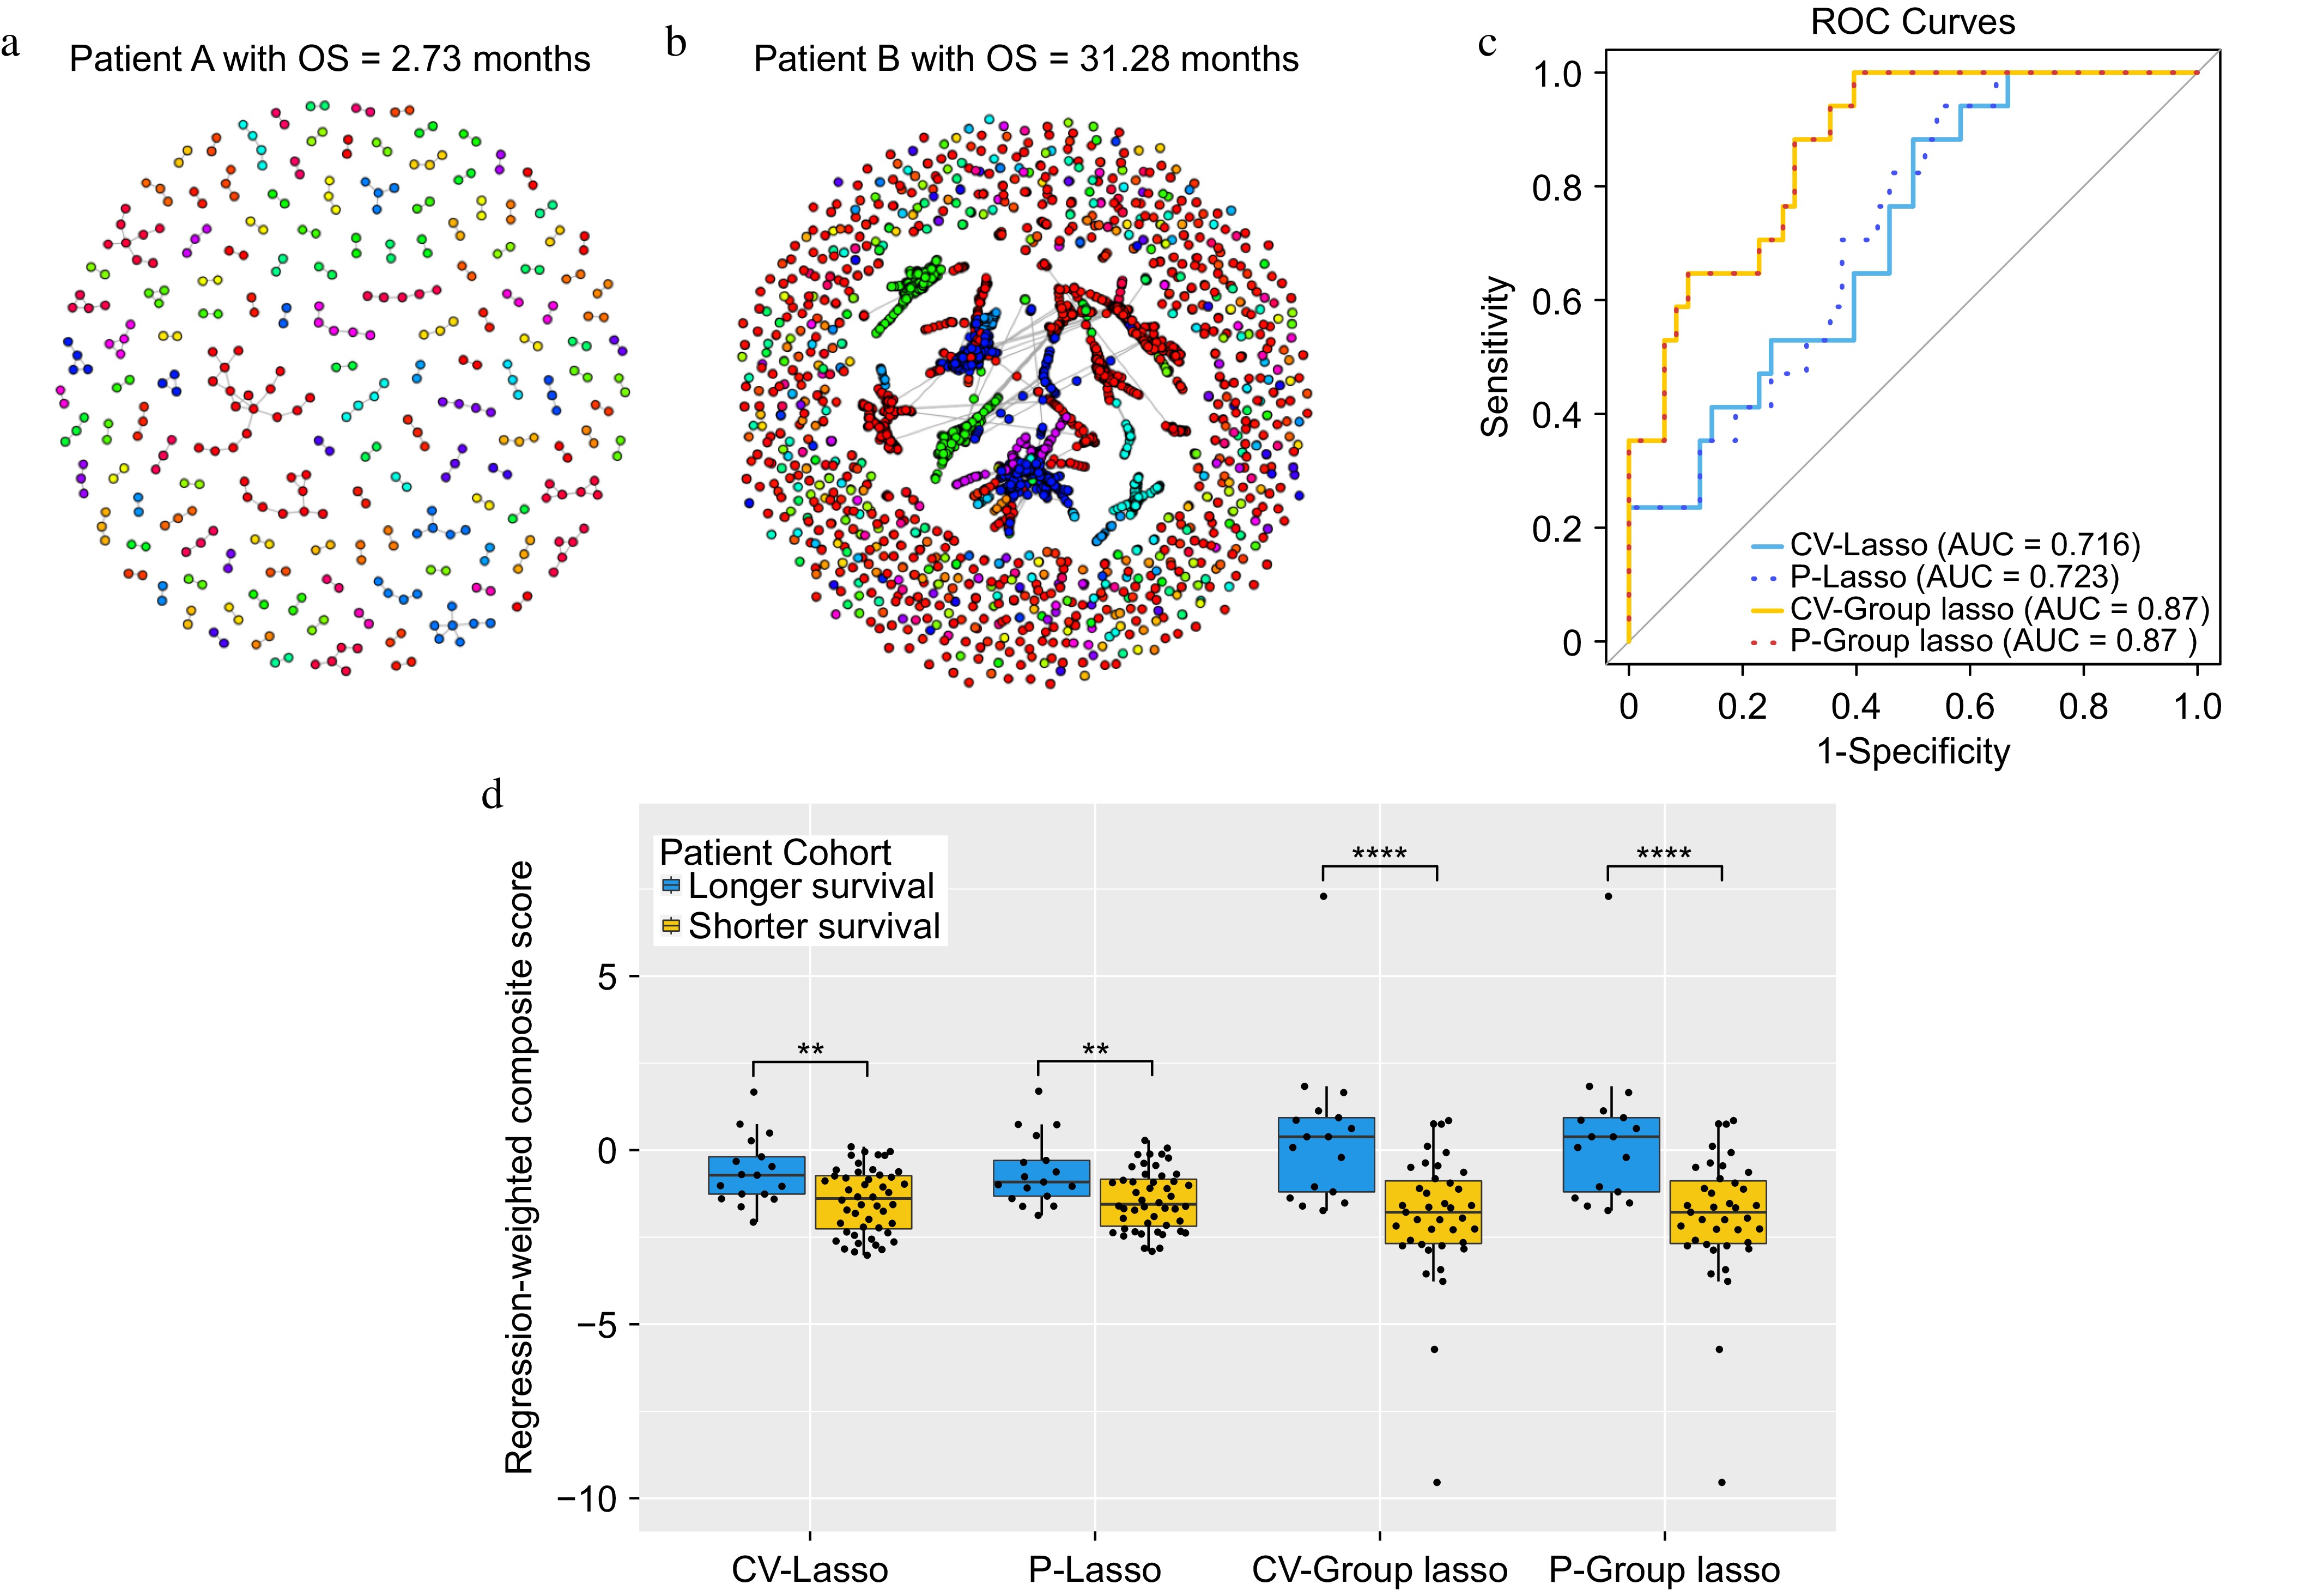
Figure 2.
The results for the lung cancer dataset. (a) and (b) Networks for two representative patients. Within each network figure, each node represents TCR and nodes are connected if their distance is less than or equal to 1. (c) ROC curves for each of the approaches. (d) Boxplots of the composite scores.
-
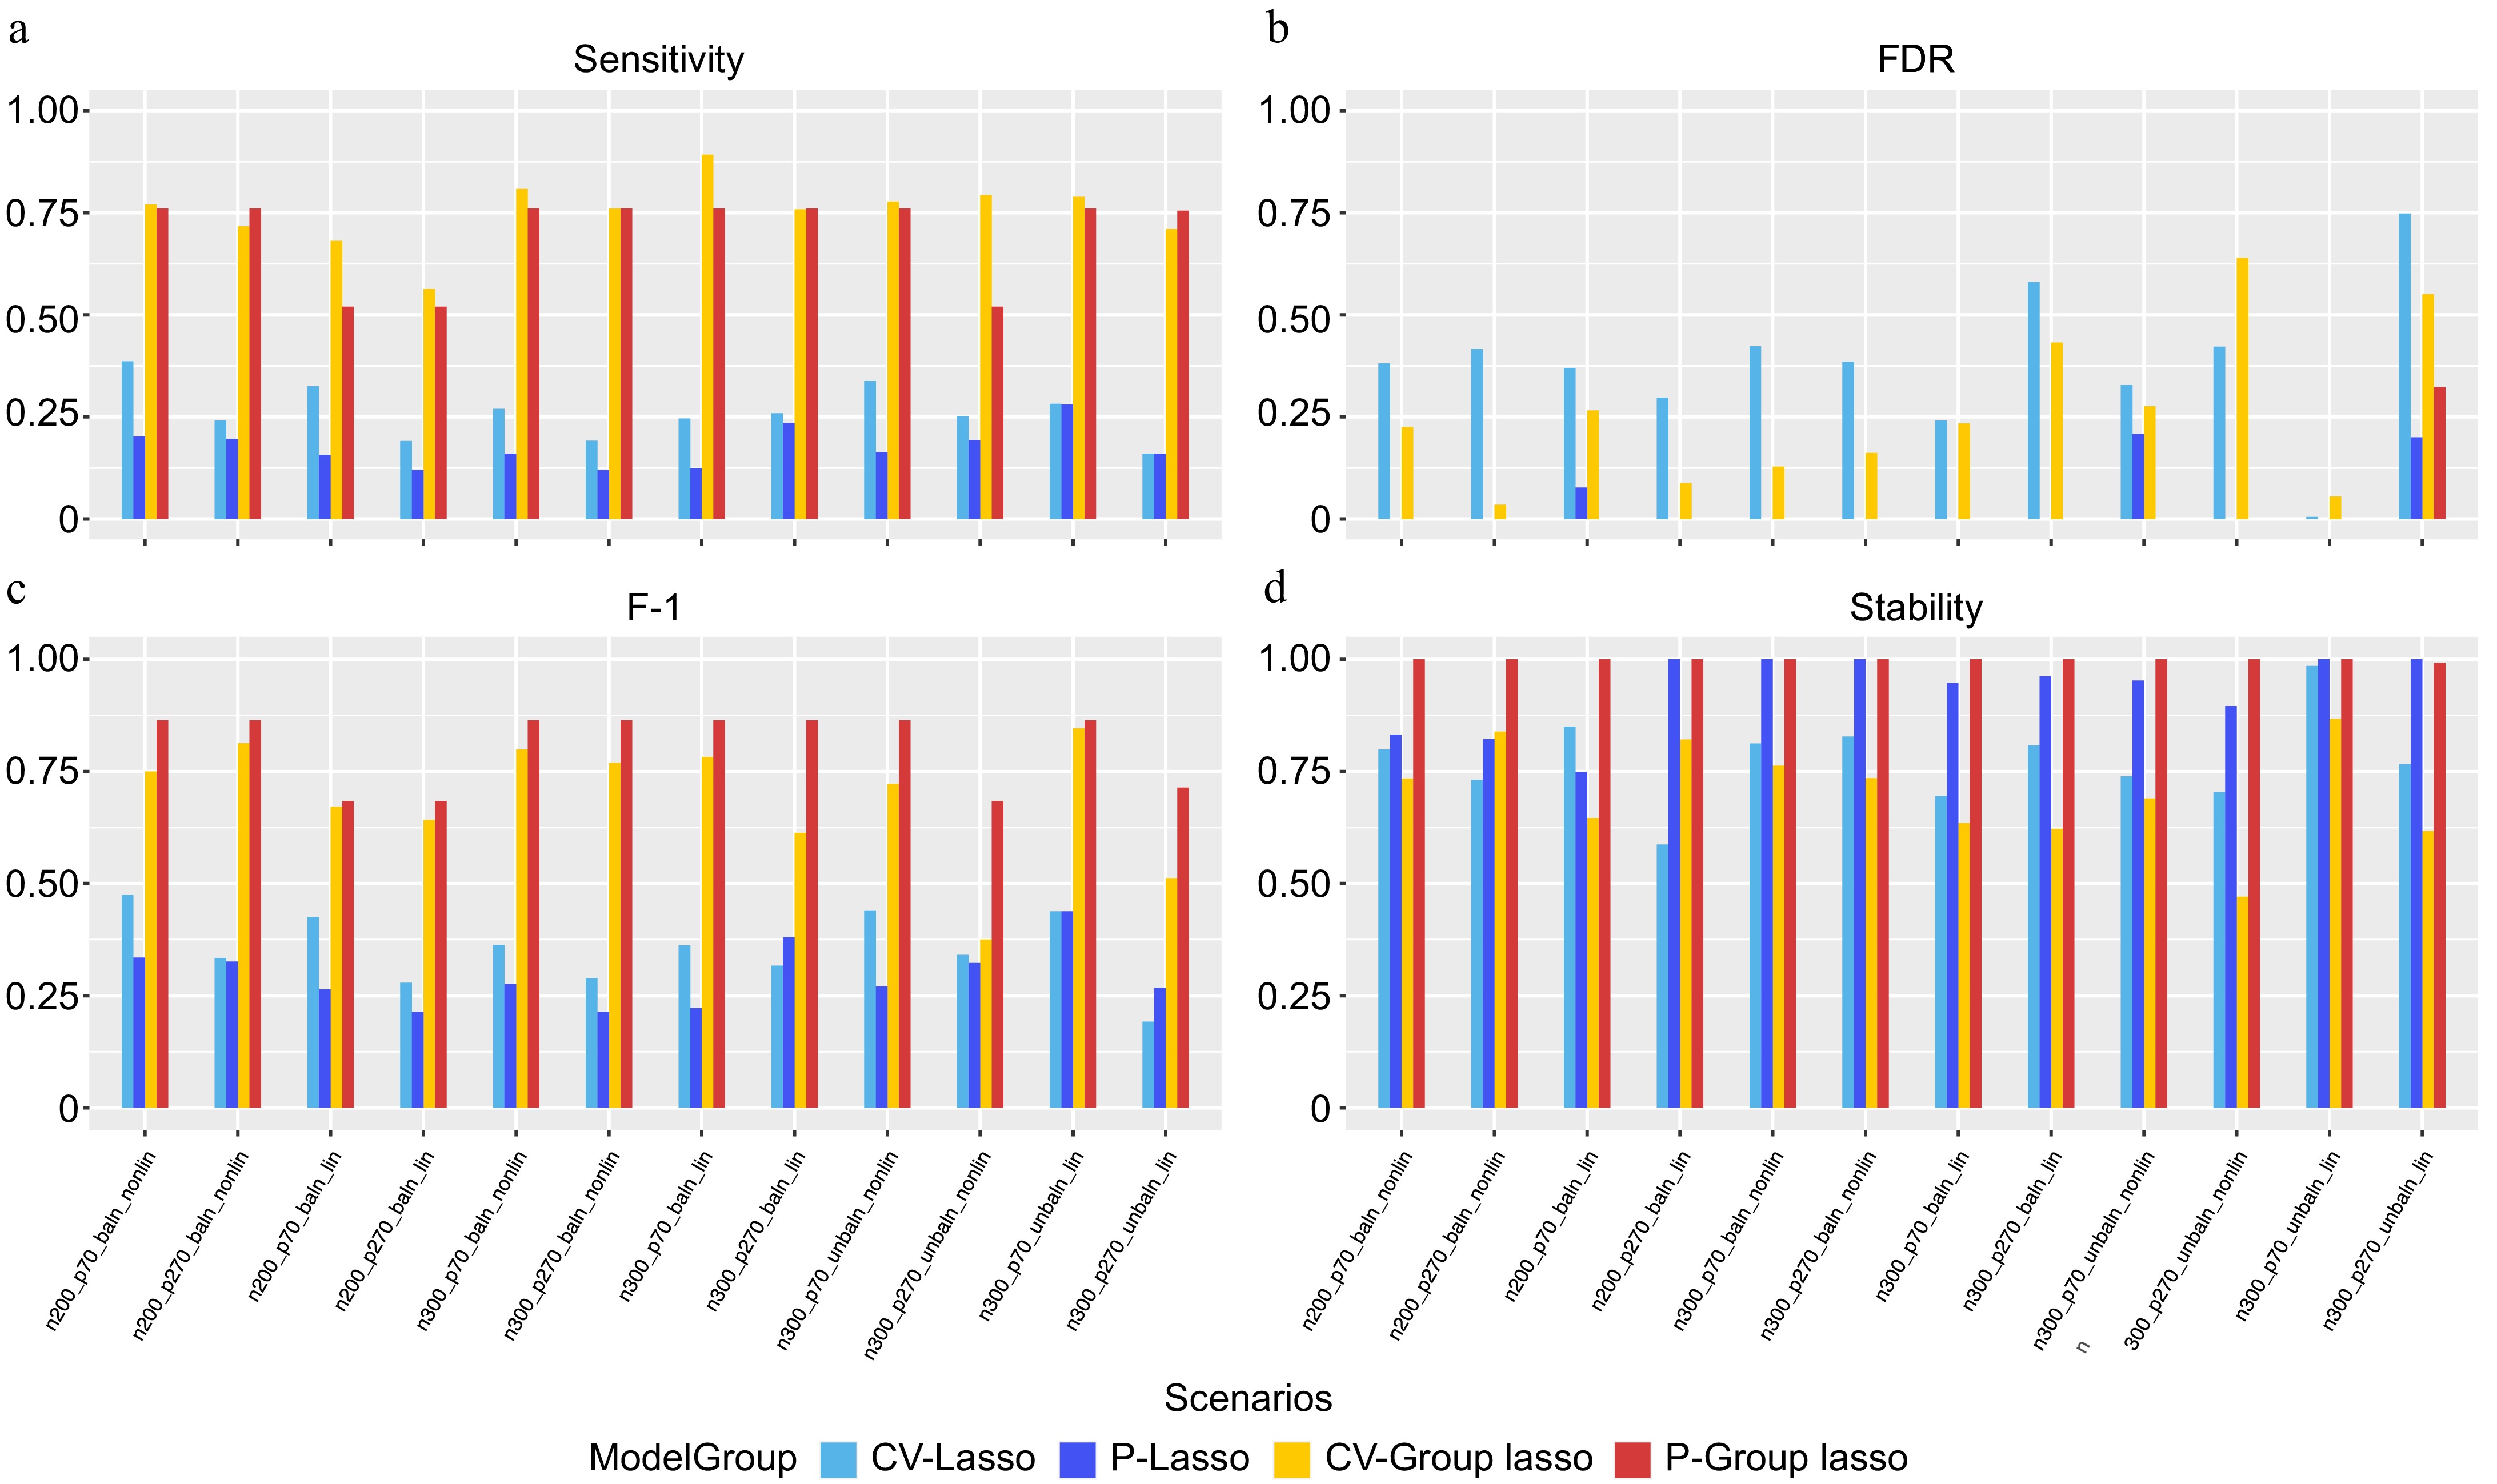
Figure 3.
Performance evaluation based on simulation. (a) Sensitivity. (b) FDR. (c) F-1. (d) Stability. In each panel, x-axis stands for different simulation scenario listed in Table 3 and color-coded for different approaches.
-
Network properties Description Function Count at baseline Summation of the TCR counts of a given membership at baseline. sum(input_data[input_datamembership == membership_id, Count_baseline]) Count post treatment Summation of the TCR counts of a given membership post treatment. sum(input_data [input_data$membership == membership_id, Count_post_treatment]) Cluster size The number of node in a given membership. table(input_data $membership) Diameter length The length of the longest geodesic. get_diameter(net, directed = F) Assortativity The assortativity coefficient which is positive if similar vertices (based on some external property) tend to connect to each, or negative otherwise. assortativity_degree(net, directed = F) Transitivity The probability that the adjacent vertices of a vertex are connected. transitivity(net, type = "global") Density The ratio of the number of edges and the number of possible edges. edge_density(net, loops = F) Degree centrality Graph centralization based on the degrees of vertices. centr_degree(net, mode = "in", normalized = T) $centralization Closeness centrality Graph centralization based on the closeness of vertices. centr_clo(net, mode = "all", normalized = T) $centralization Eigenvector centrality Graph centralization based on the eigenvector centralities of positions v within it. eigen_centrality(net, directed = F, weights = NA) $value Central Eigenvector Graph centralization based on the Eigenvector centrality of vertices. centr_eigen(net, directed = F, normalized = T) $centralization Table 1.
Parameters used for feature selection methods.
-
Network properties Network property features Node count Min, Q1, Median, Mean, Q3, Max *Count pre infusion Min, Q1, Median, Mean, Q3, Max Count dose 2 Min, Q1, Median, Mean, Q3, Max *Diameter length Min, Q1, Median, Mean, Q3, Max Assortativity prob(NA), Min, Q1, Median, Mean, Q3, Max Transitivity prob(NA), Min, Q1, Median, Mean, Q3, Max Density Min, Q1, Median, Mean, Q3, Max Degree centrality Min, Q1, Median, Mean, Q3, Max Closeness centrality prob(NA), Min, Q1, Median, Mean, Q3, Max *Eigenvector centrality Min, Q1, Median, Mean, Q3, Max *Central Eigen prob(NA), Min, Q1, Median, Mean, Q3, Max * Properties/property features in bold font are considered as the causal properties/features in simulation studies. Table 2.
TCR network properties and derived network property features.
-
Scenario # *n **P ***Balanced data ****Linear/non-linear Causal Non-causal Additional n200_p270_baln_lin 200 25 45 200 Balanced Linear n200_p270_baln_nonlin 200 25 45 200 Balanced Non-linear n200_p70_baln_lin 200 25 45 NA Balanced Linear n200_p70_baln_nonlin 200 25 45 NA Balanced Non-linear n300_p270_baln_lin 300 25 45 200 Balanced Linear n300_p270_baln_nonlin 300 25 45 200 Balanced Non-linear n300_p270_unbaln_lin 300 25 45 200 Imbalanced Linear n300_p270_unbaln_nonlin 300 25 45 200 Imbalanced Non-linear n300_p70_baln_lin 300 25 45 NA Balanced Linear n300_p70_baln_nonlin 300 25 45 NA Balanced Non-linear n300_p70_unbaln_lin 300 25 45 NA Imbalanced Linear n300_p70_unbaln_nonlin 300 25 45 NA Imbalanced Non-linear * n: # of simulated patients. ** P: # of simulated signals (causal TCR network property features, non-causal TCR n/w property features, additional correlated multivariate noise signals). *** Balanced data: denotes the simulated dataset has balanced proportion of shorter and longer survival groups. **** Linear: denotes the simulated response variable Y consist of a linear combination of the causal variables. Non-linear: denotes the simulated variable Y consists of linear and interaction terms generated using the causal variables. Table 3.
Simulation scenarios.
-
Network properties CV-Lasso* P-Lasso CV-Group
Lasso**P-Group
Lasso**Count pre infusion Max Max All All Count dose2 − − All All Node count − − All − Diameter length Max Max − − Assortativity − − − − Transitivity − − − − Density − − − − Degree centrality − − − − Closeness centrality − − − − Eigenvector centrality Max Max All All Central Eigen Max − − − * The network property features extracted using CV-Lasso model are used as the causal variables for simulation study. ** The value 'All' represents the entire set of descriptive summary statistics derived from the TCR network property. Table 4.
Results from real data analysis. The table lists the network properties and corresponding network property features selected by each approach.
Figures
(3)
Tables
(4)