-
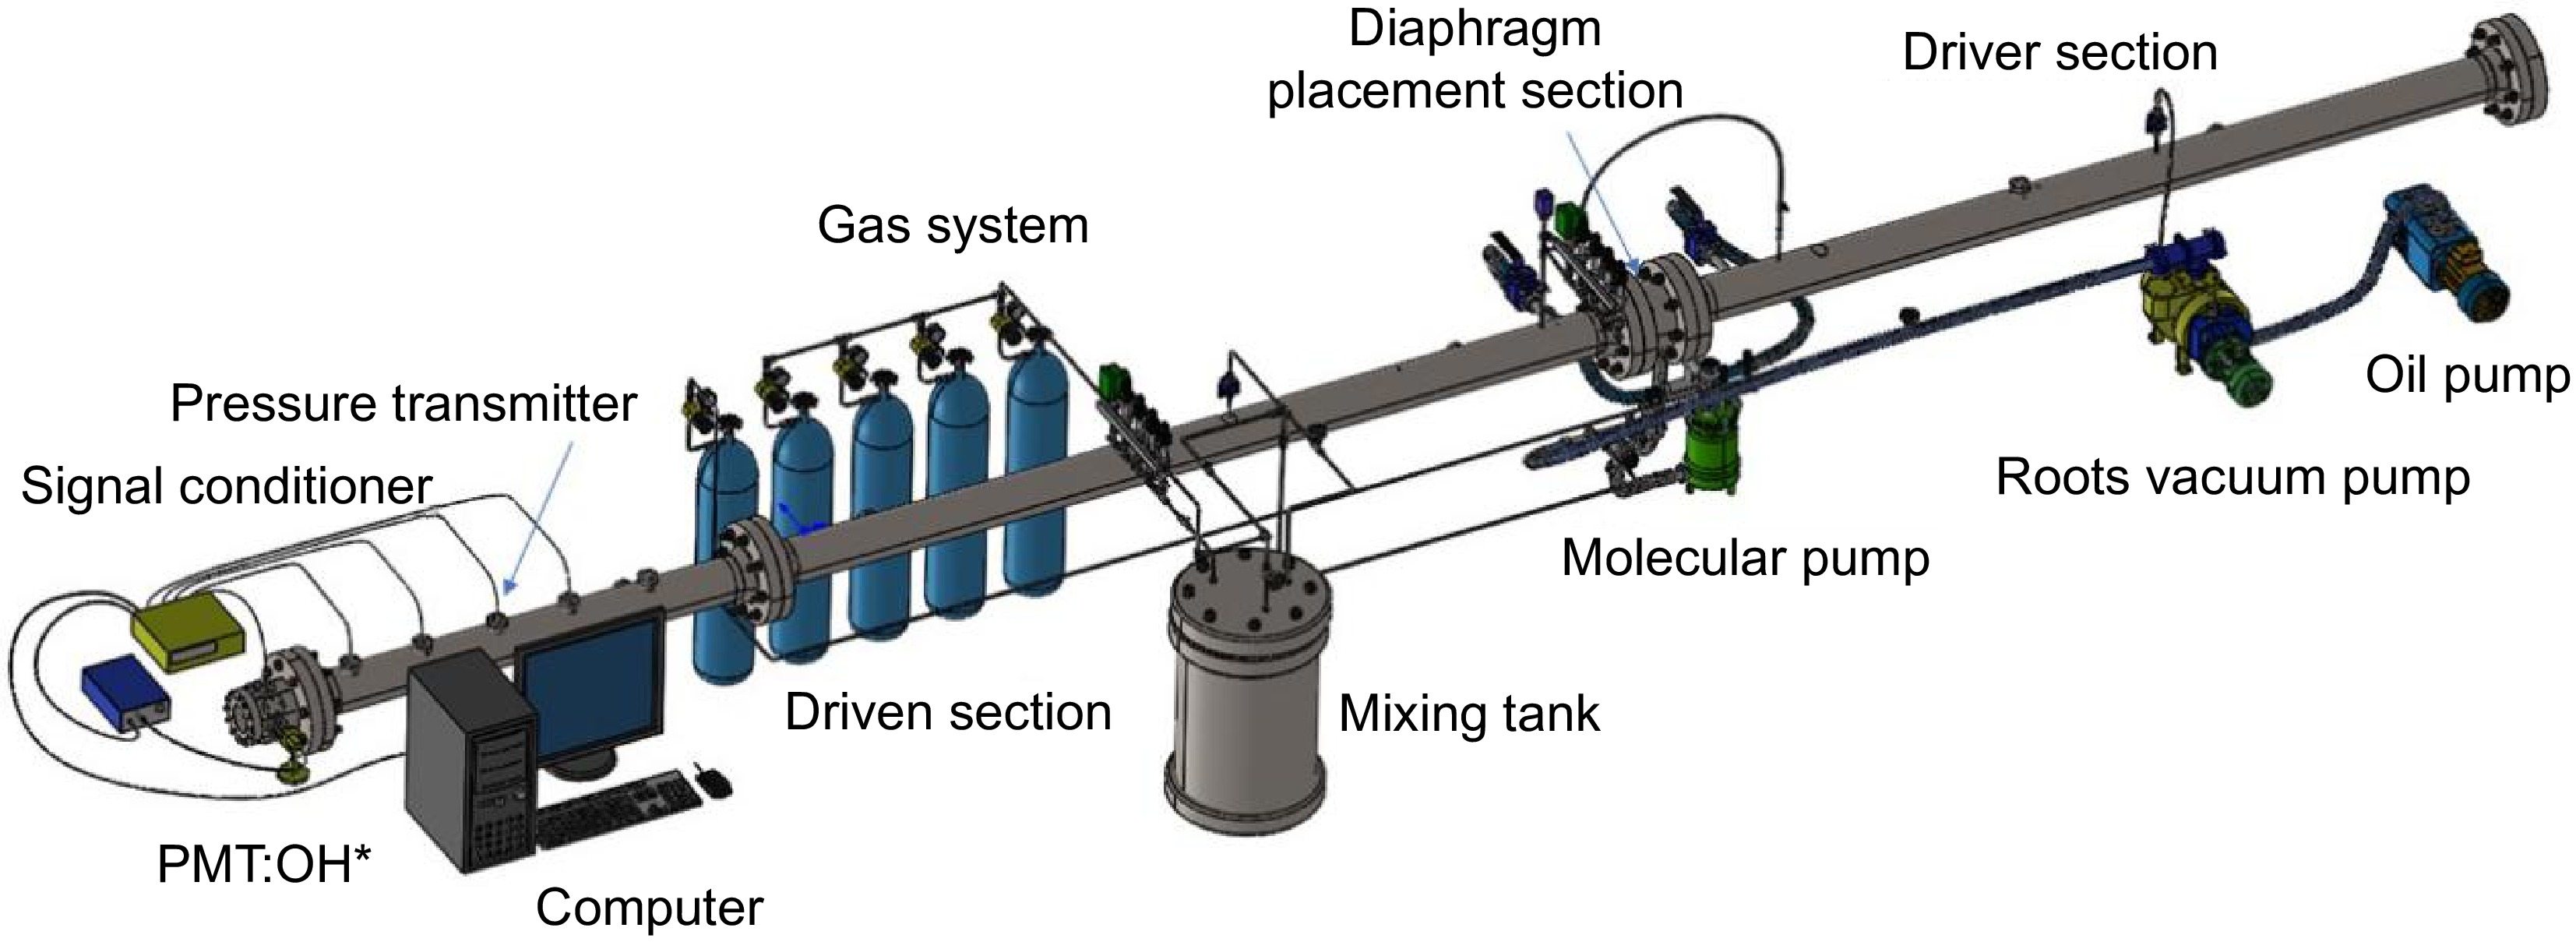
Figure 1.
Schematic diagram of the shock tube system.
-
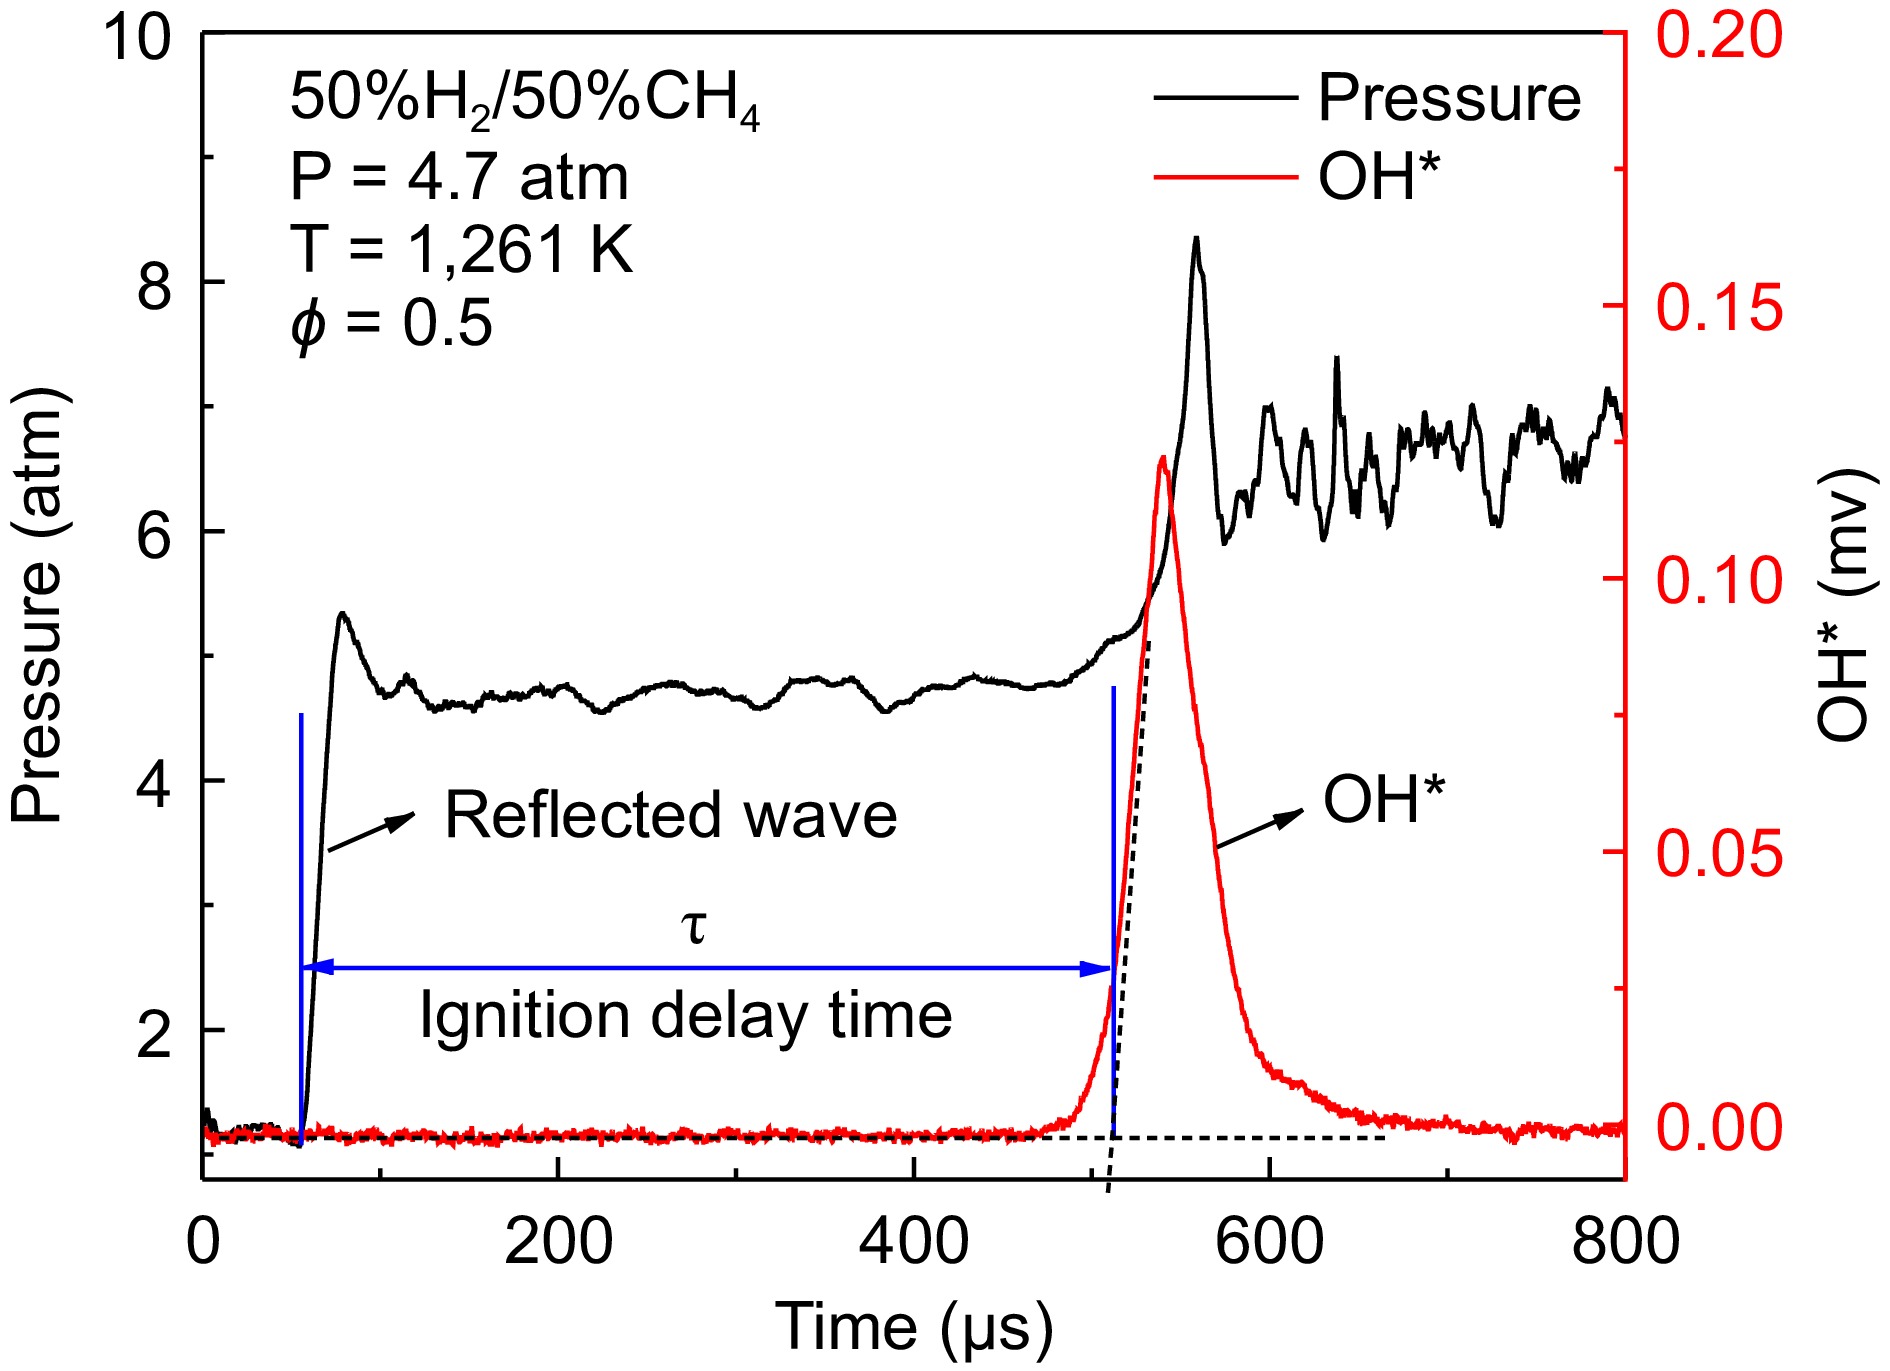
Figure 2.
Definition of ignition delay time.
-
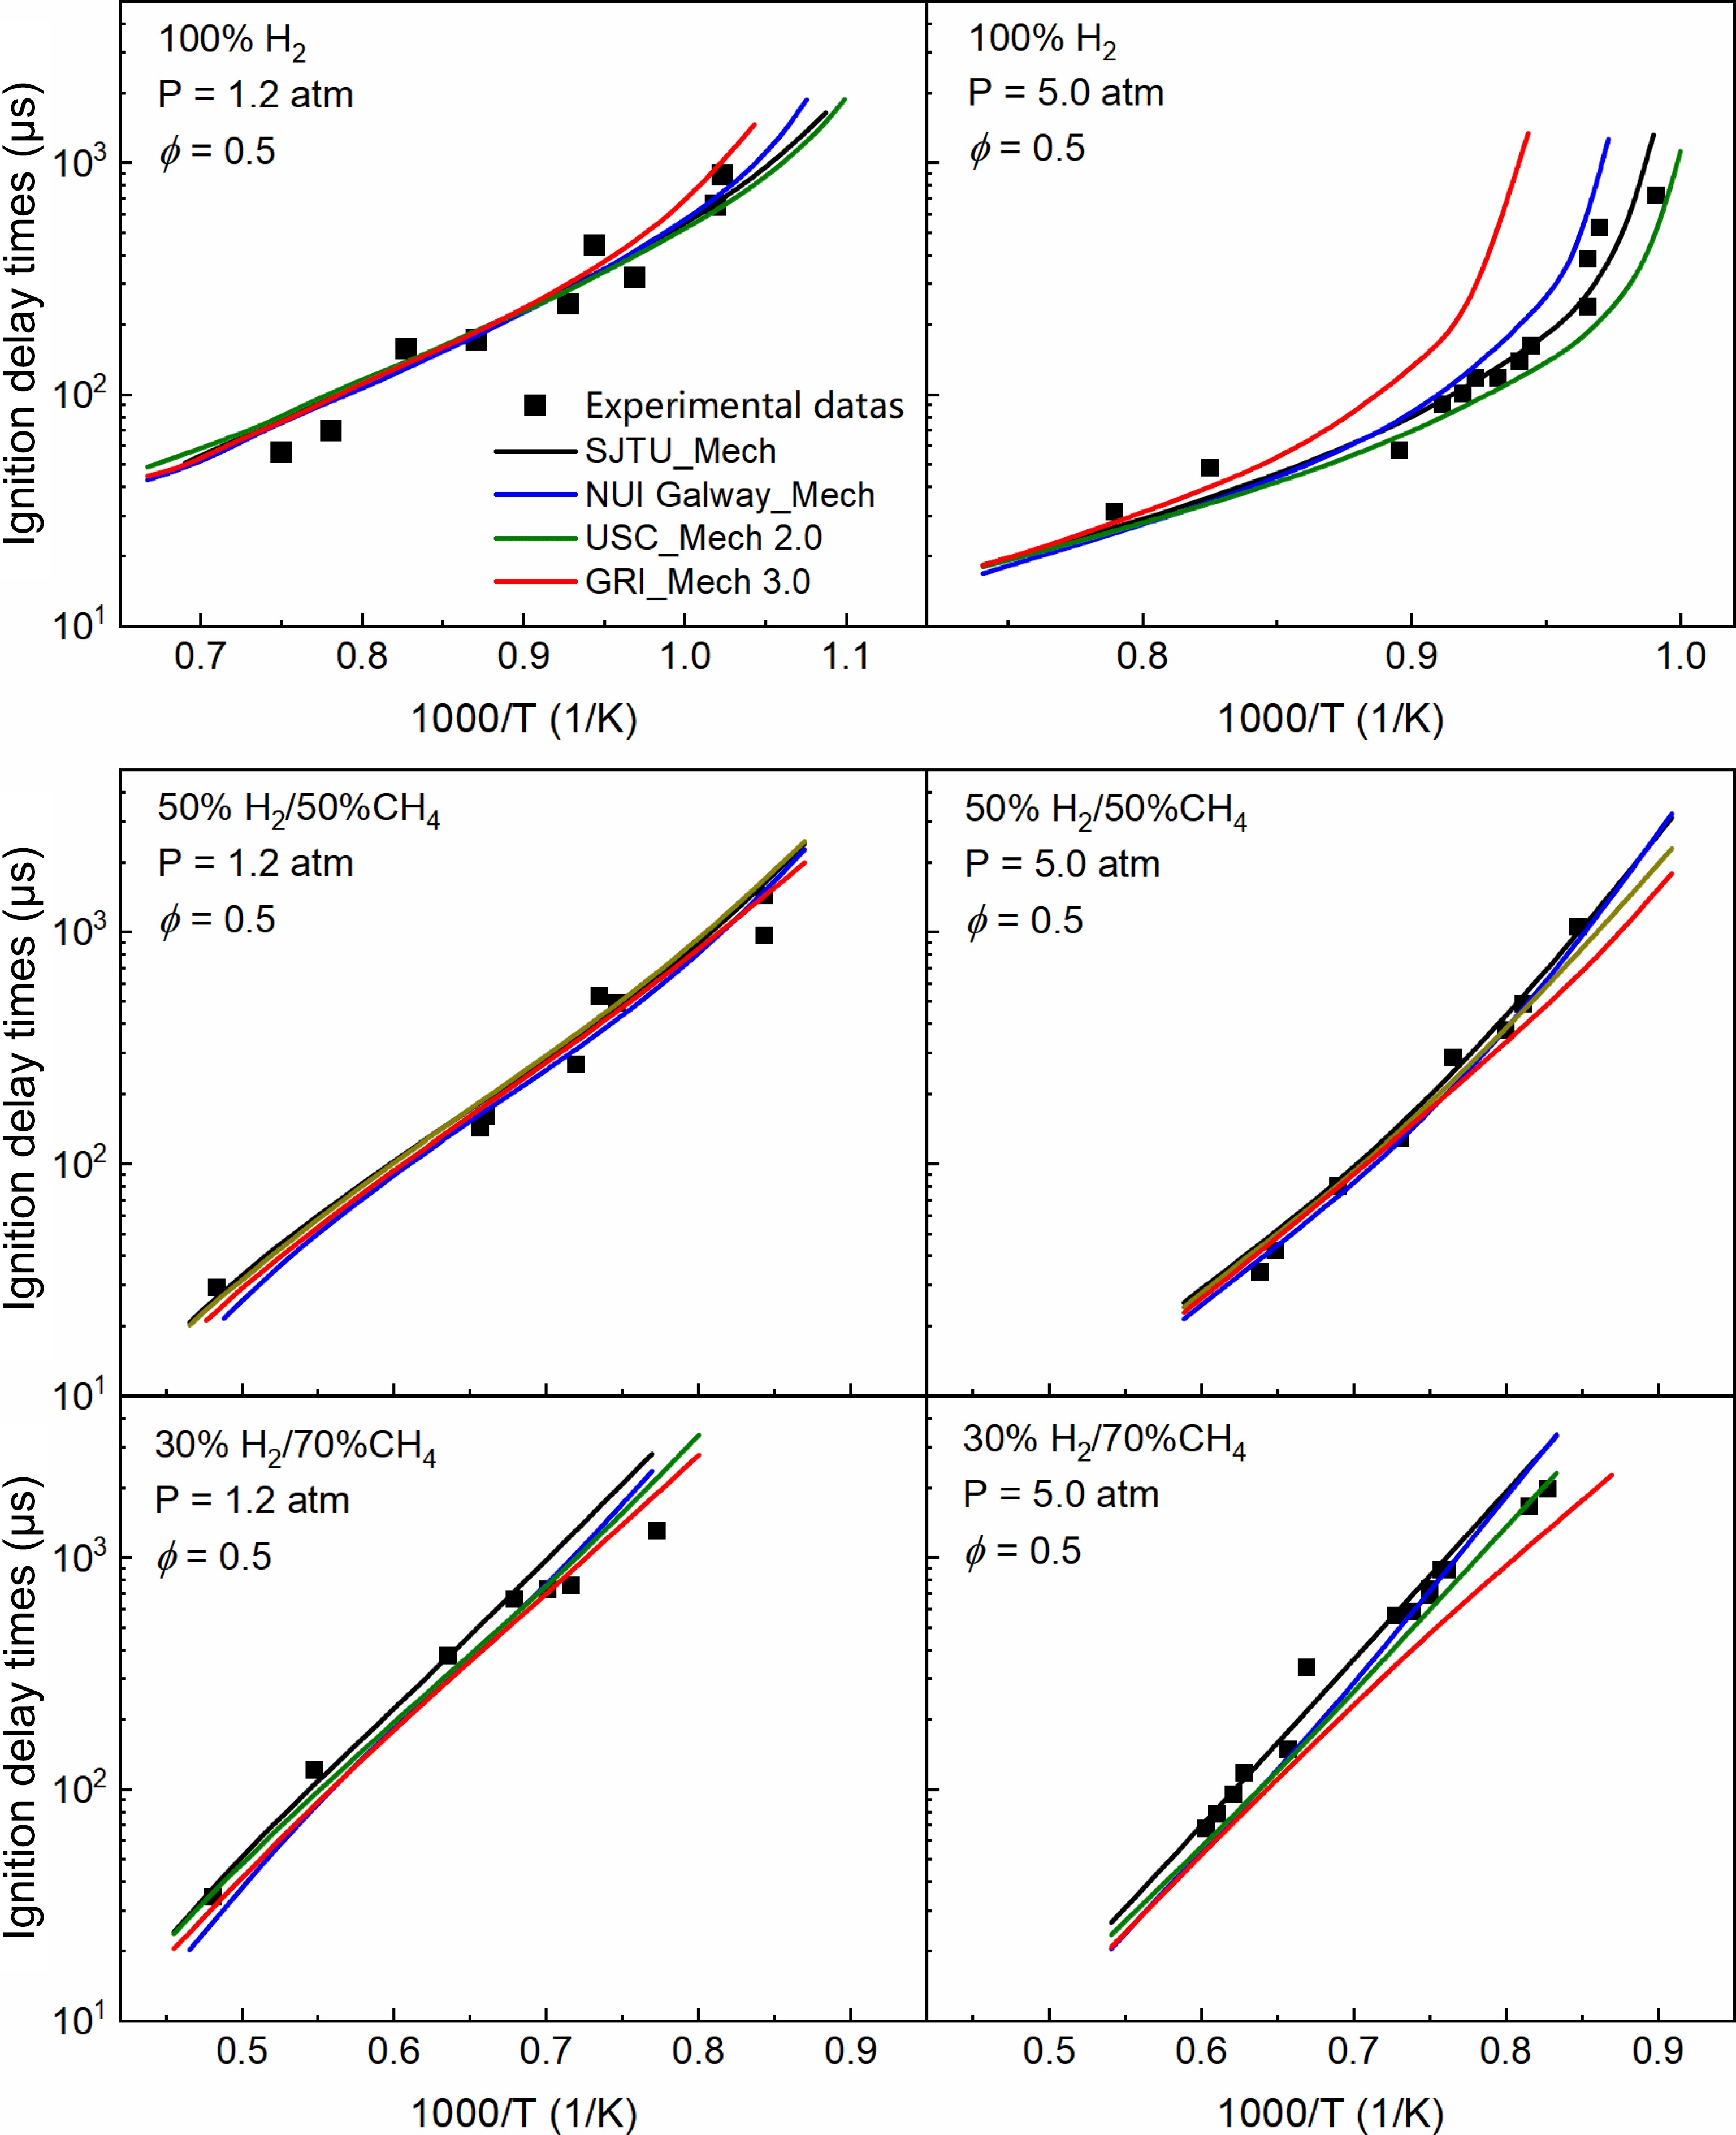
Figure 3.
Comparison of experimental (dots) and simulated (lines) results of IDTs for 100% H2, 50% H2/50% CH4, and 30% H2/70% CH4 at 1.2 and 5.0 atm.
-
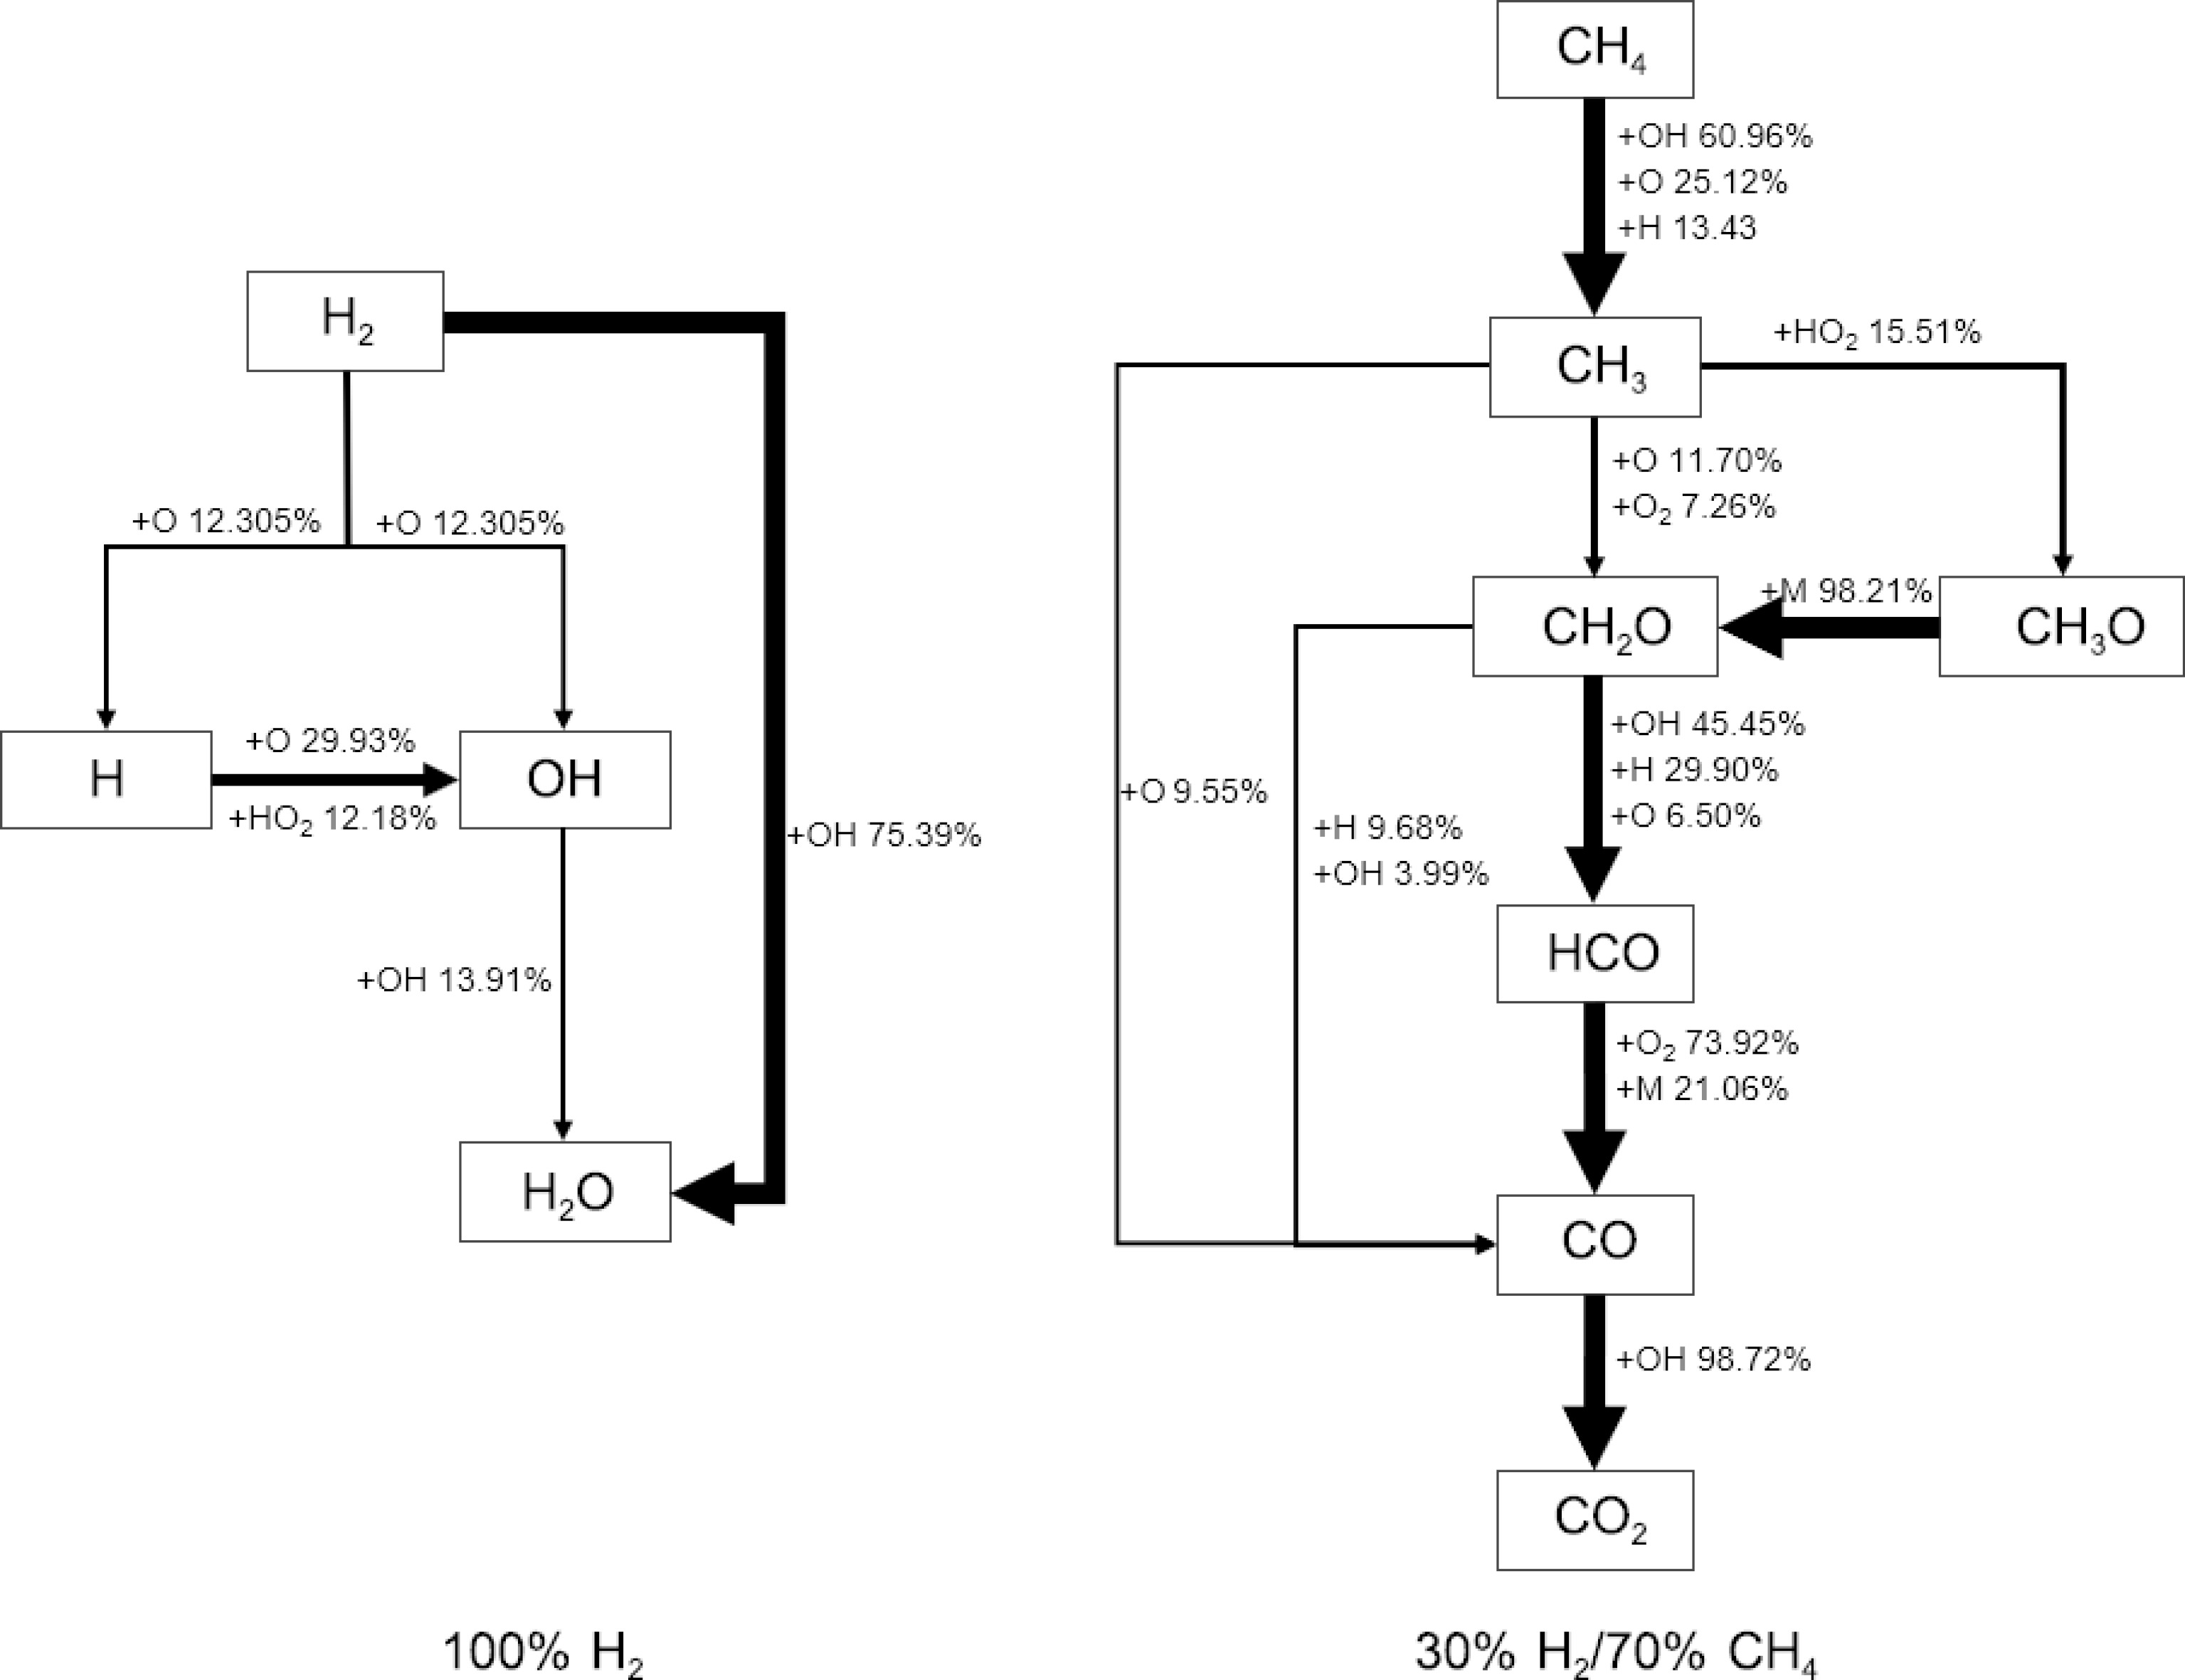
Figure 4.
Reaction pathways of 100% H2, and 30% H2/70% CH4 at 1,100 K, and 5.0 atm.
-
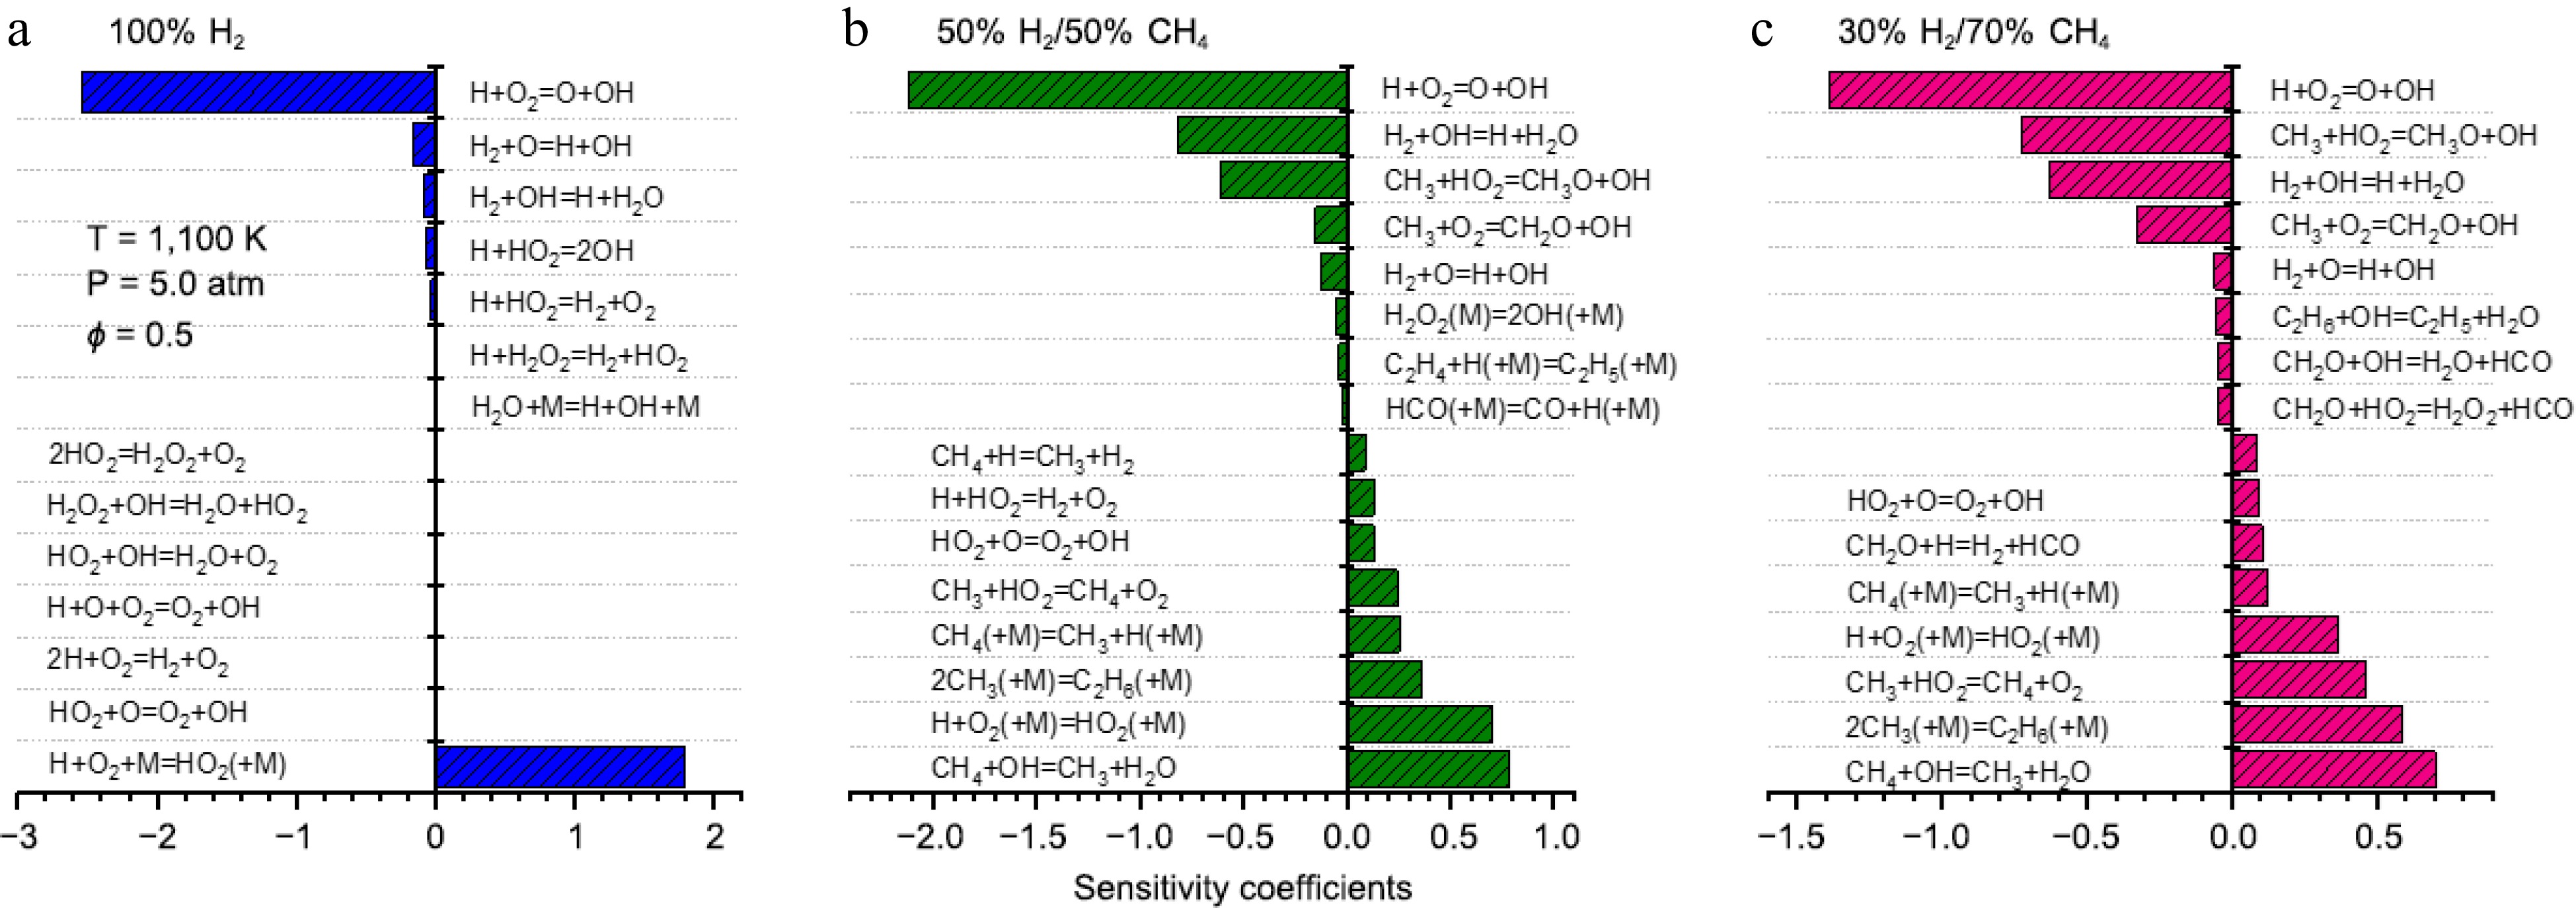
Figure 5.
Sensitivity analysis of IDTs for 100% H2, 50% H2/50% CH4, and 30% H2/70% CH4 under conditions of 1,100 K and 5.0 atm.
-
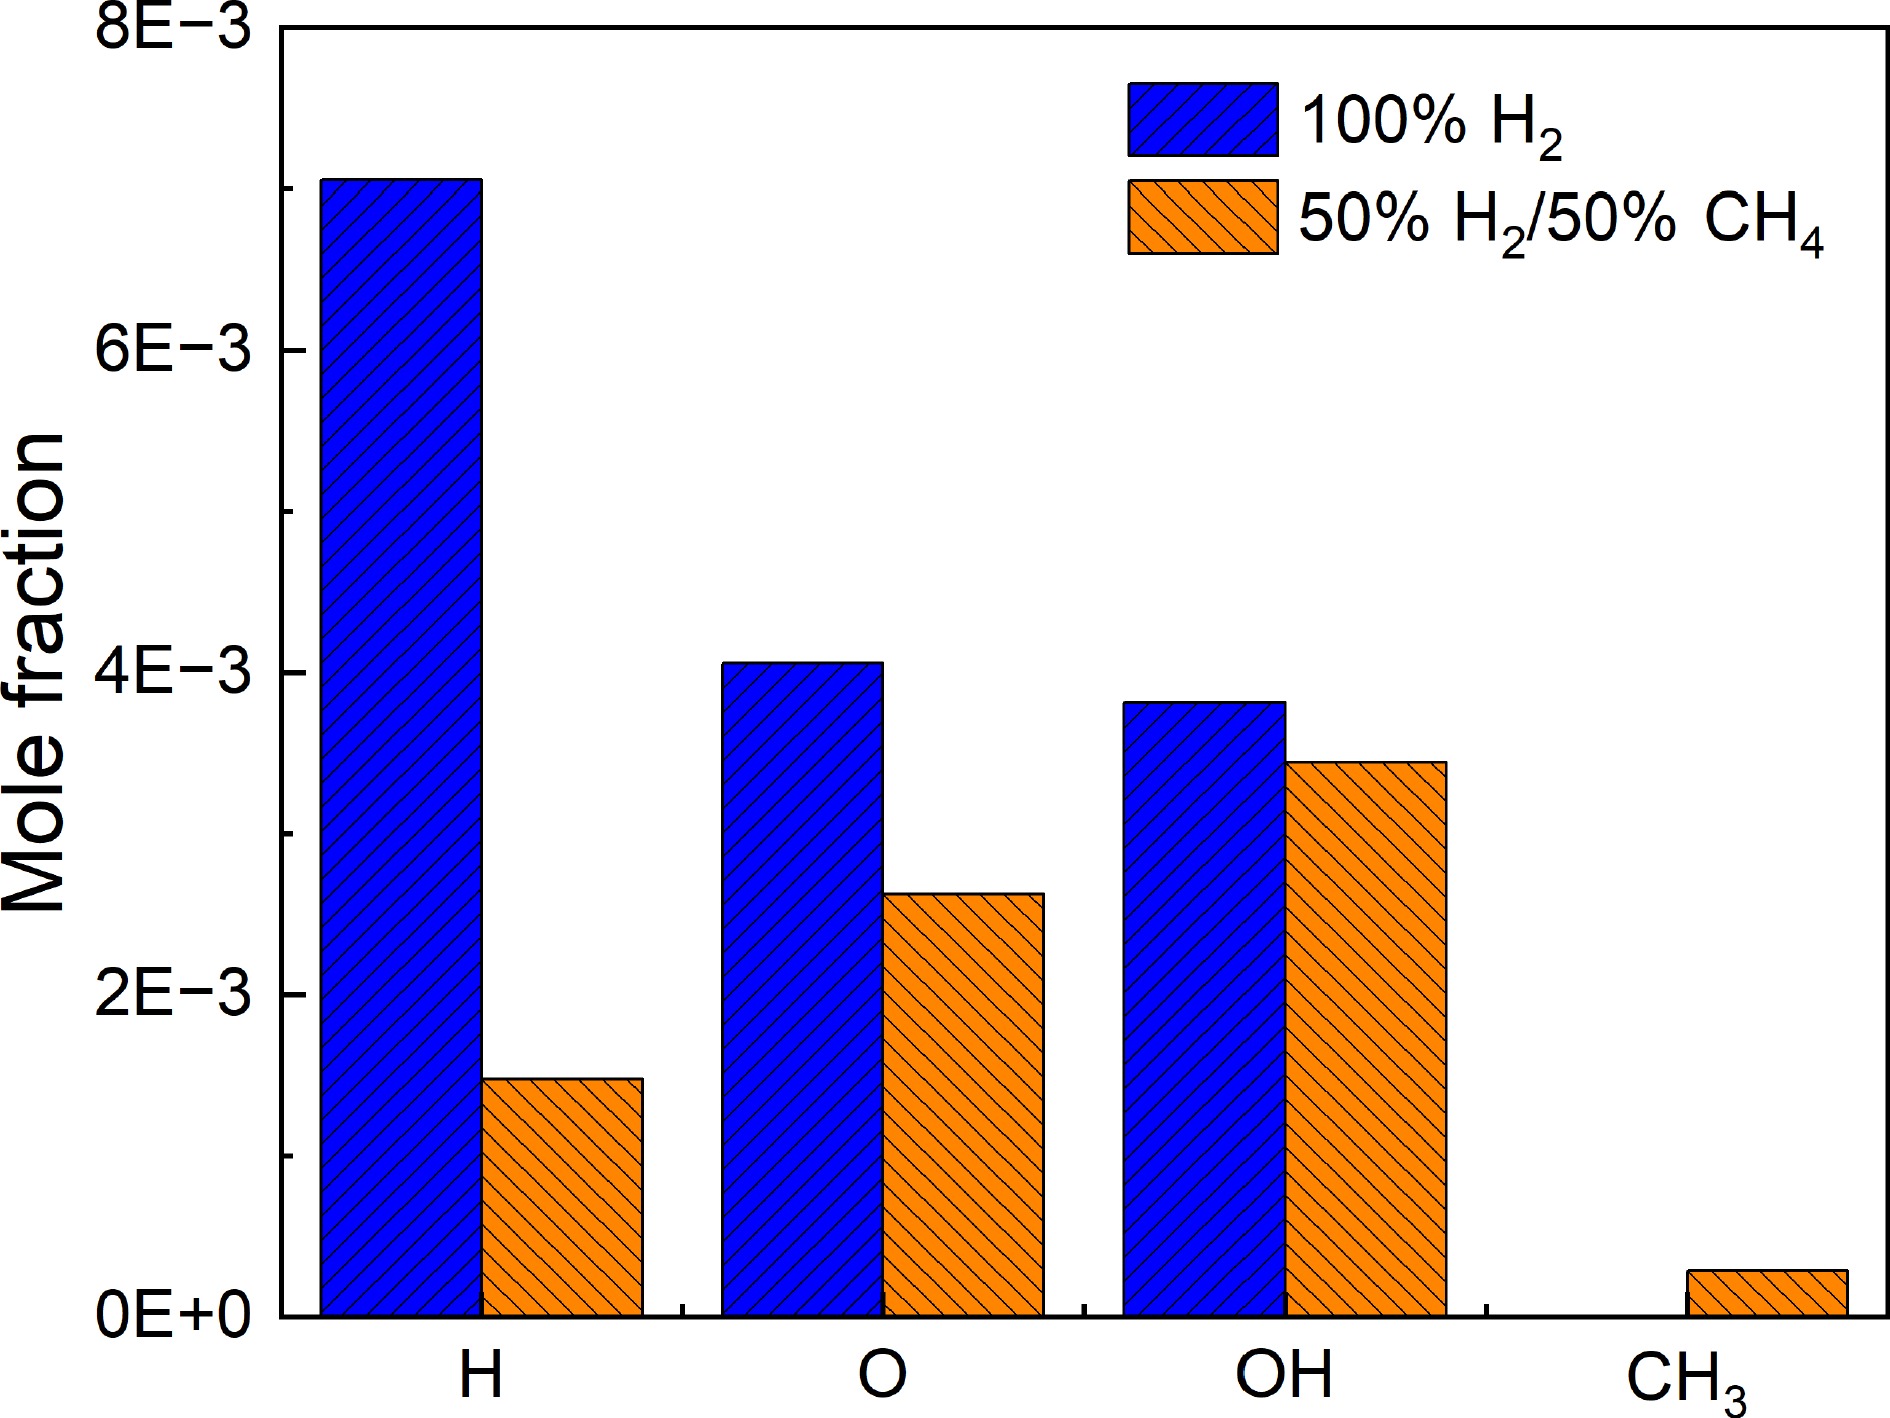
Figure 6.
Peak concentrations of H, O, OH, and CH3 radicals at 1,100 K and 5.0 atm for 100% H2 and 50% H2/50% CH4.
-
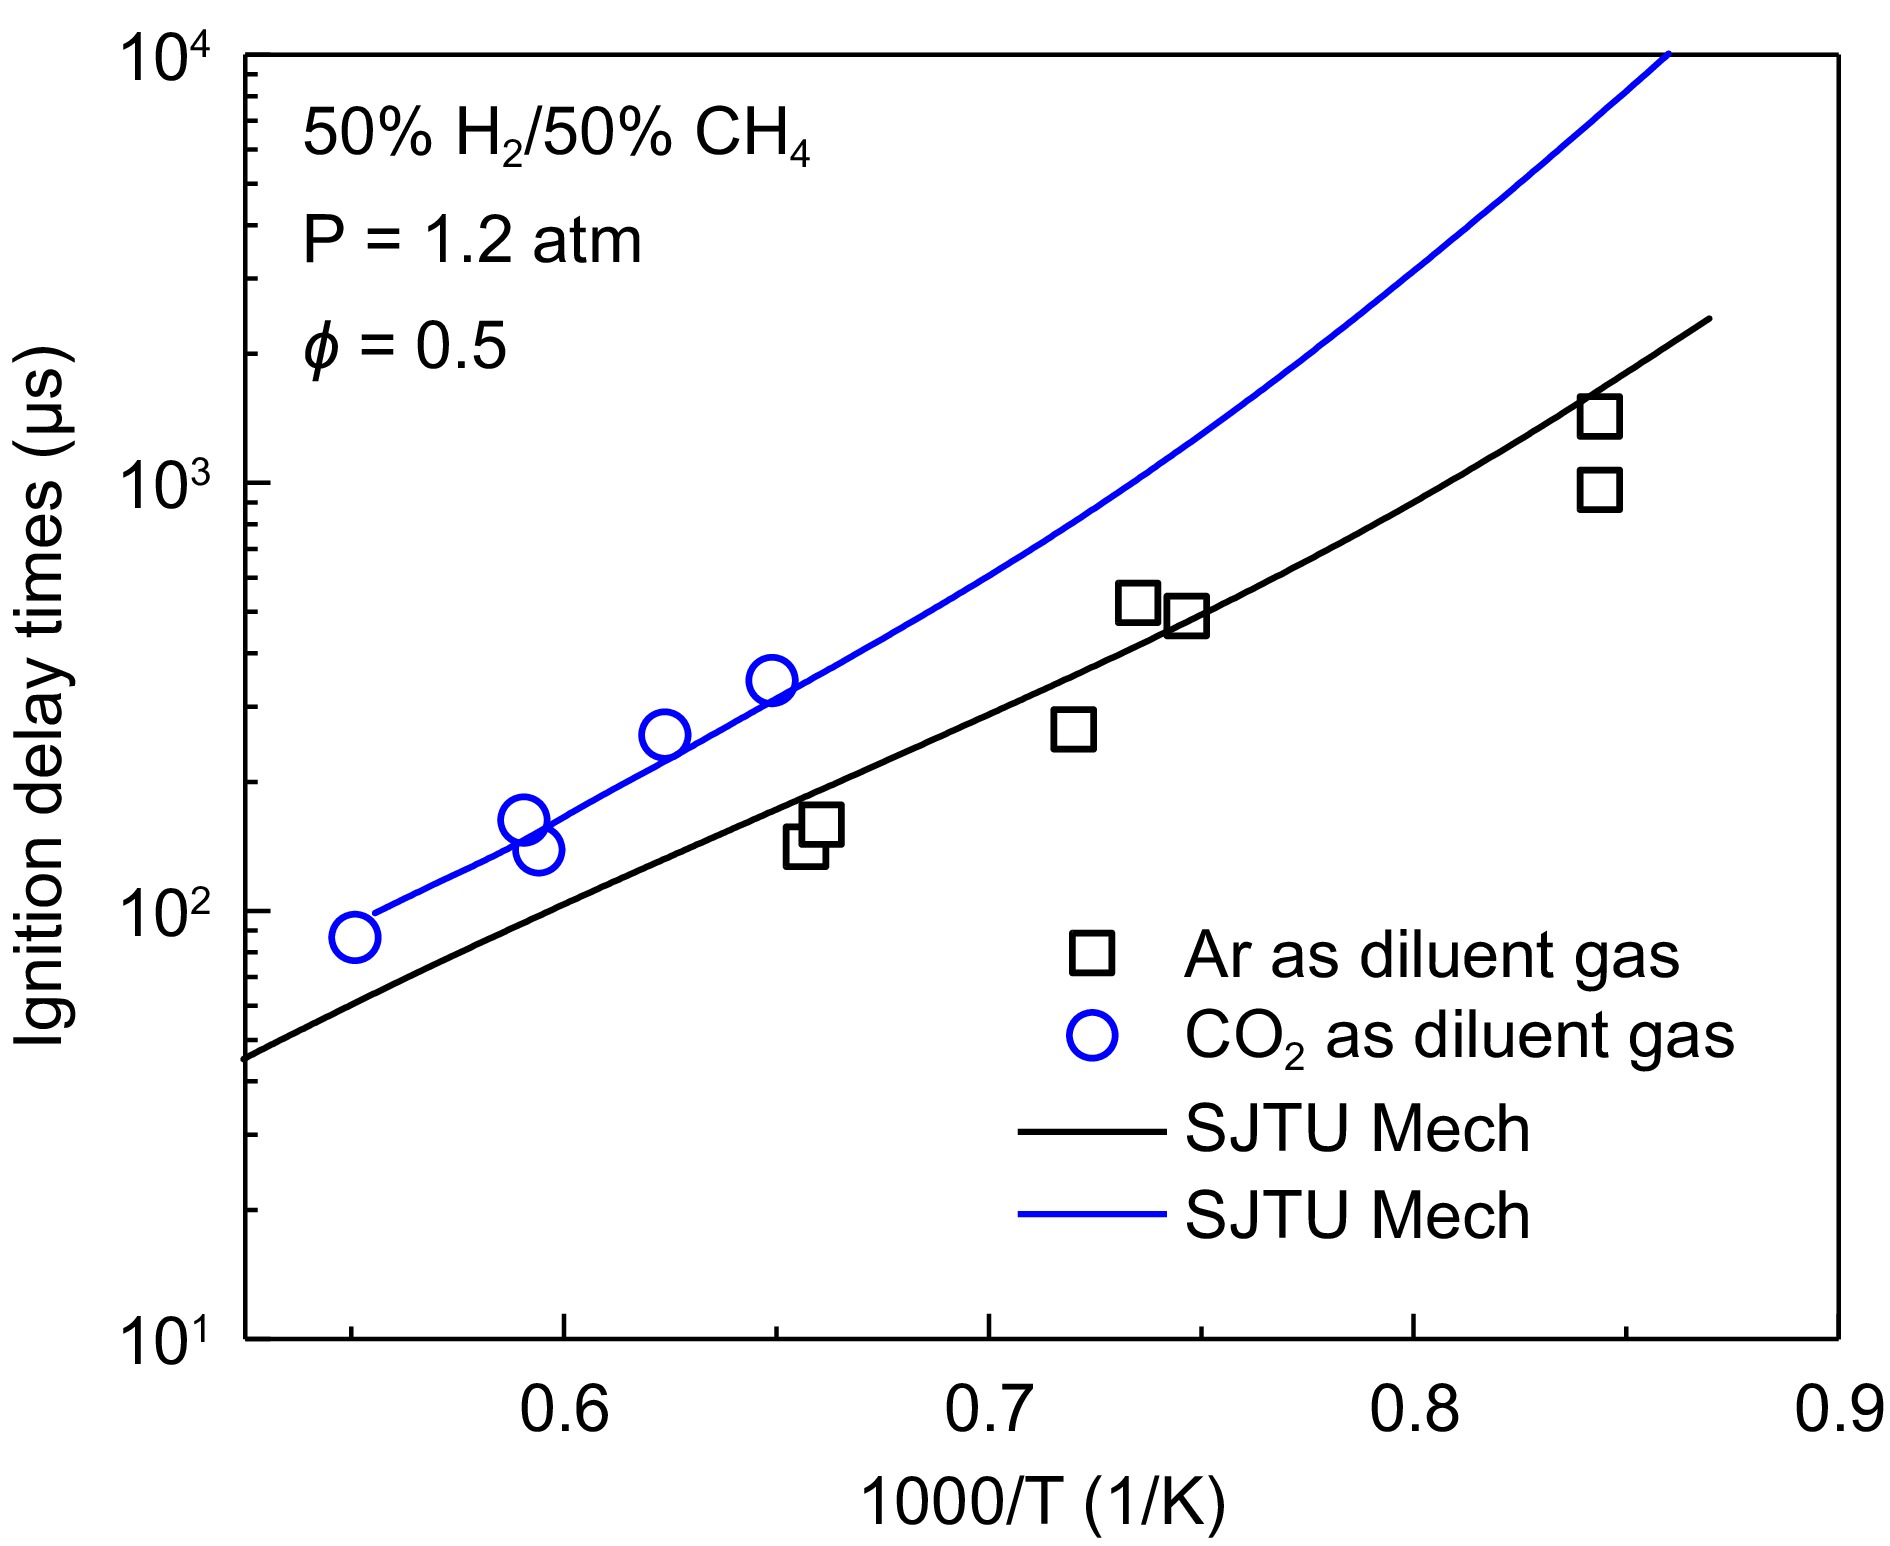
Figure 7.
Effect of CO2 on ignition delay times of 50% H2/50% CH4 mixture.
-
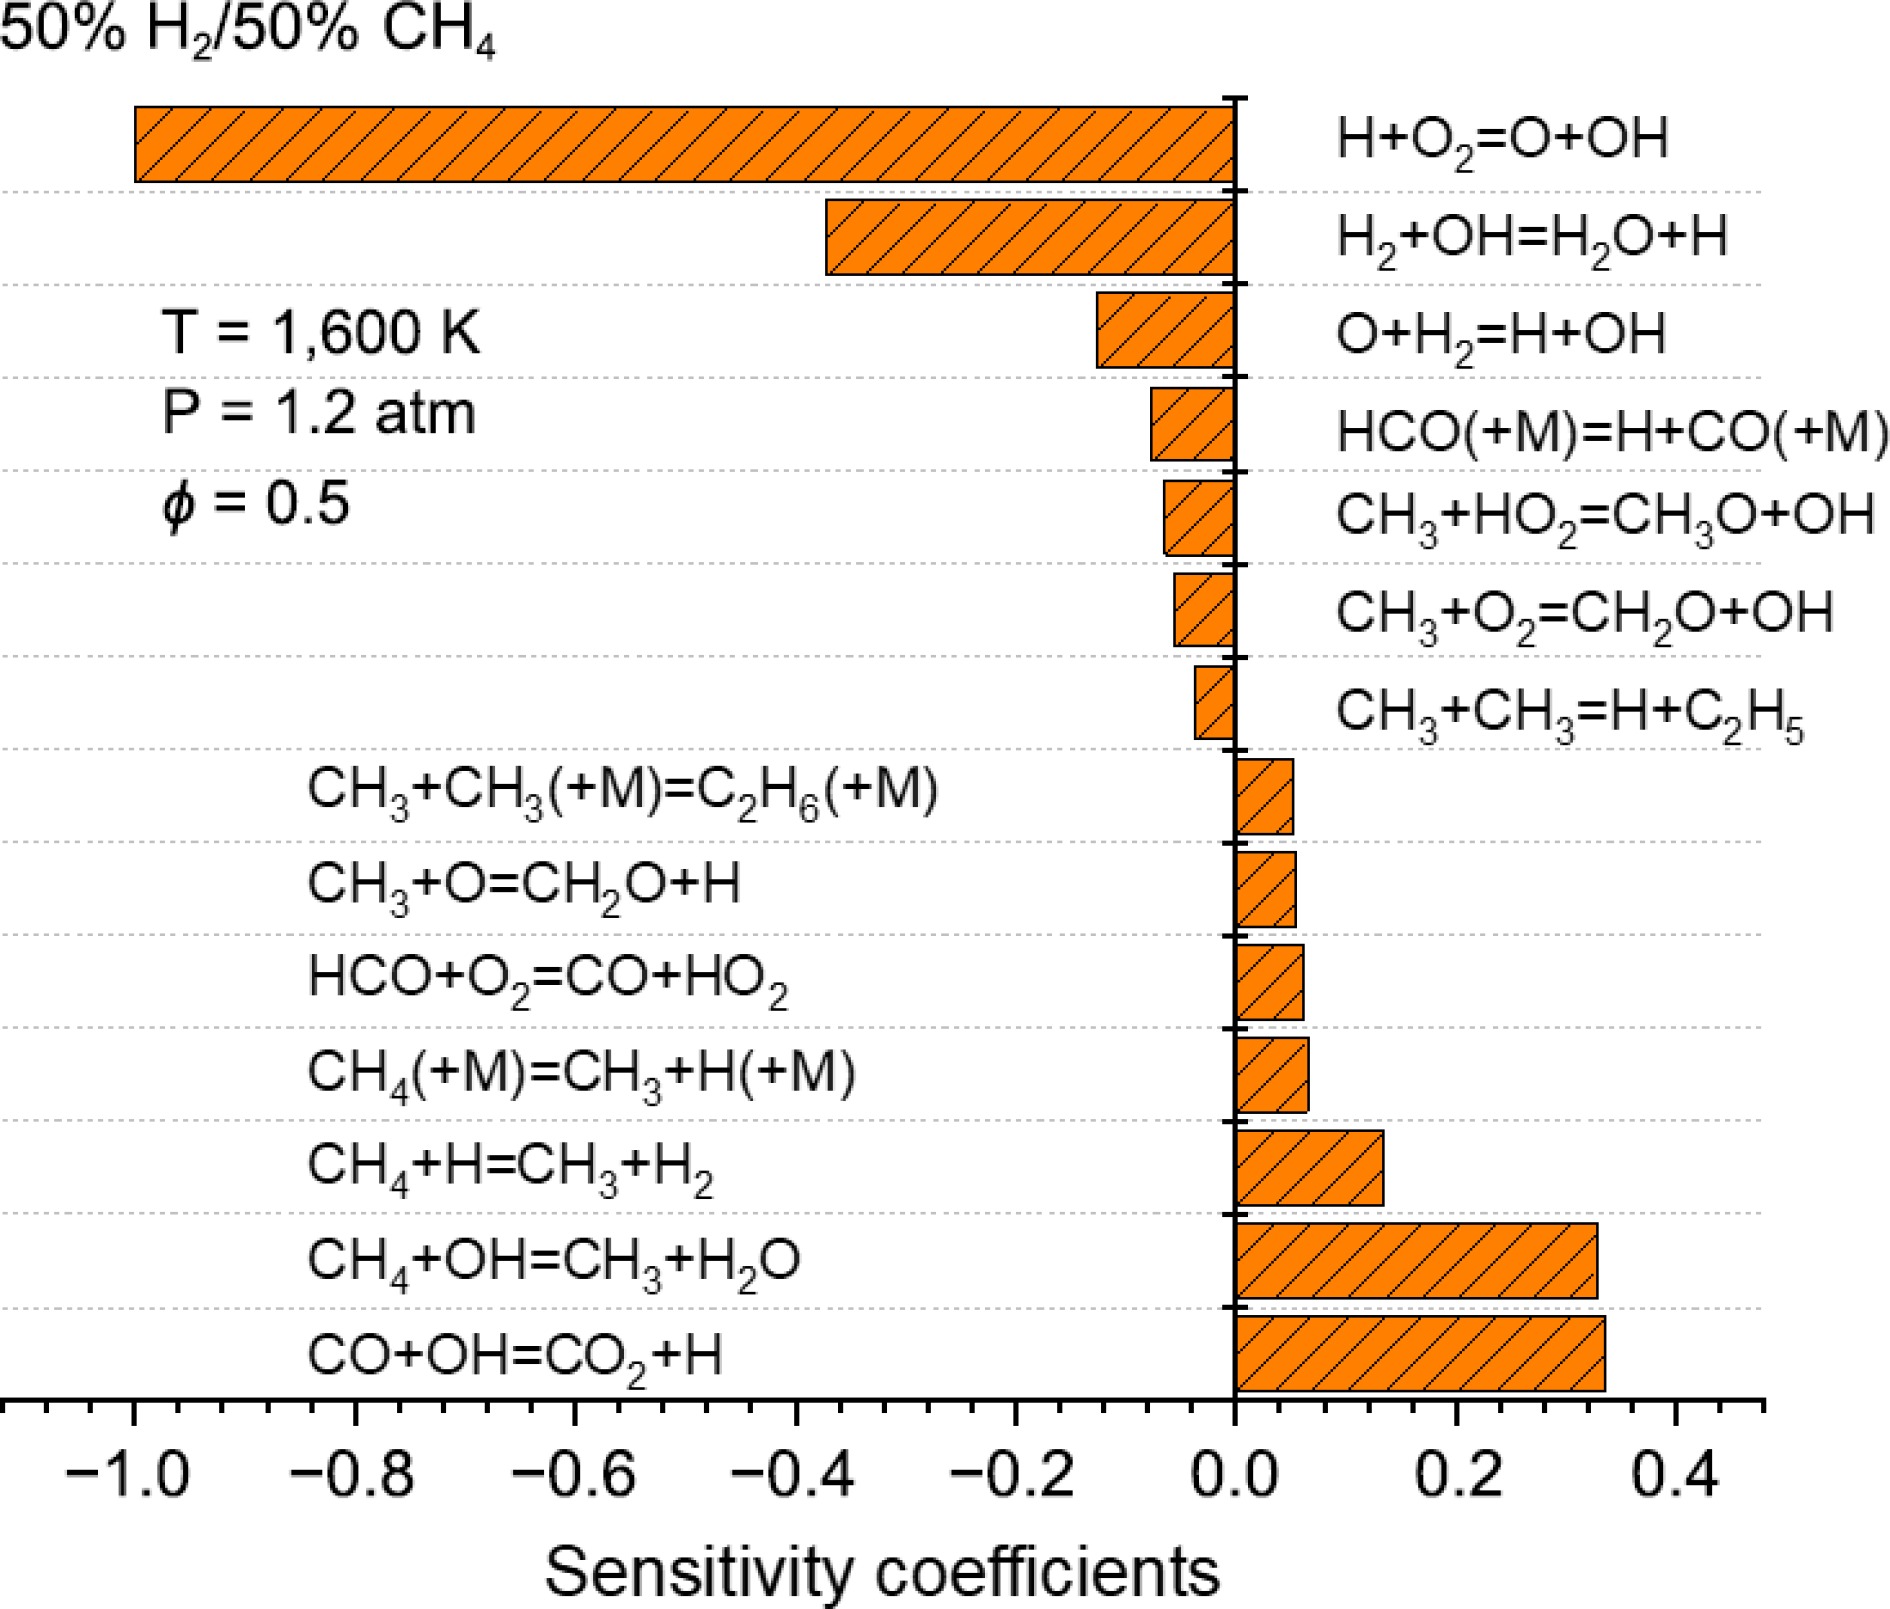
Figure 8.
Sensitivity coefficients of IDTs under CO2 atmosphere.
-
No. Equivalence ratio XH2/(XH2 + XCH4) H2 (%) CH4 (%) O2 (%) Dilution gas (%) Pressure (atm) 1 0.50 1.00 5.00 0.00 5.00 90.00 Ar 1.20 2 0.50 1.00 5.00 0.00 5.00 90.00 Ar 5.00 3 0.50 0.50 1.43 1.43 7.14 90.00 Ar 1.20 4 0.50 0.50 1.43 1.43 7.14 90.00 Ar 5.00 5 0.50 0.30 0.73 1.71 7.56 90.00 Ar 1.20 6 0.50 0.30 0.73 1.71 7.56 90.00 Ar 5.00 7 0.50 0.50 1.43 1.43 7.14 90.00 CO2 1.20 Table 1.
Experimental conditions for the ignition delay time measurements.
Figures
(8)
Tables
(1)