-
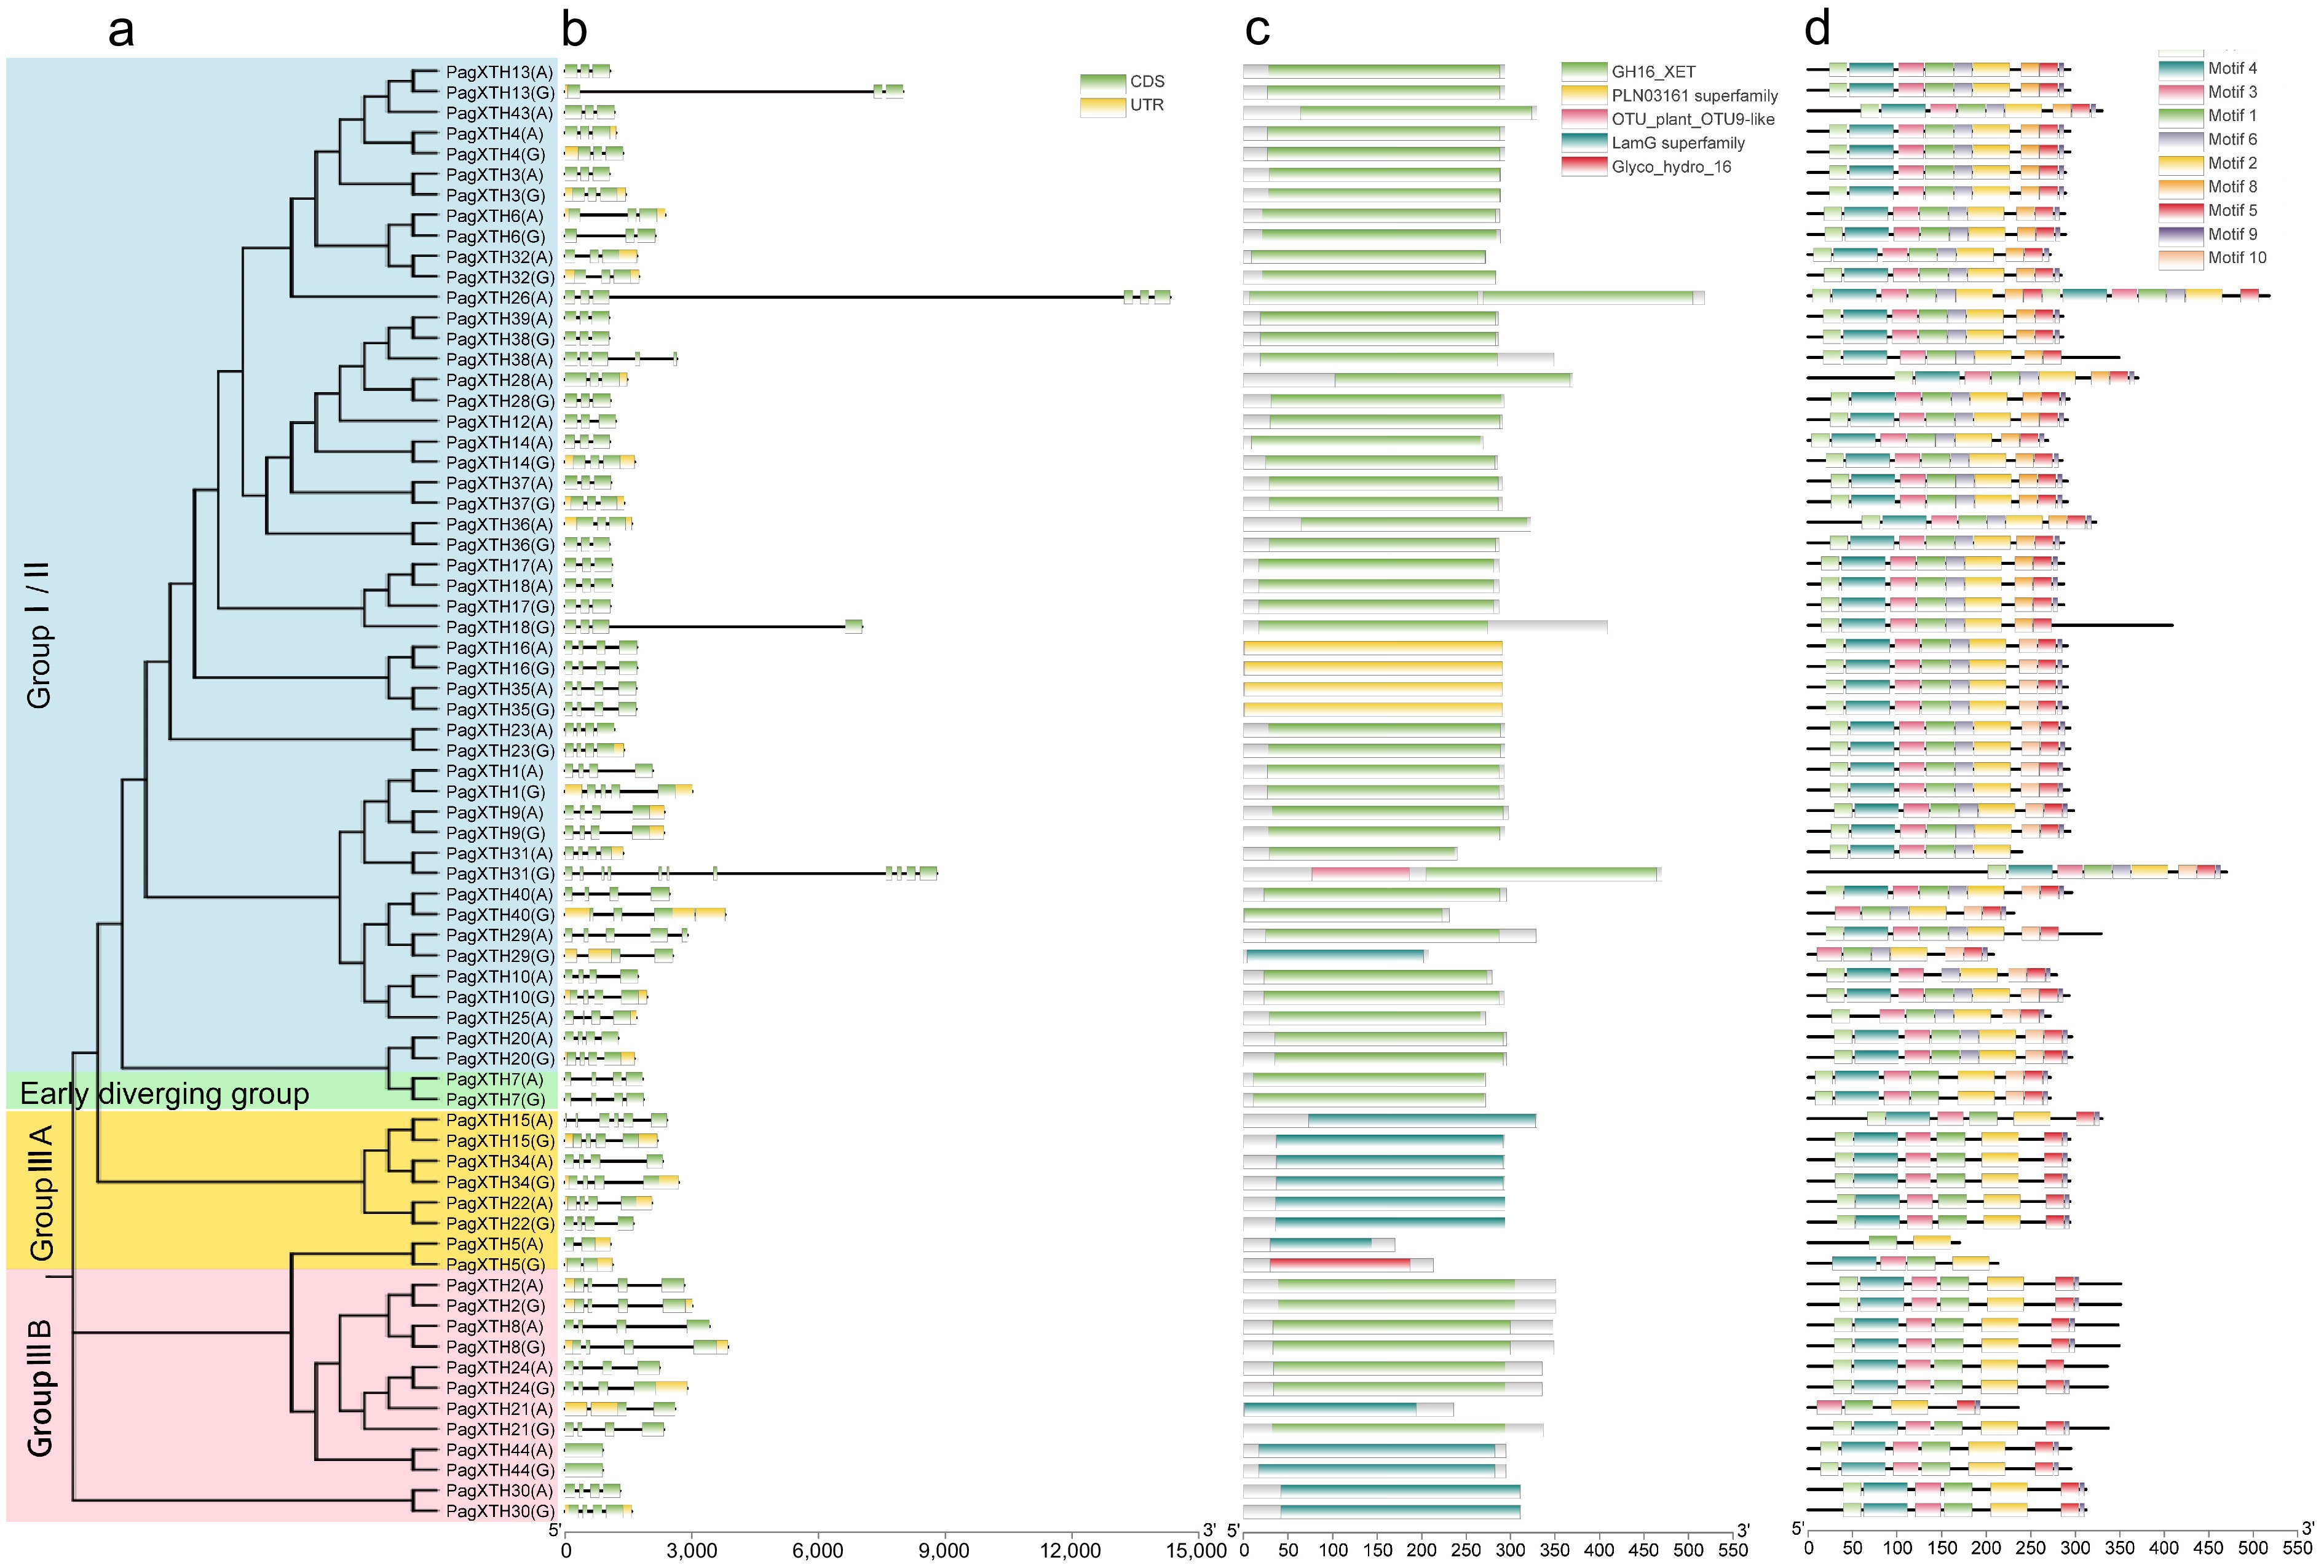
Figure 1.
Analysis of gene structure, protein domains, and conserved motifs in the XTH gene family in poplar. (a) Phylogenetic tree of PagXTHs the maximum likelihood (ML) method with 100 ultrafast bootstrap replications. (b) Gene structures of PagXTHs. Exons, introns, and UTR regions are represented by green rectangles, gray lines, and yellow rectangles, respectively. (c) Colored rectangular blocks illustrate the conserved domains within the XTH proteins. (d) Conserved motifs identified by MEME, different colored blocks represent various motifs.
-
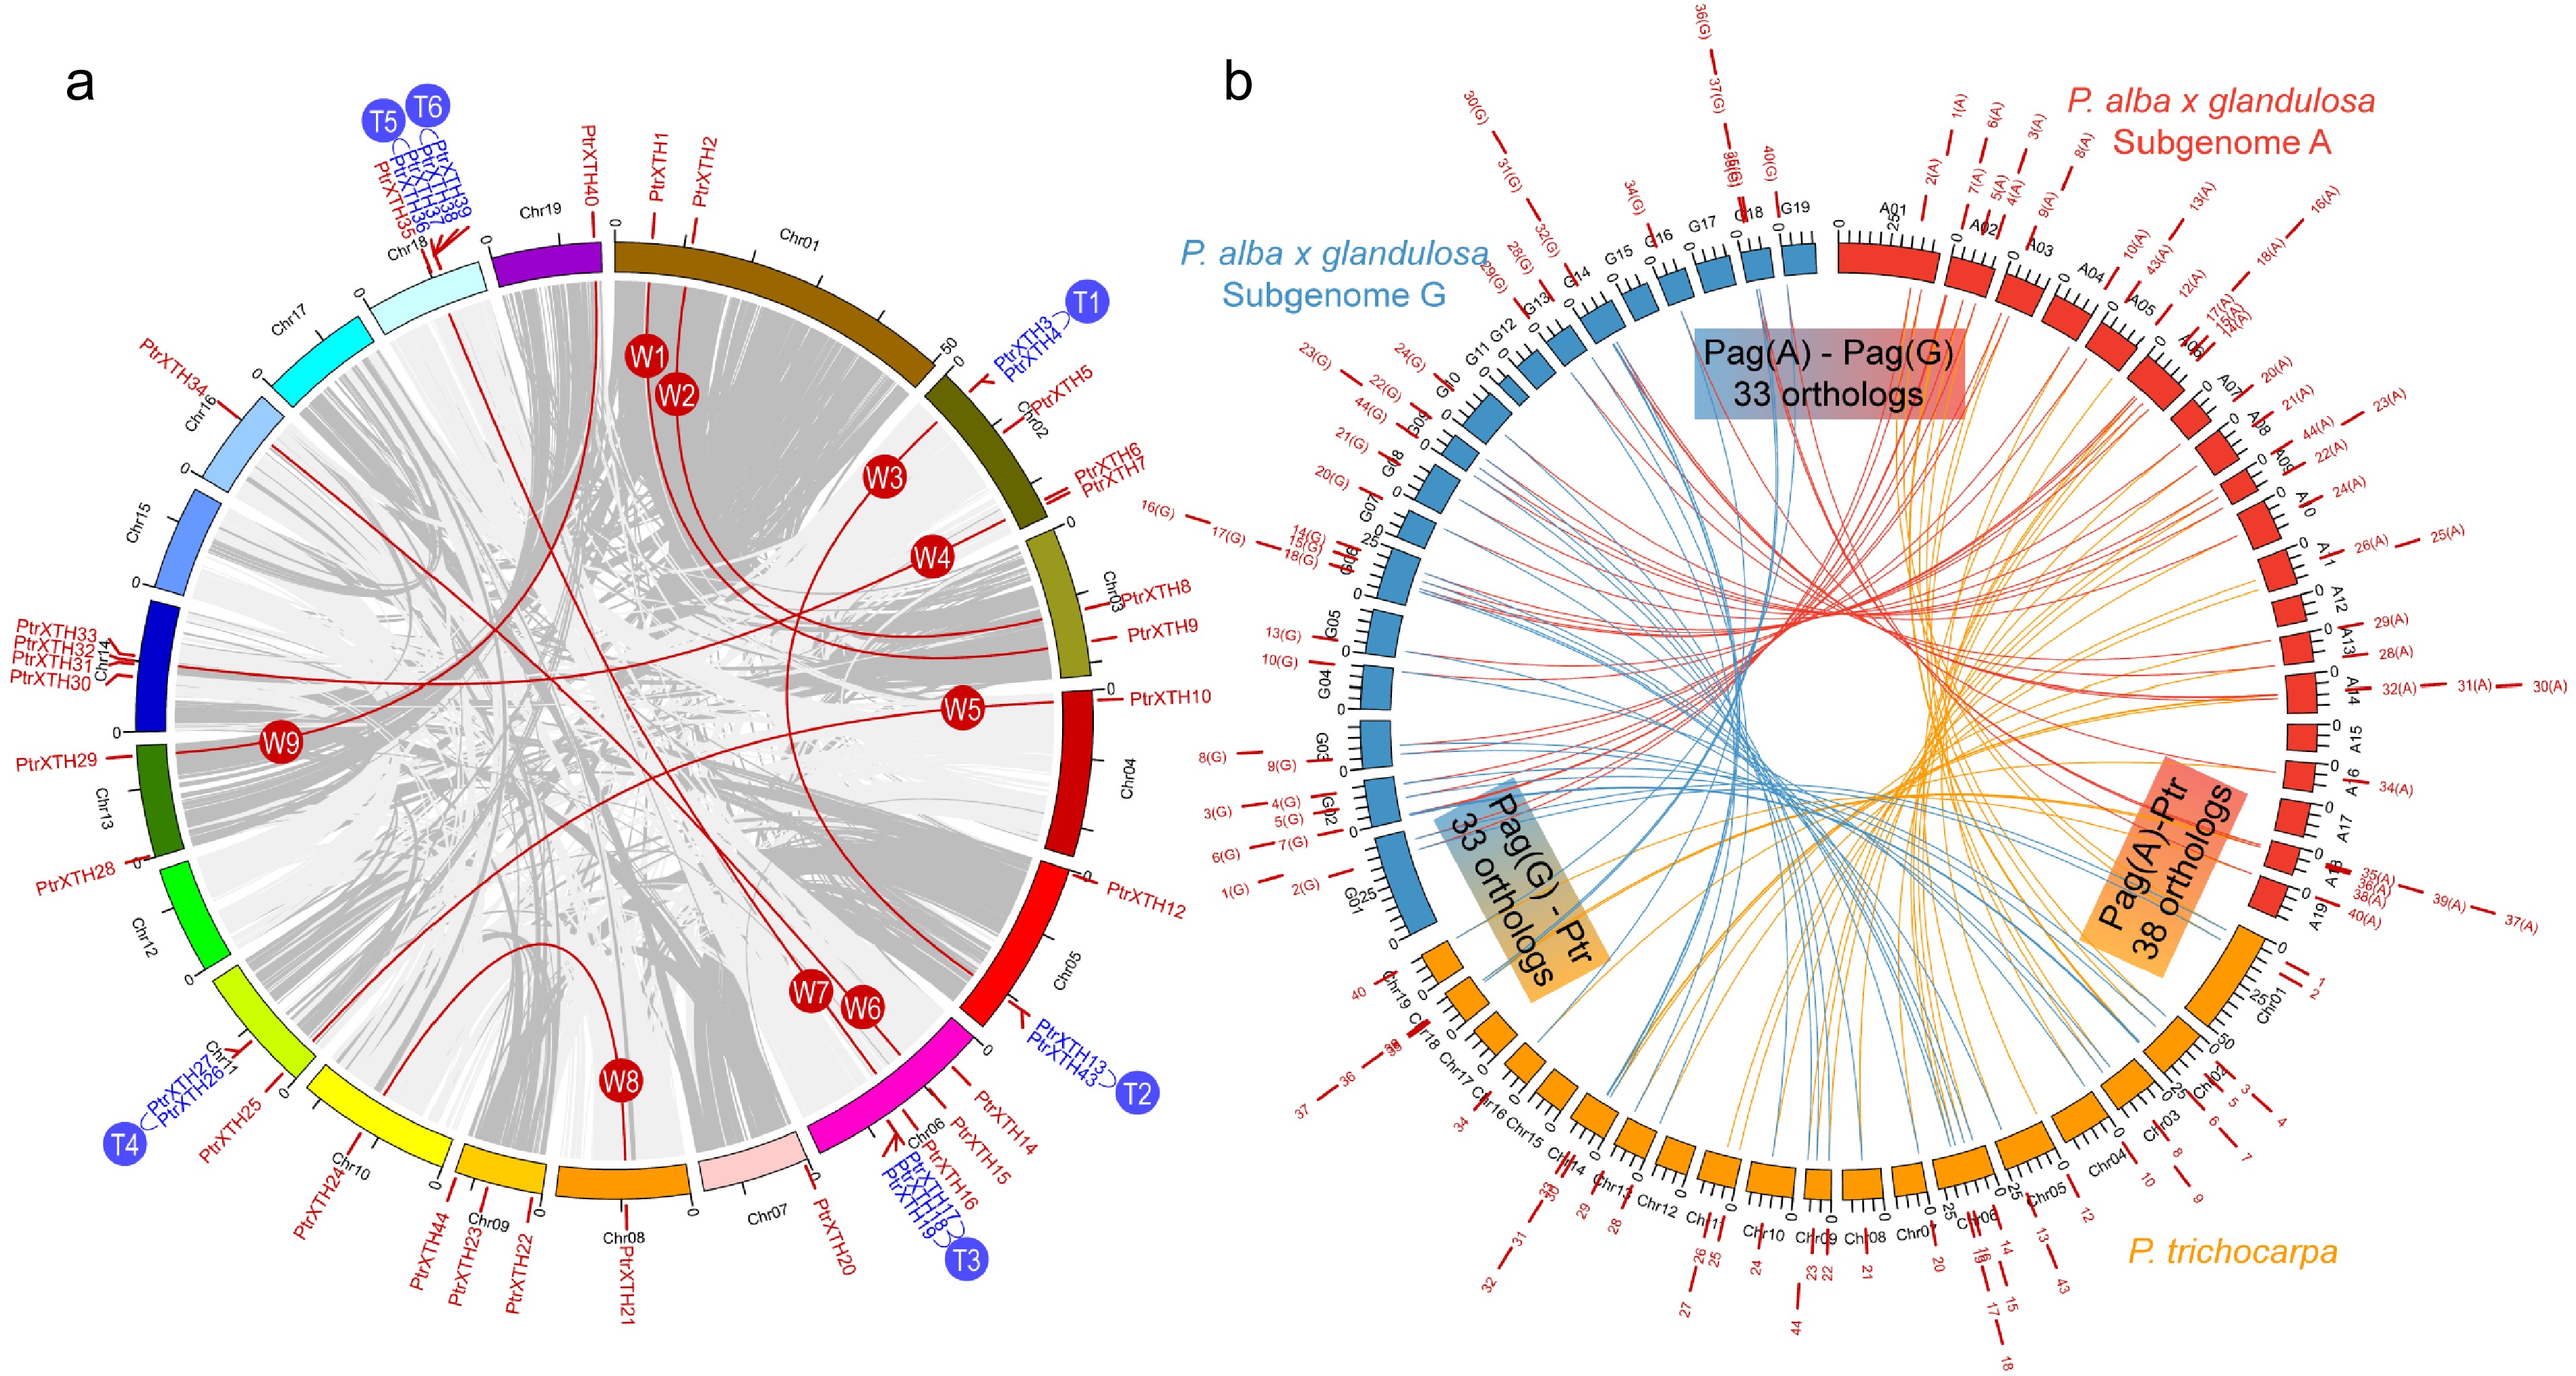
Figure 2.
Genomic location and gene duplication of the XTH genes in the poplar genome. (a) Genomic location and gene duplication of the XTH genes in the P. trichocarpa genome. The XTH paralogous pairs were generated by the whole-genome duplication events (W1−W9) or tandem duplication events (T1−T6). (b) Collinearity analysis reveals the orthologous relationship of XTH genes between the genome of P. trichocarpa and two subgenomes (A and G) of Populus alba × glandulosa '84K'.
-
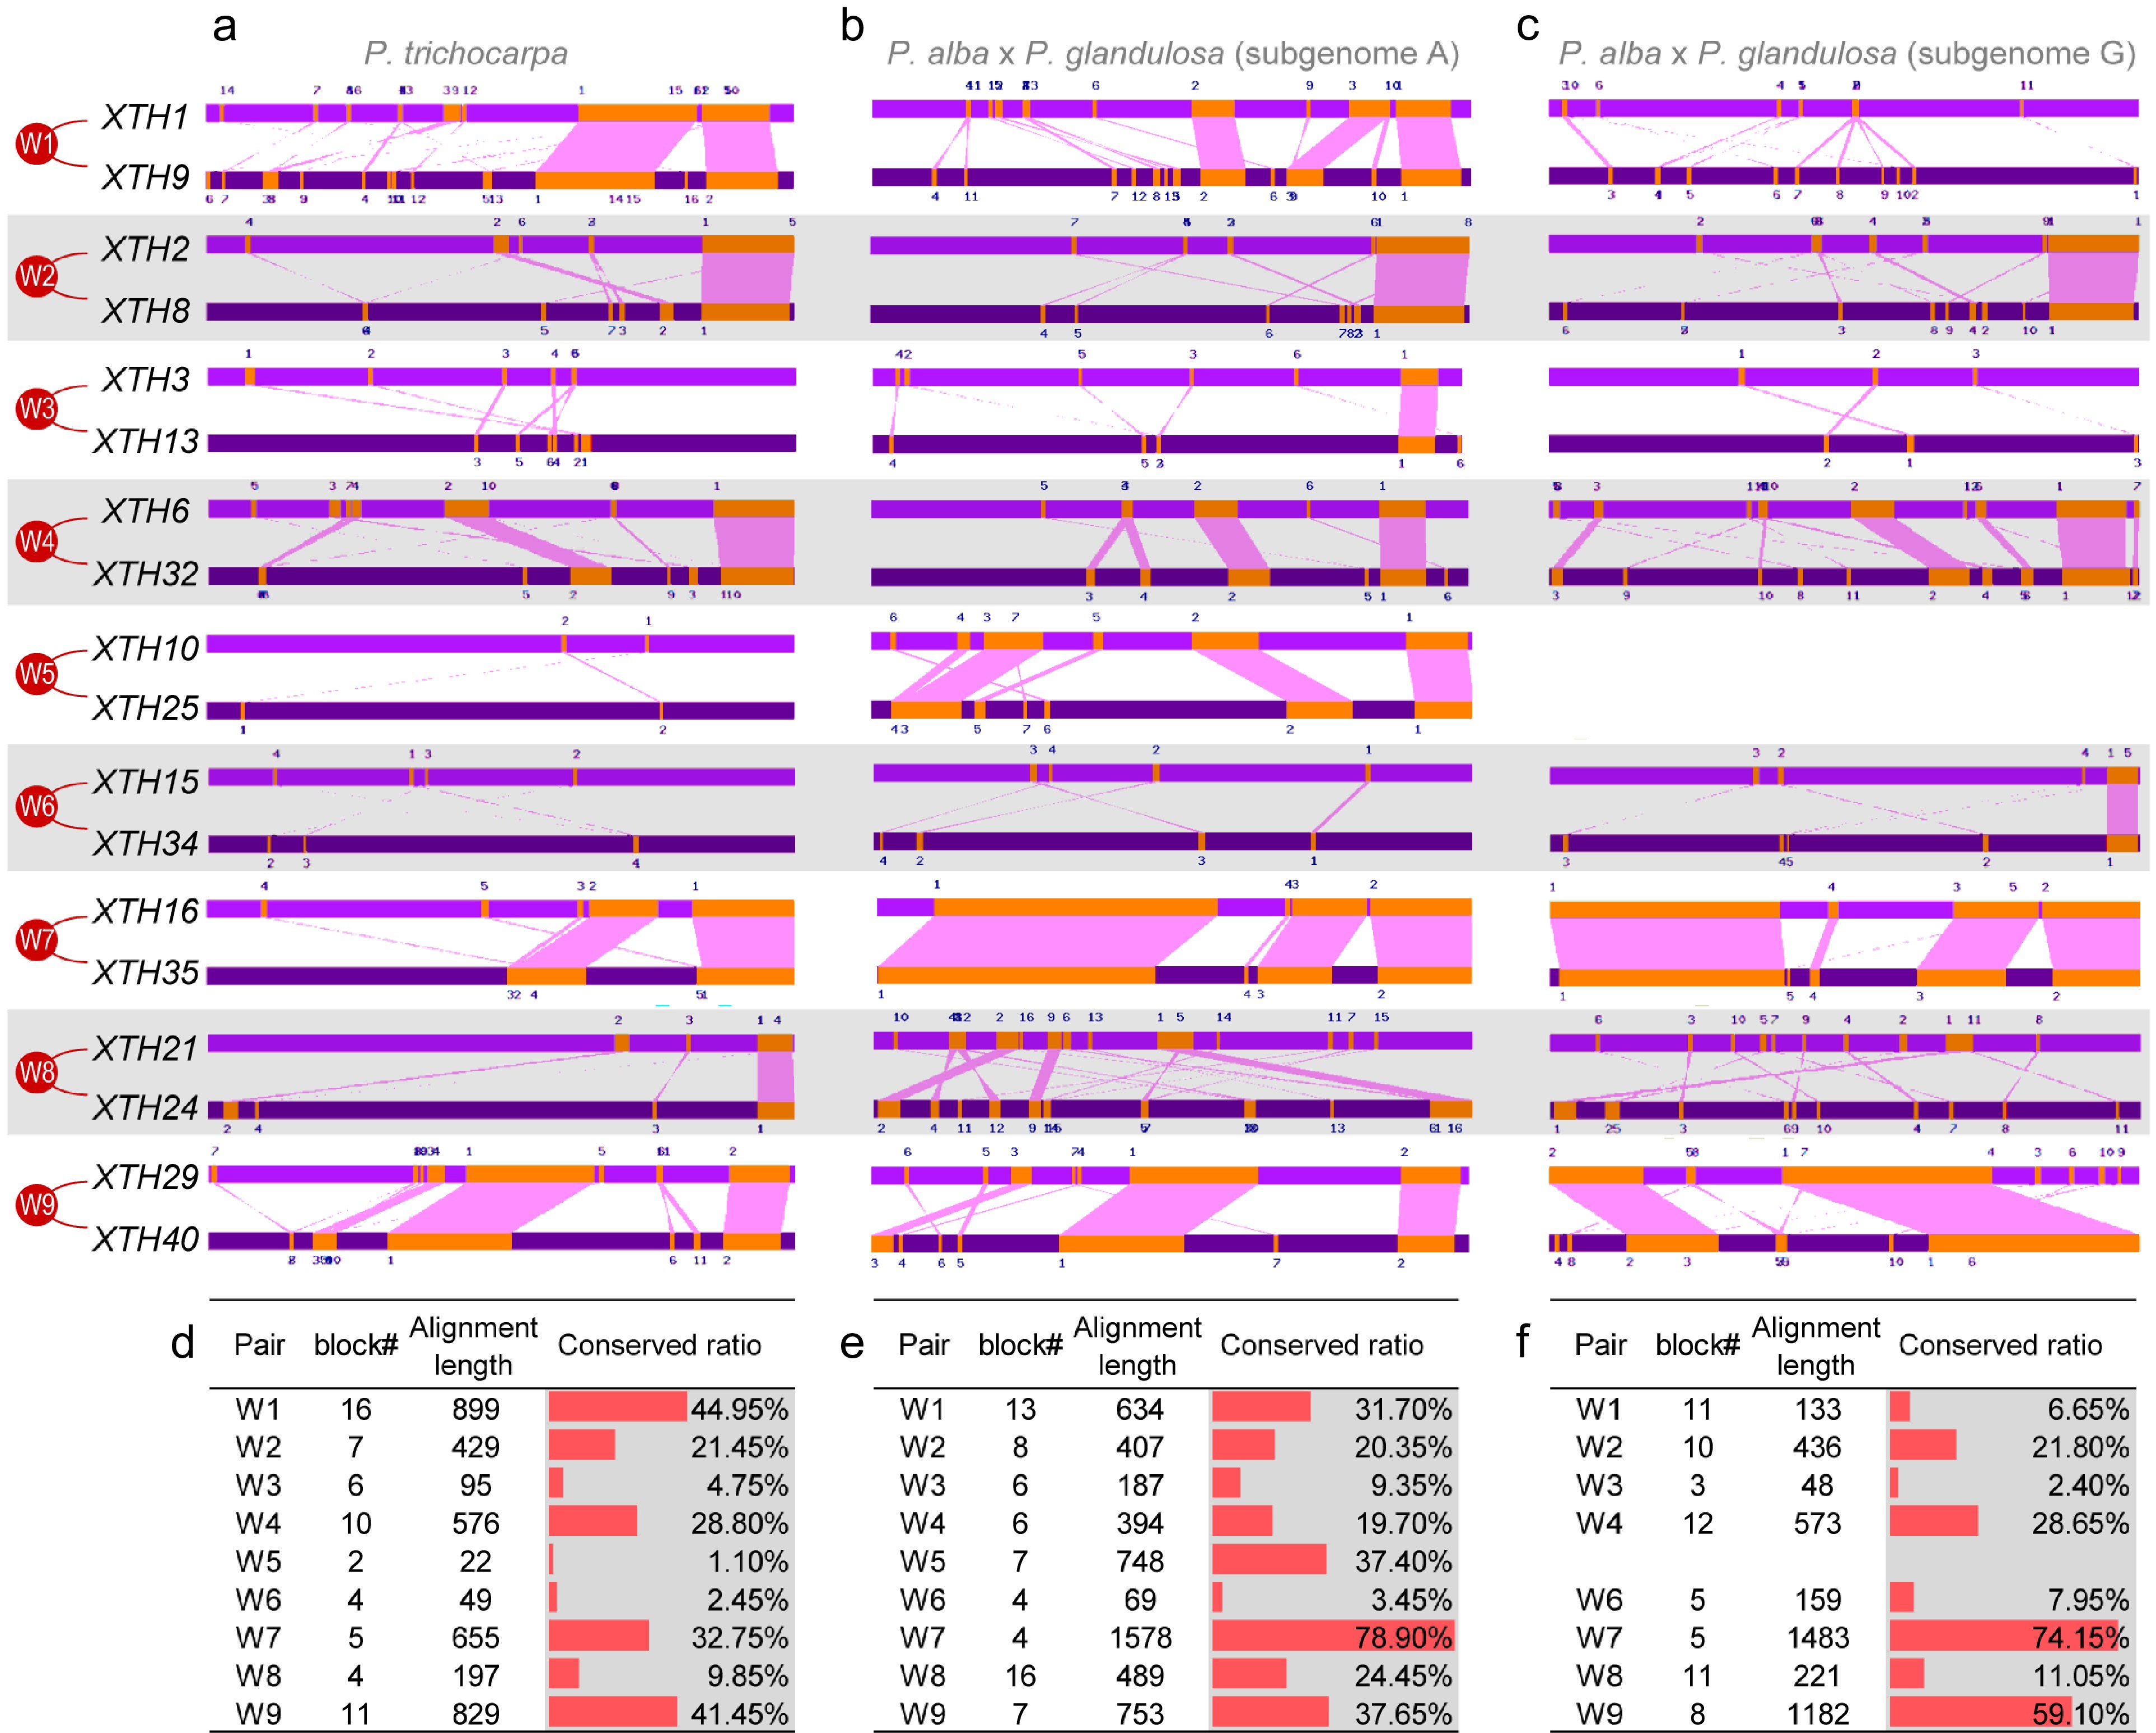
Figure 3.
The promoter similarity between paralogous pairs of PtrXTHs and PagXTHs. (a)−(c) Conserved blocks located in the promoter region of the XTH paralogous pairs in P. trichocarpa genome, Populus alba × glandulosa subgenome A, and subgenome G, respectively. (d)−(f) Conserved block number, alignment length and repetition rate between the promoter of XTH paralogous pairs in P. trichocarpa genome, Populus alba × glandulosa subgenome A, and subgenome G, respectively.
-
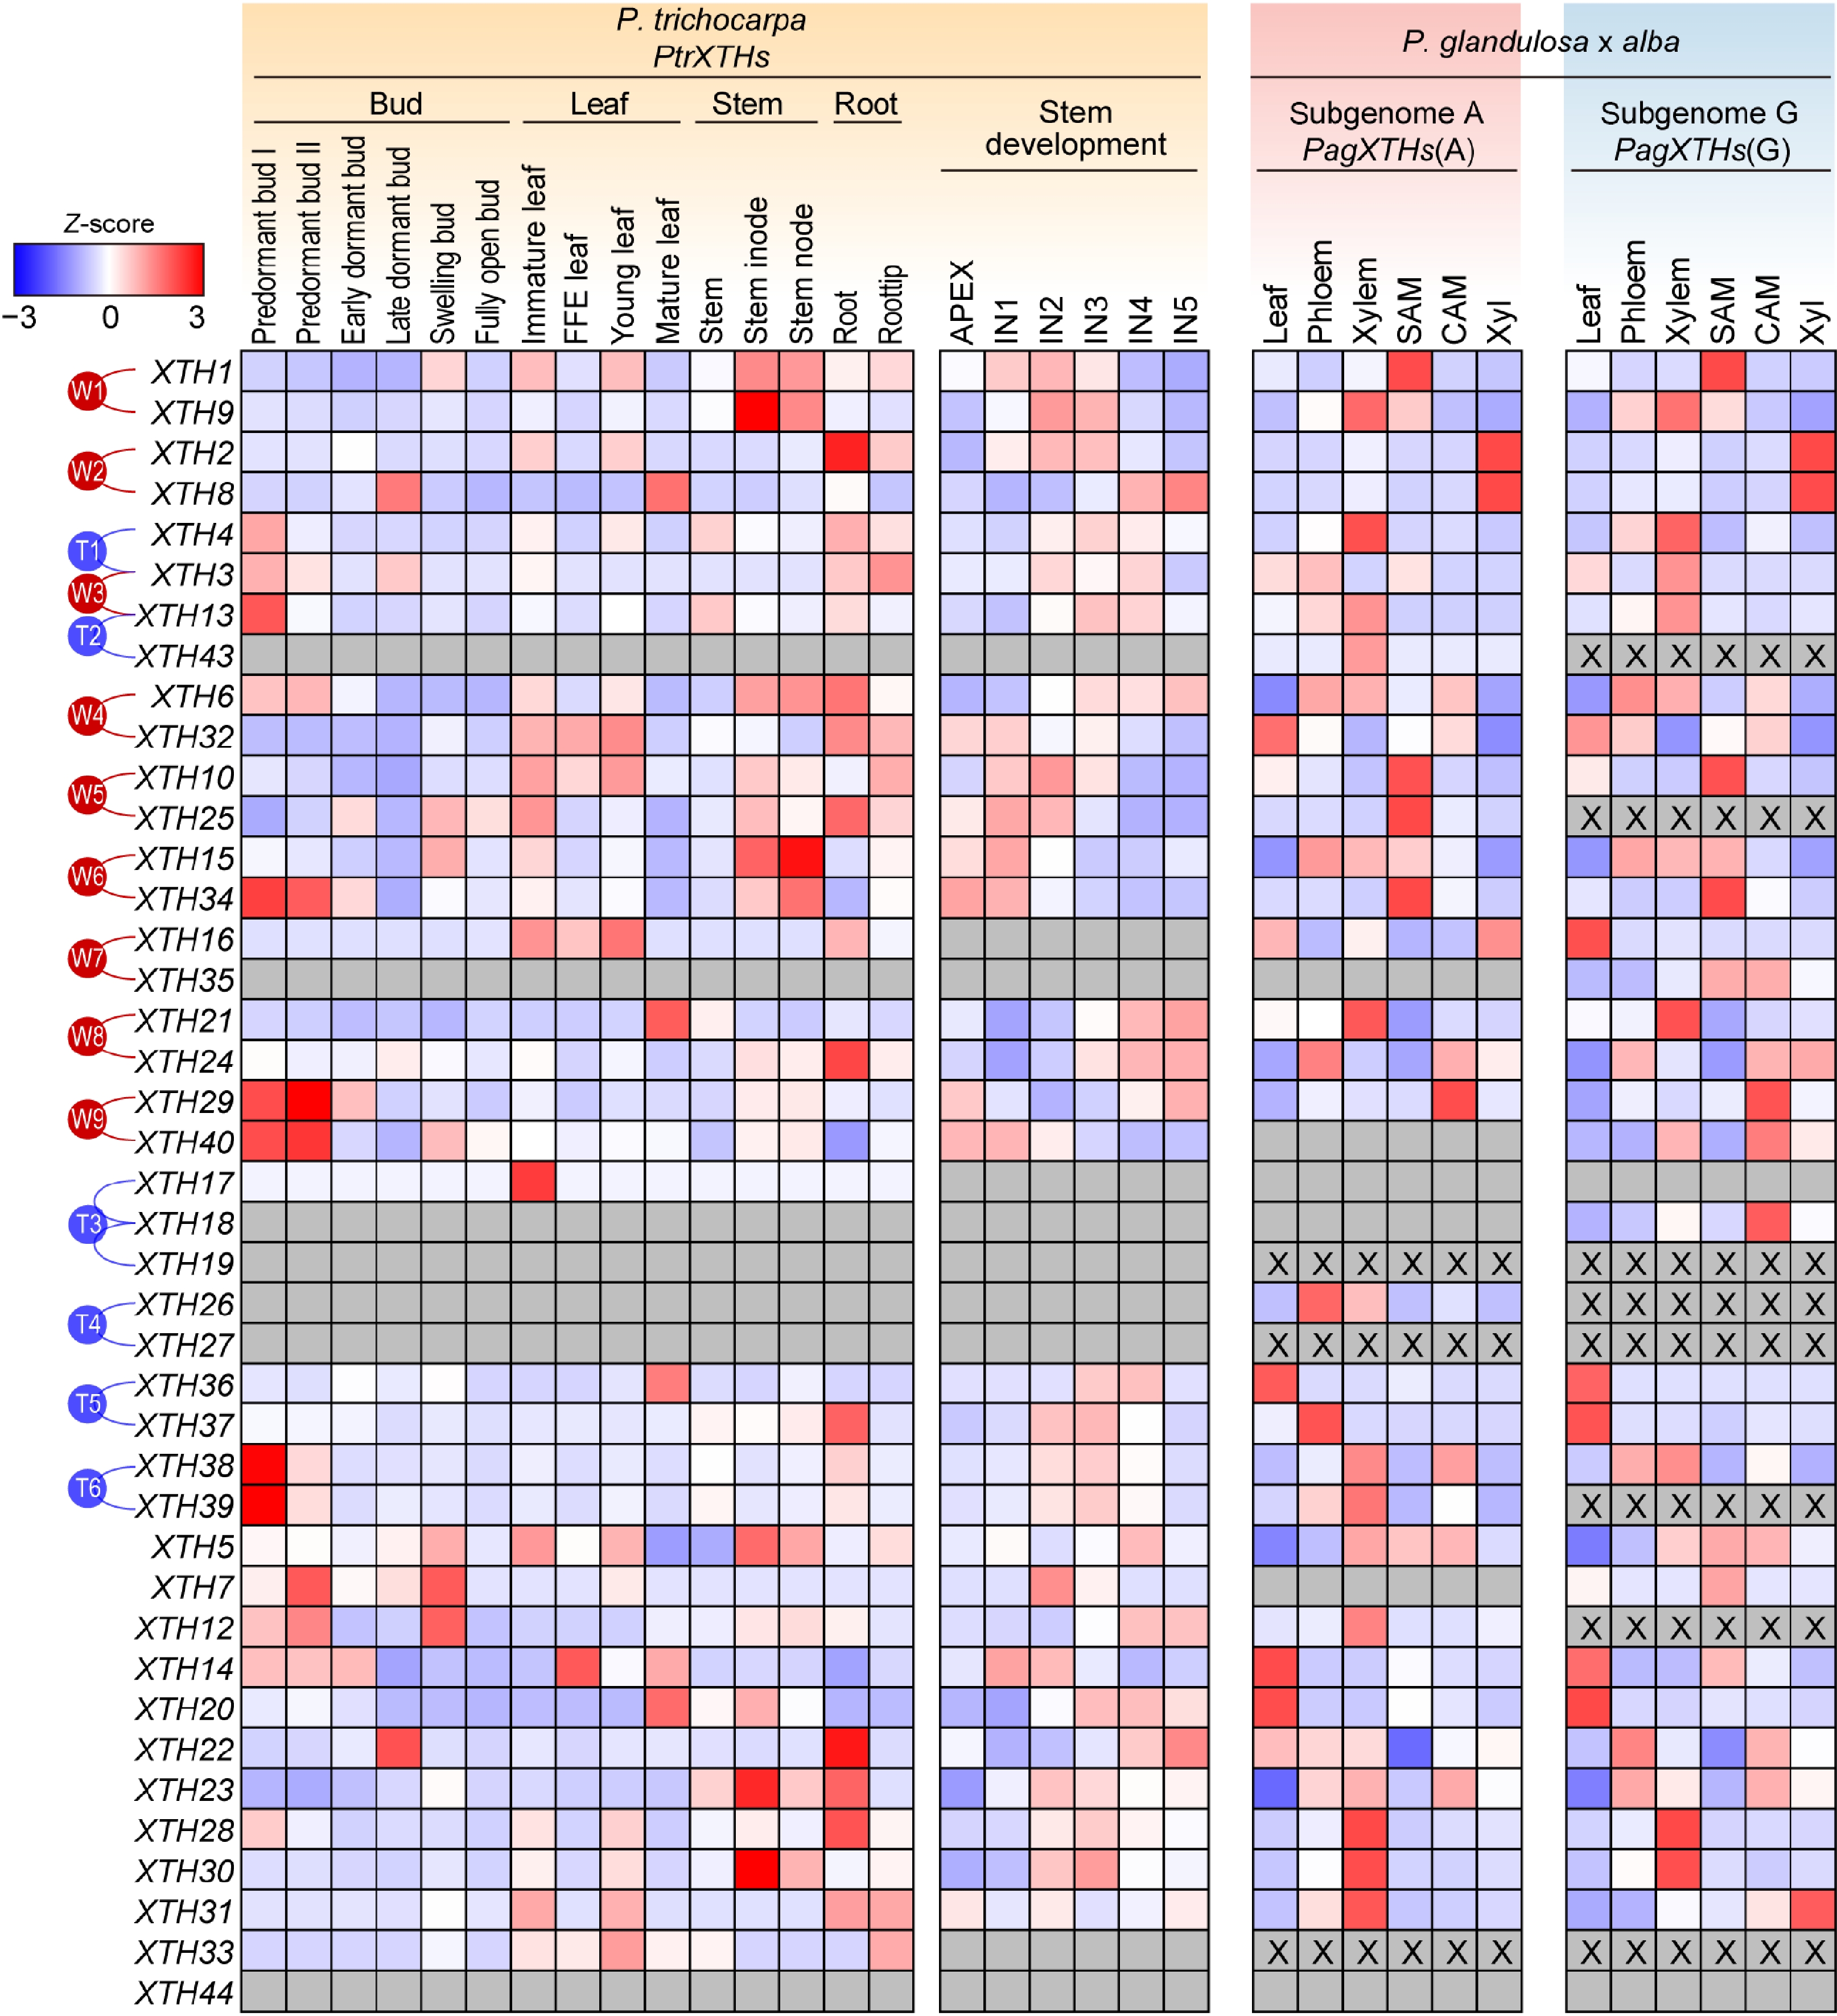
Figure 4.
The expression patterns of PtrXTHs and PagXTHs across various tissues. The expression data including bud, leaf, and stem were obtained from Populus Gene Expression Atlas and NCBI Bioprojects (PRJNA526157 and PRJNA736374). Gene expression was normalized by Z-score. Blue and red represent low and high expression, respectively. The gray boxes indicate that gene expression was not detected, and 'X' within the box represent the absence of a corresponding XTH gene in this subgenome. The paralogous genes generated by the whole-genome duplication events (W1−W9) or the tandem duplication events (T1−T6) are marked with red or blue lines on the left.
-
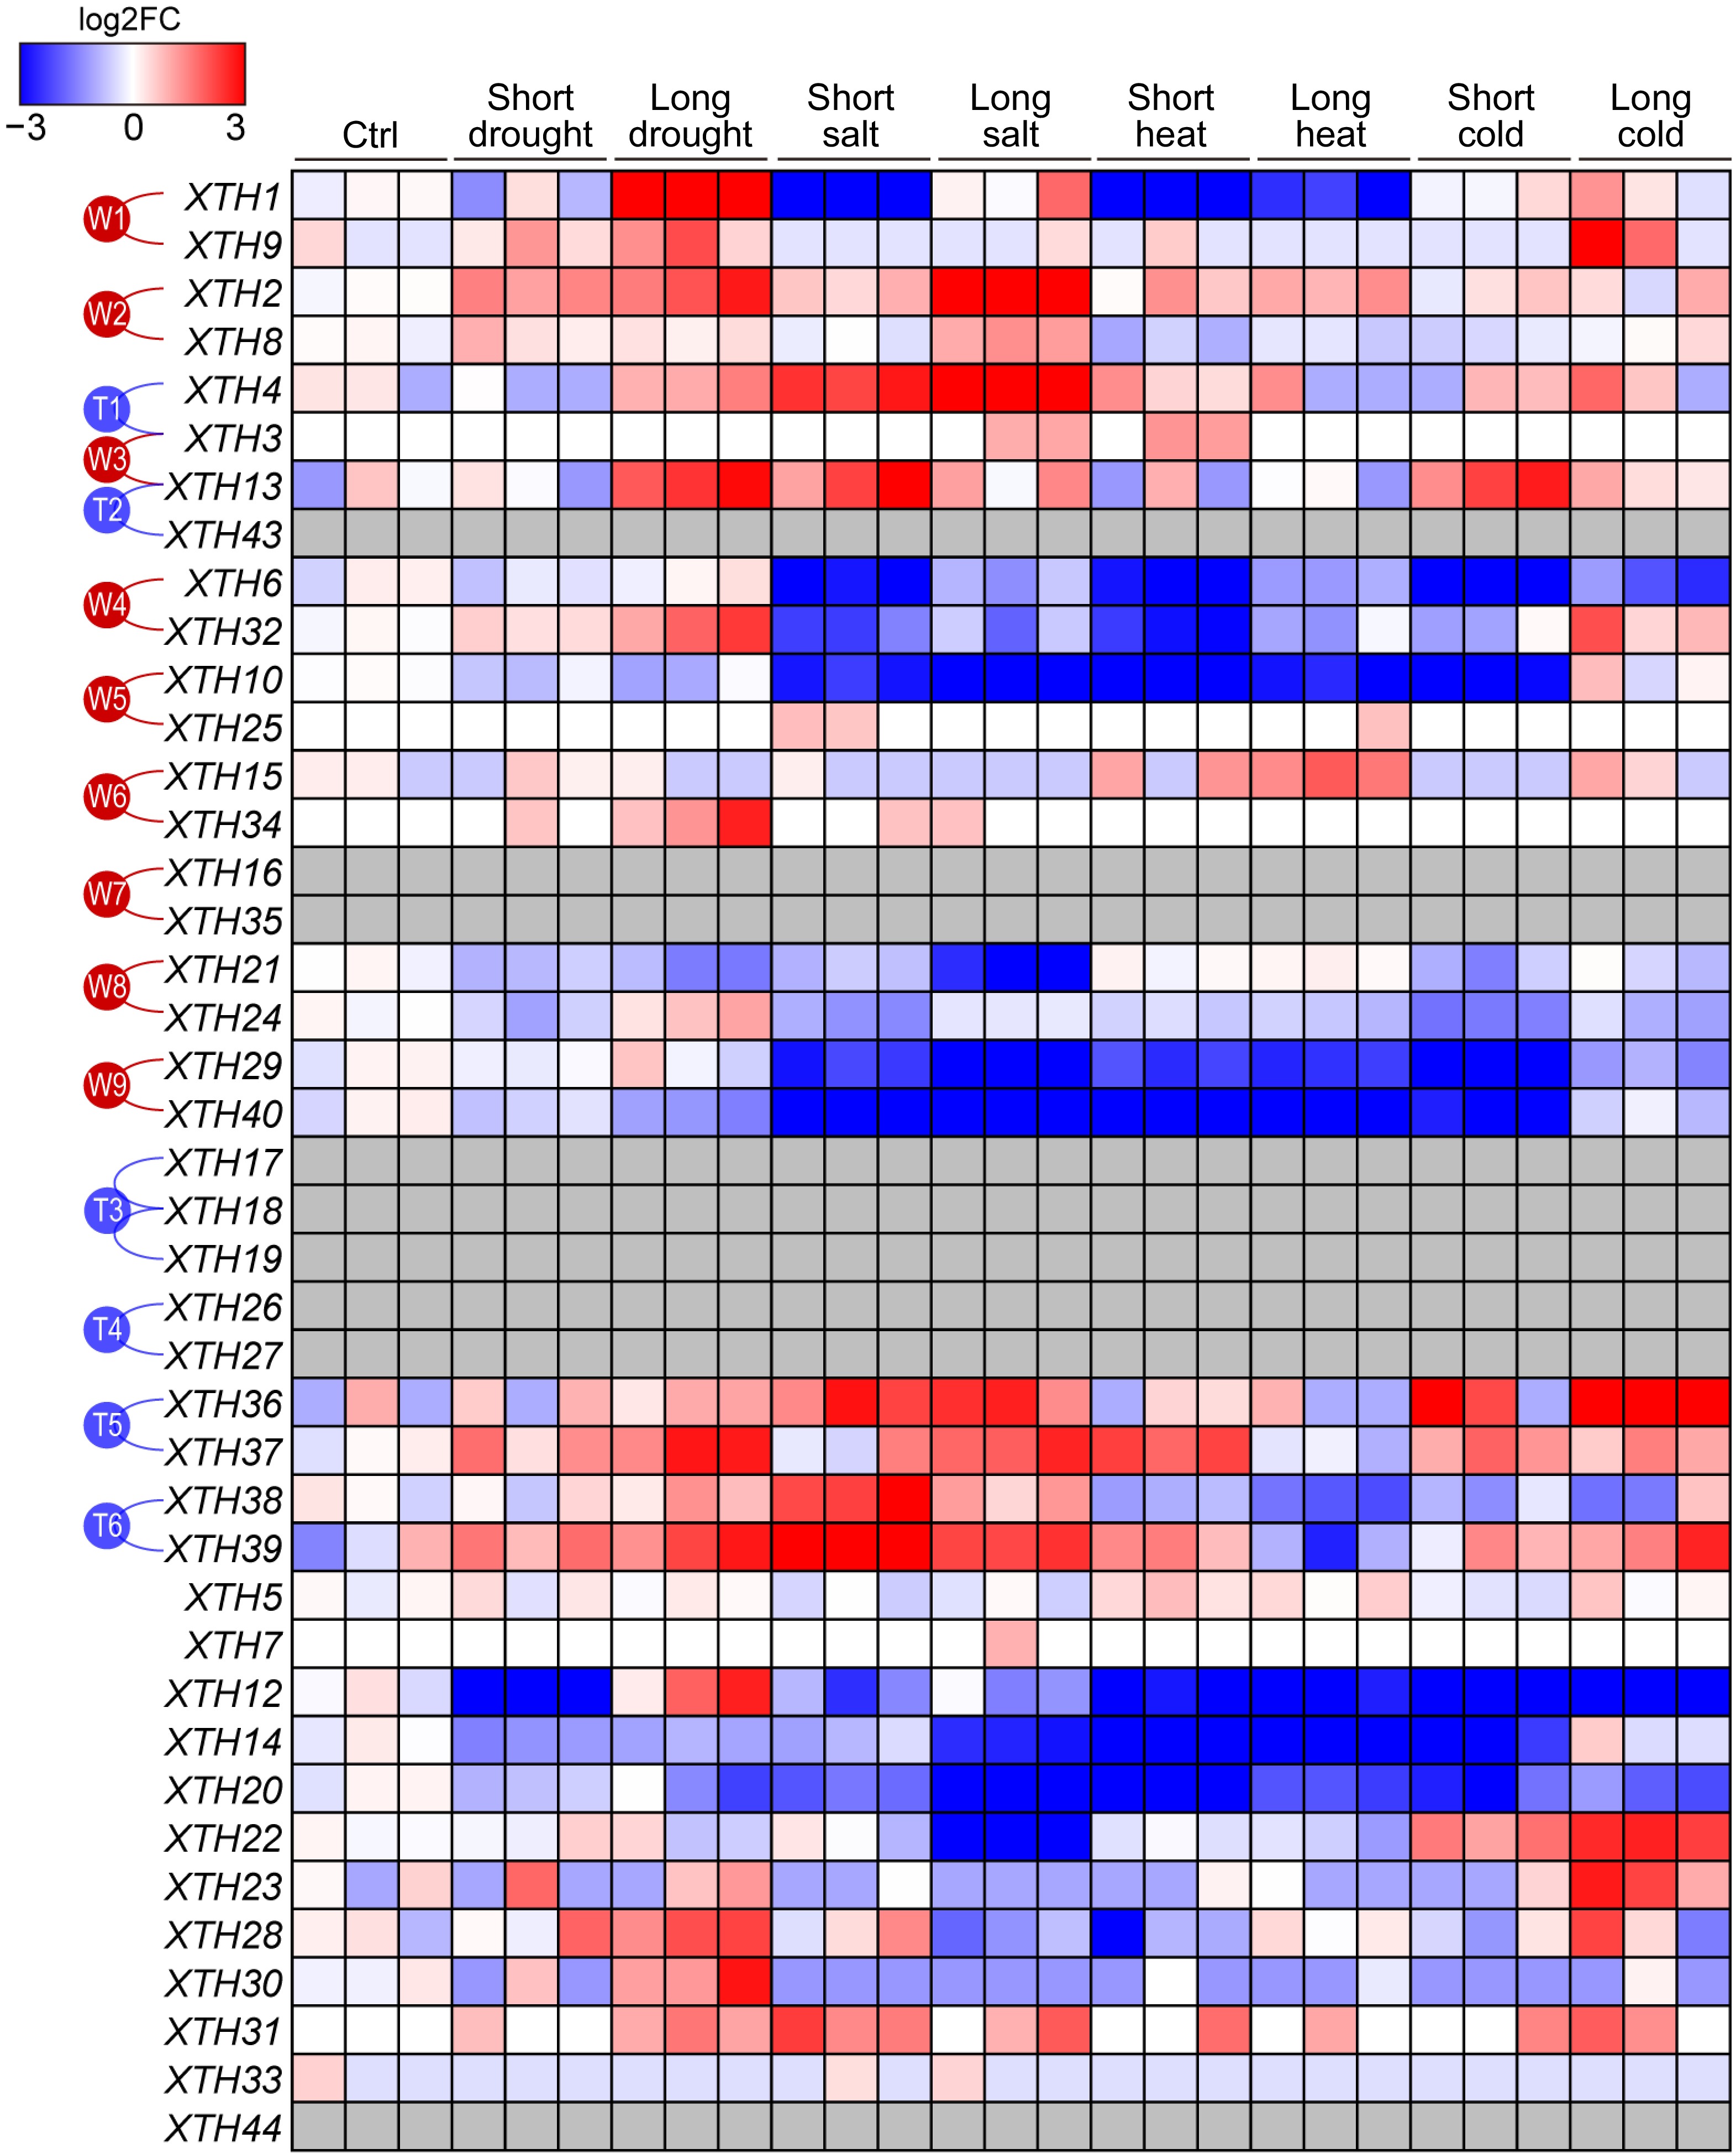
Figure 5.
The expression patterns of PtrXTHs under various abiotic stress conditions. The gene expression data, including control conditions (Ctrl) and short-term and long-term treatments under drought, salt stress, high temperature, and low temperature, were obtained from the EBI database (accession number: PRJEB19784). Gene expression was normalized by log2 fold change compared to the control. Blue and red represent low and high expression, respectively. The gray boxes indicate that gene expression was not detected. The paralogous genes generated by the whole-genome duplication events (W1−W9) or the tandem duplication events (T1−T6) are marked with red or blue lines on the left.
-
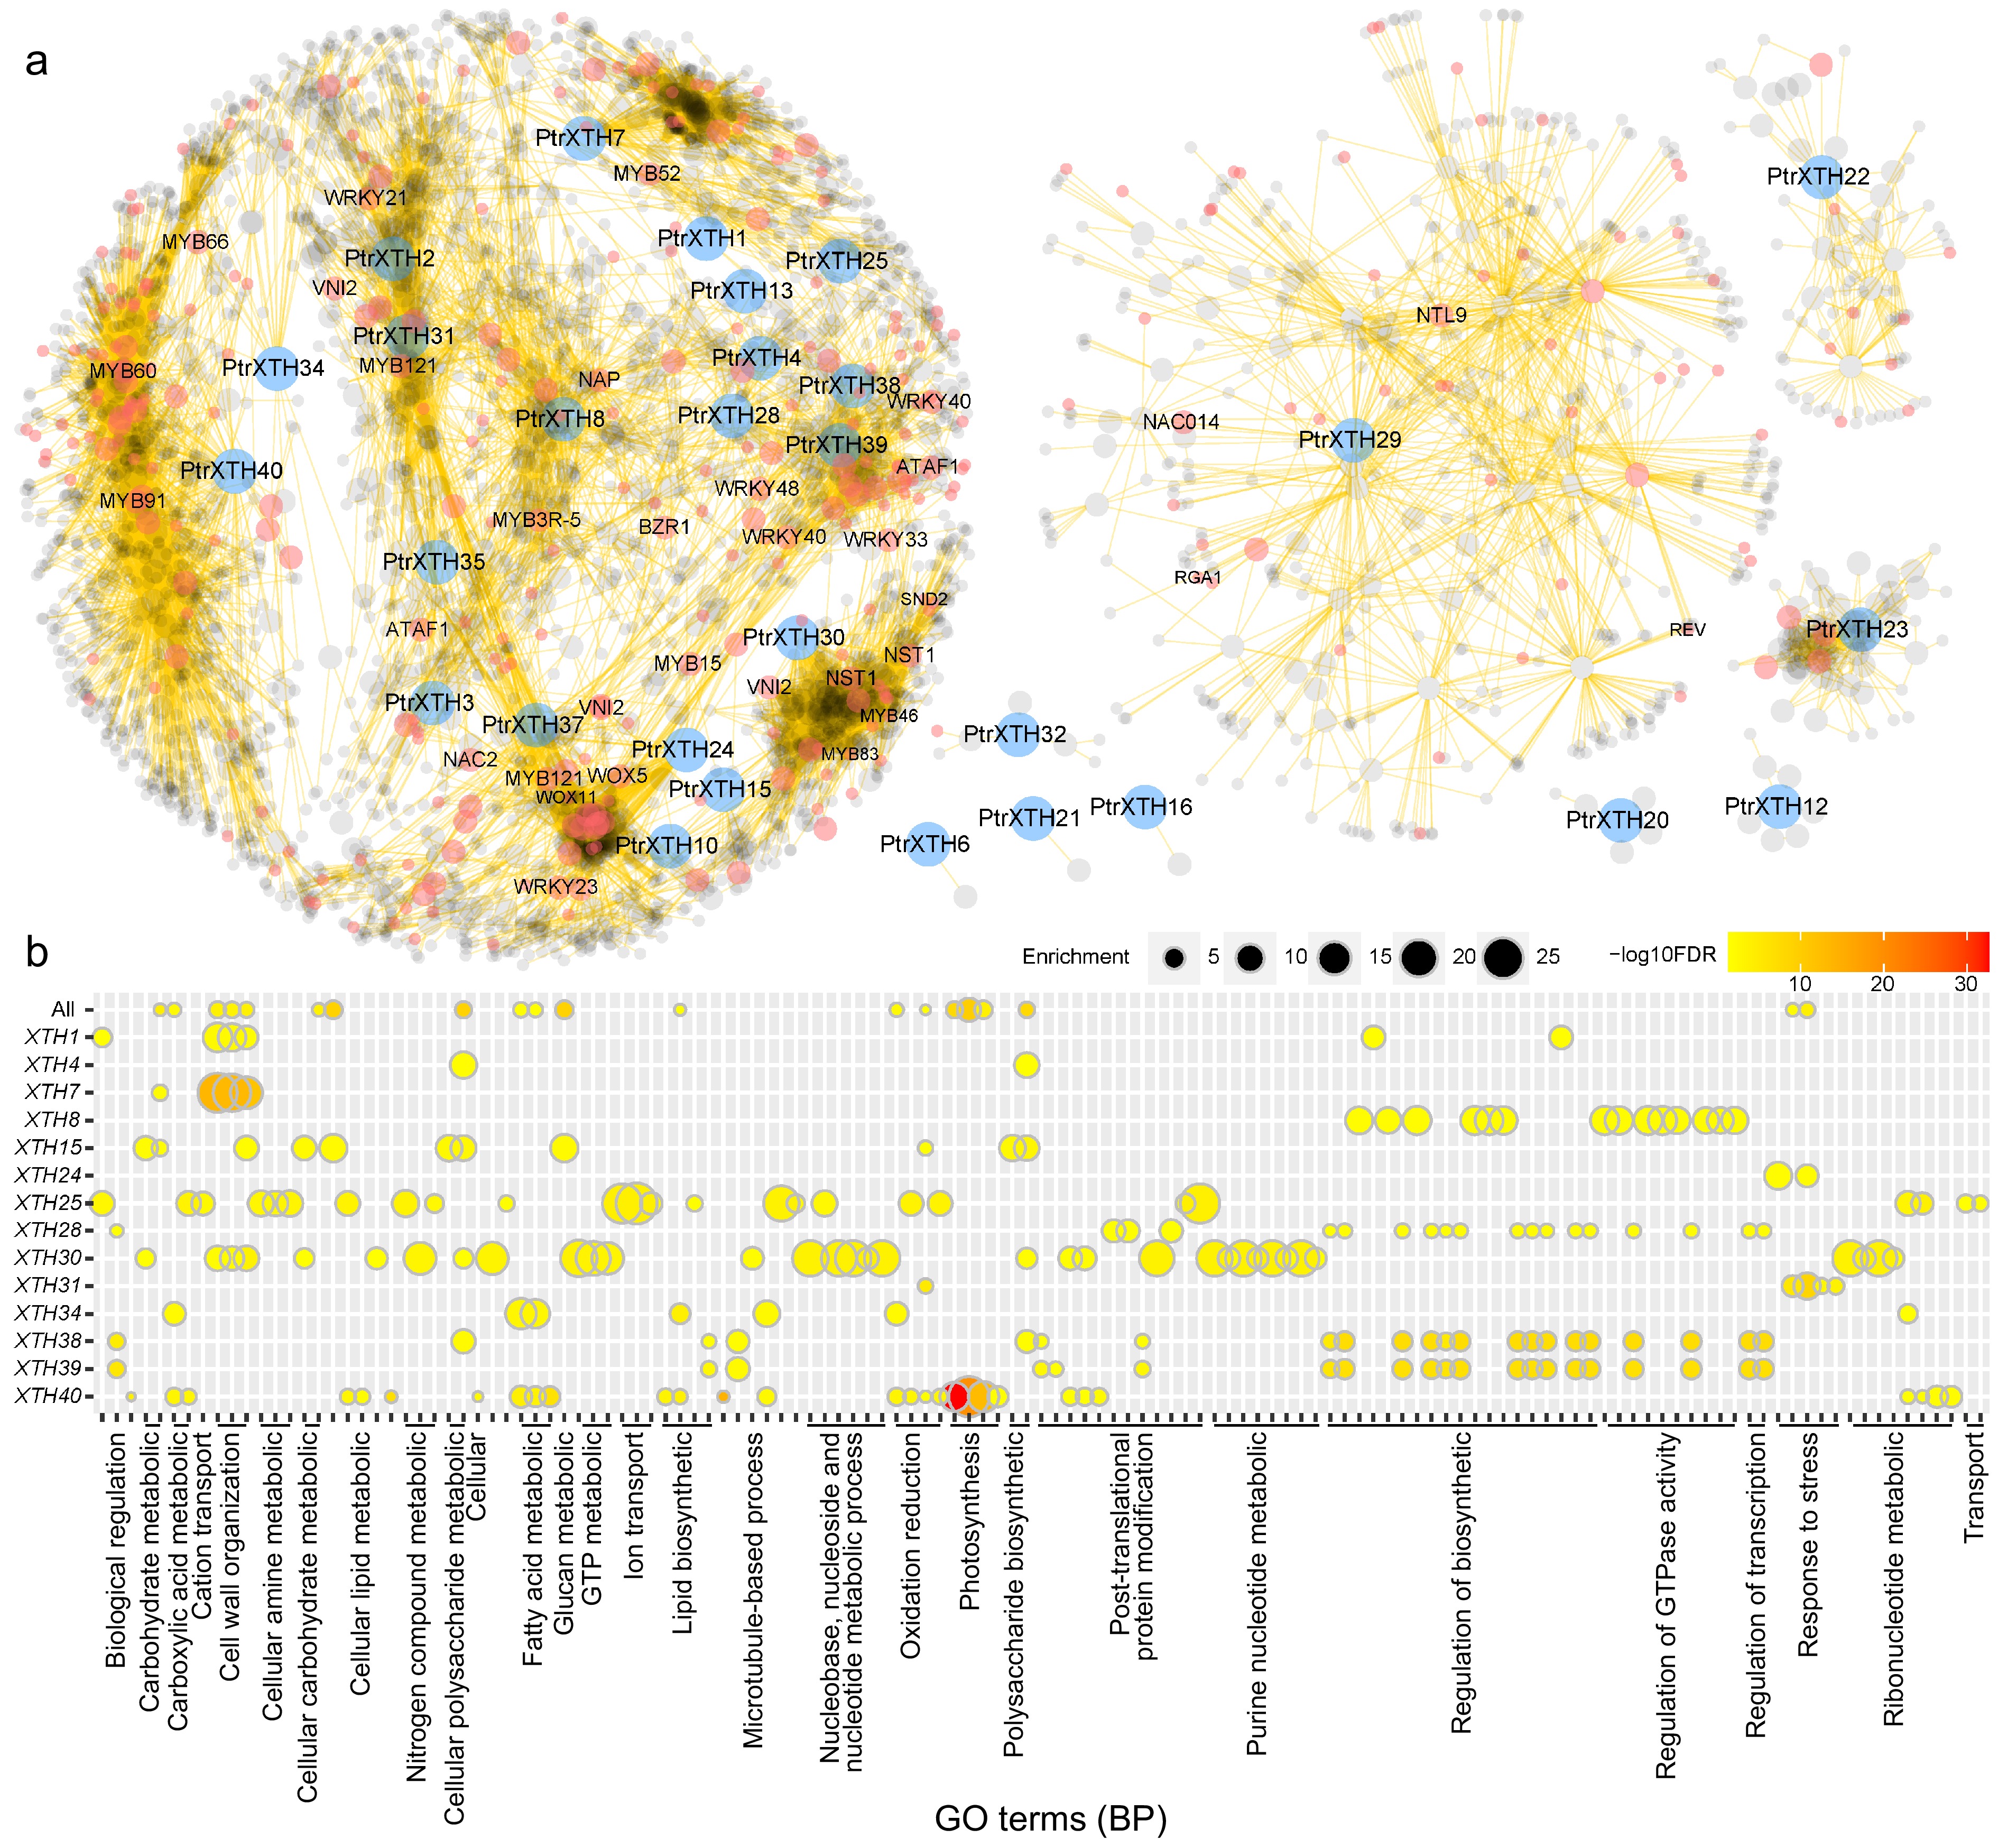
Figure 6.
The co-expression network of PtrXTHs. (a) Co-expression network of PtrXTHs. Blue, red, and grey nodes represent PtrXTHs, transcription factors, and other genes, respectively. (b) Gene ontology (GO) enrichment analysis of the co-expression sub-networks of 14 PtrXTHs on biological process (BP). The color gradient from yellow to red signifies the −log10 transformed FDR-corrected p value, while node size reflects the rich factor in the respective GO terms.
-
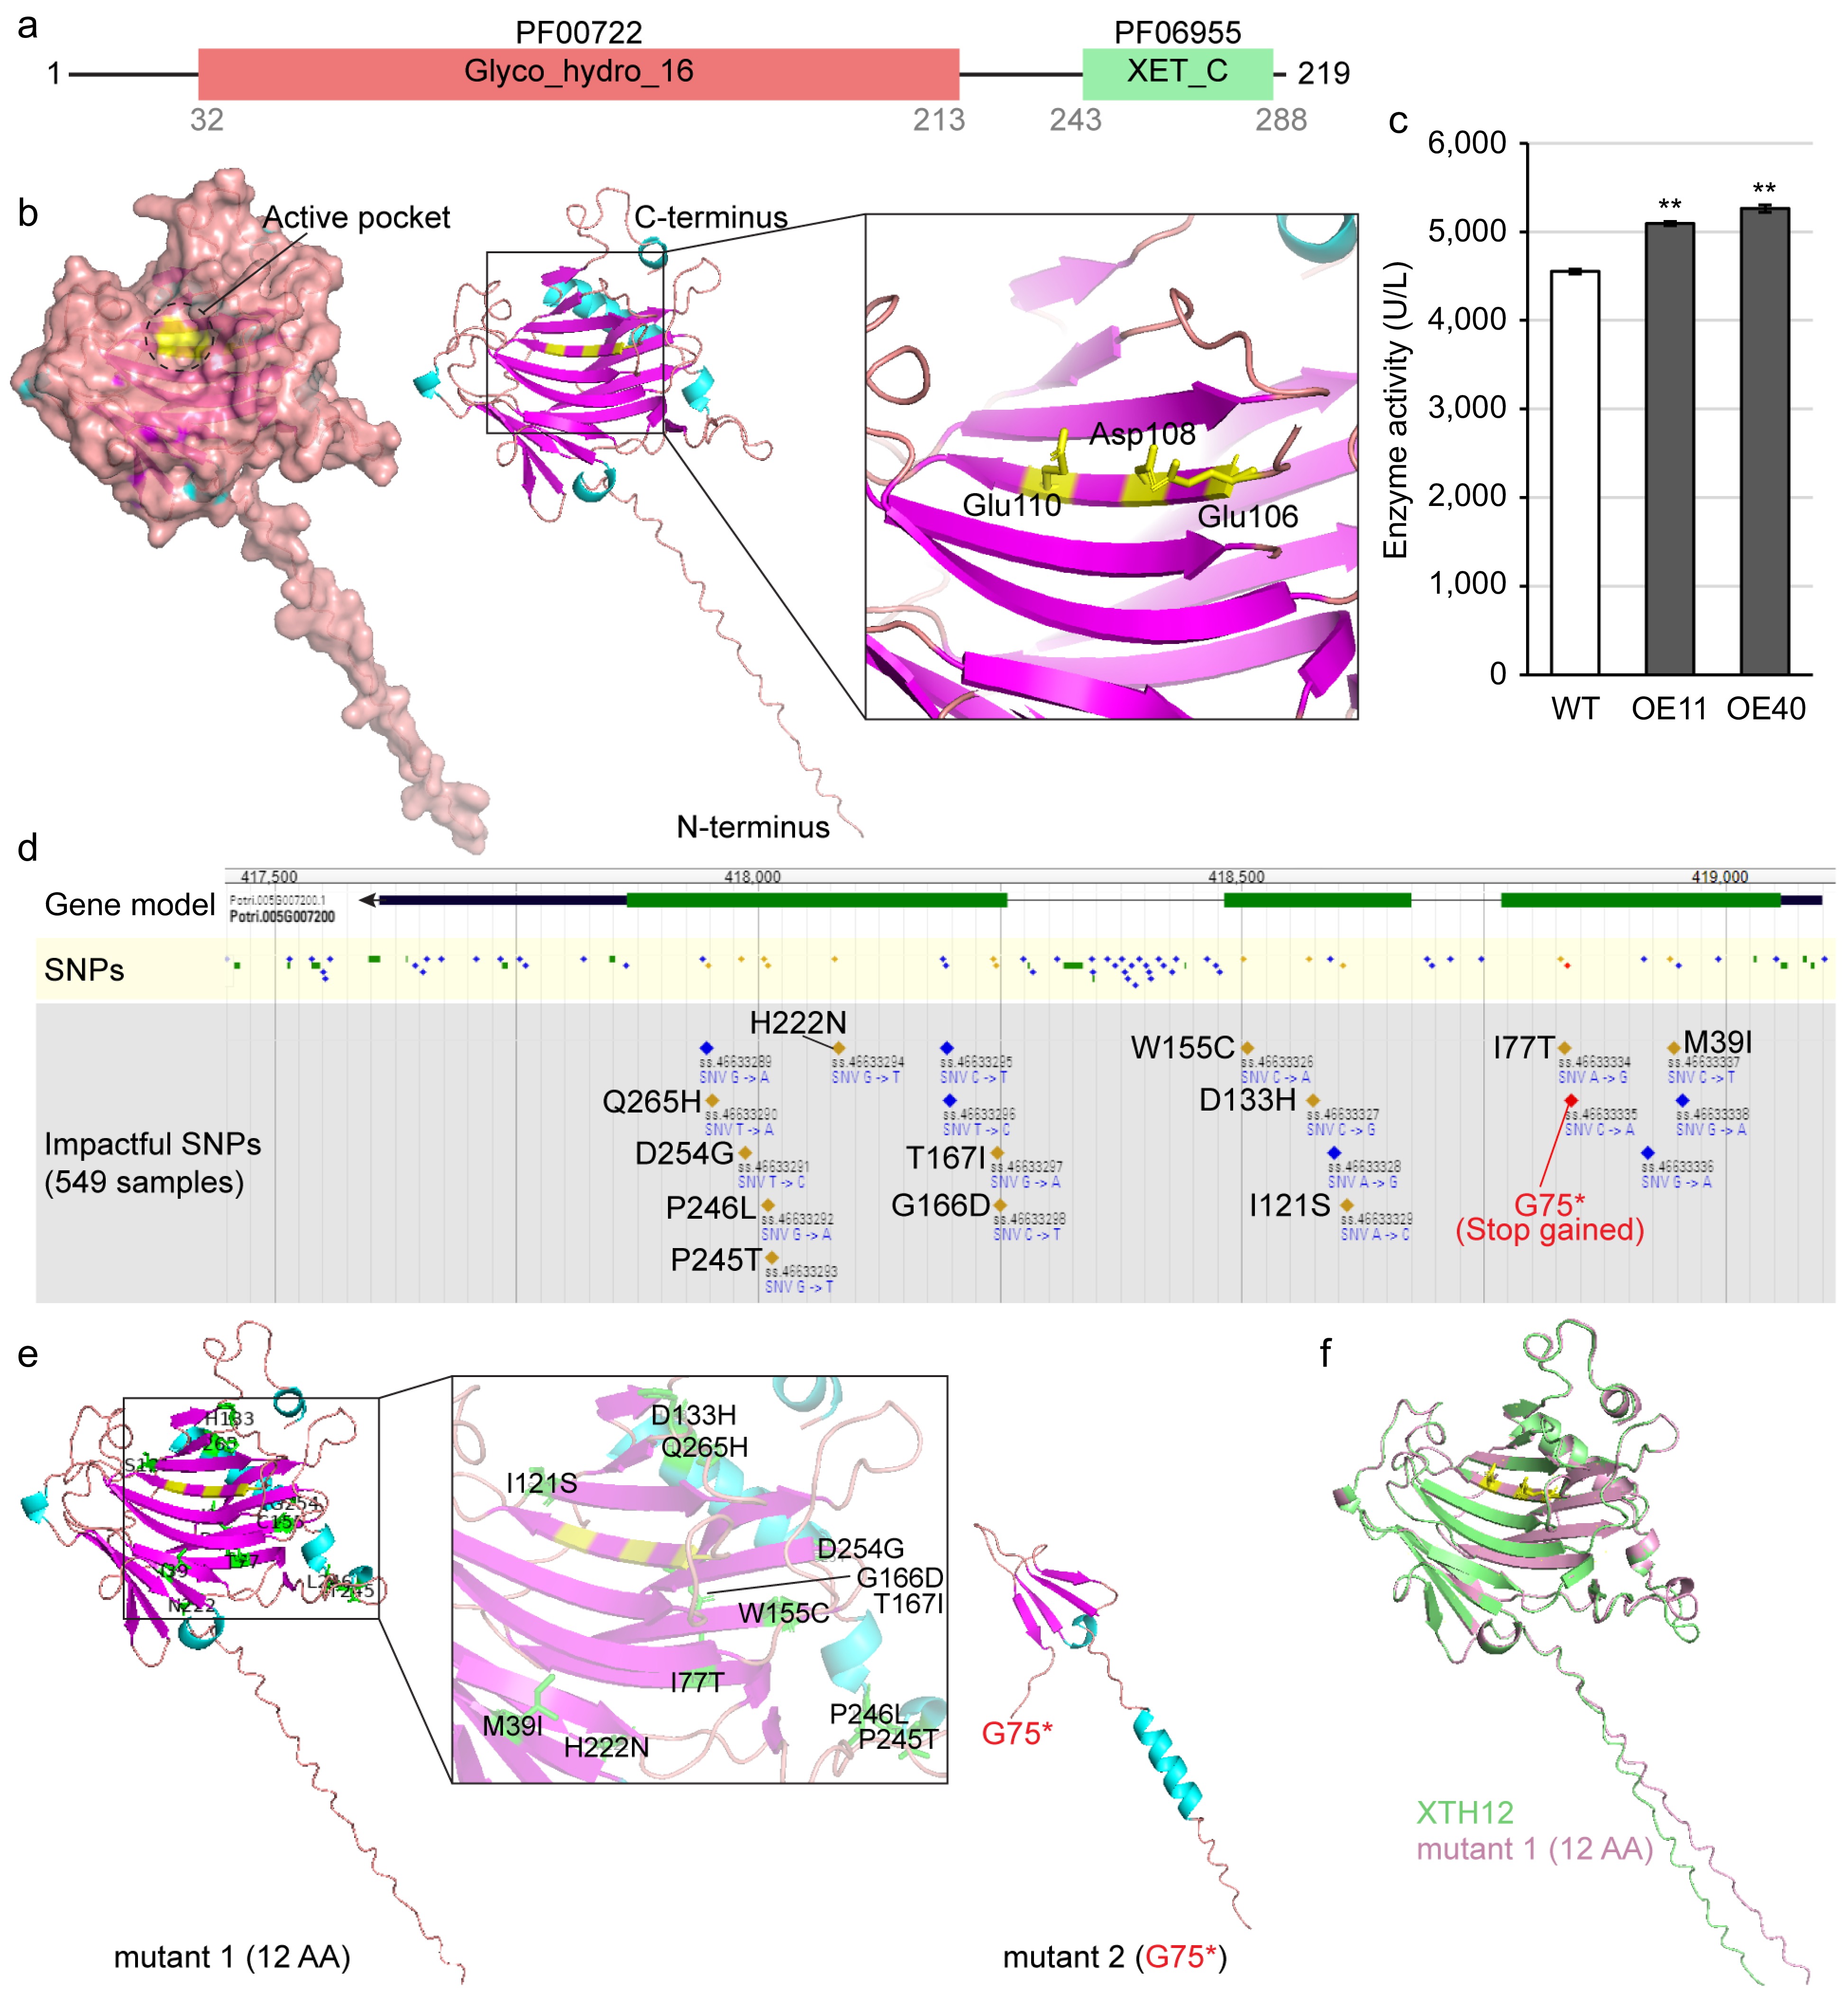
Figure 7.
Analysis of PagXTH12 protein structure and activity. (a) The conserved protein domain of PagXTH12. (b) Structural model of PagXTH12, with three amino acids (Glu106, Asp108, and Glu110 marked in yellow) identified as catalytic active sites located at the center of the active pocket. (c) Analysis of in vivo XTH catalytic activity in two PagXTH12-overexpressing poplar lines (OE11 and OE40) and wild-type control (WT). ** p < 0.01. (d) Single nucleotide polymorphisms (SNPs) within the XTH12 gene region among a population of 549 individuals of Populus trichocarpa. (e) Protein structures of two proposed mutants of PagXTH12, mutant 1 contains 12 non-synonymous mutation amino acids (marked in green), while mutant 2 has a premature termination codon at position 75. (f) Alignment results between PagXTH12 and its proposed mutant 1.
-
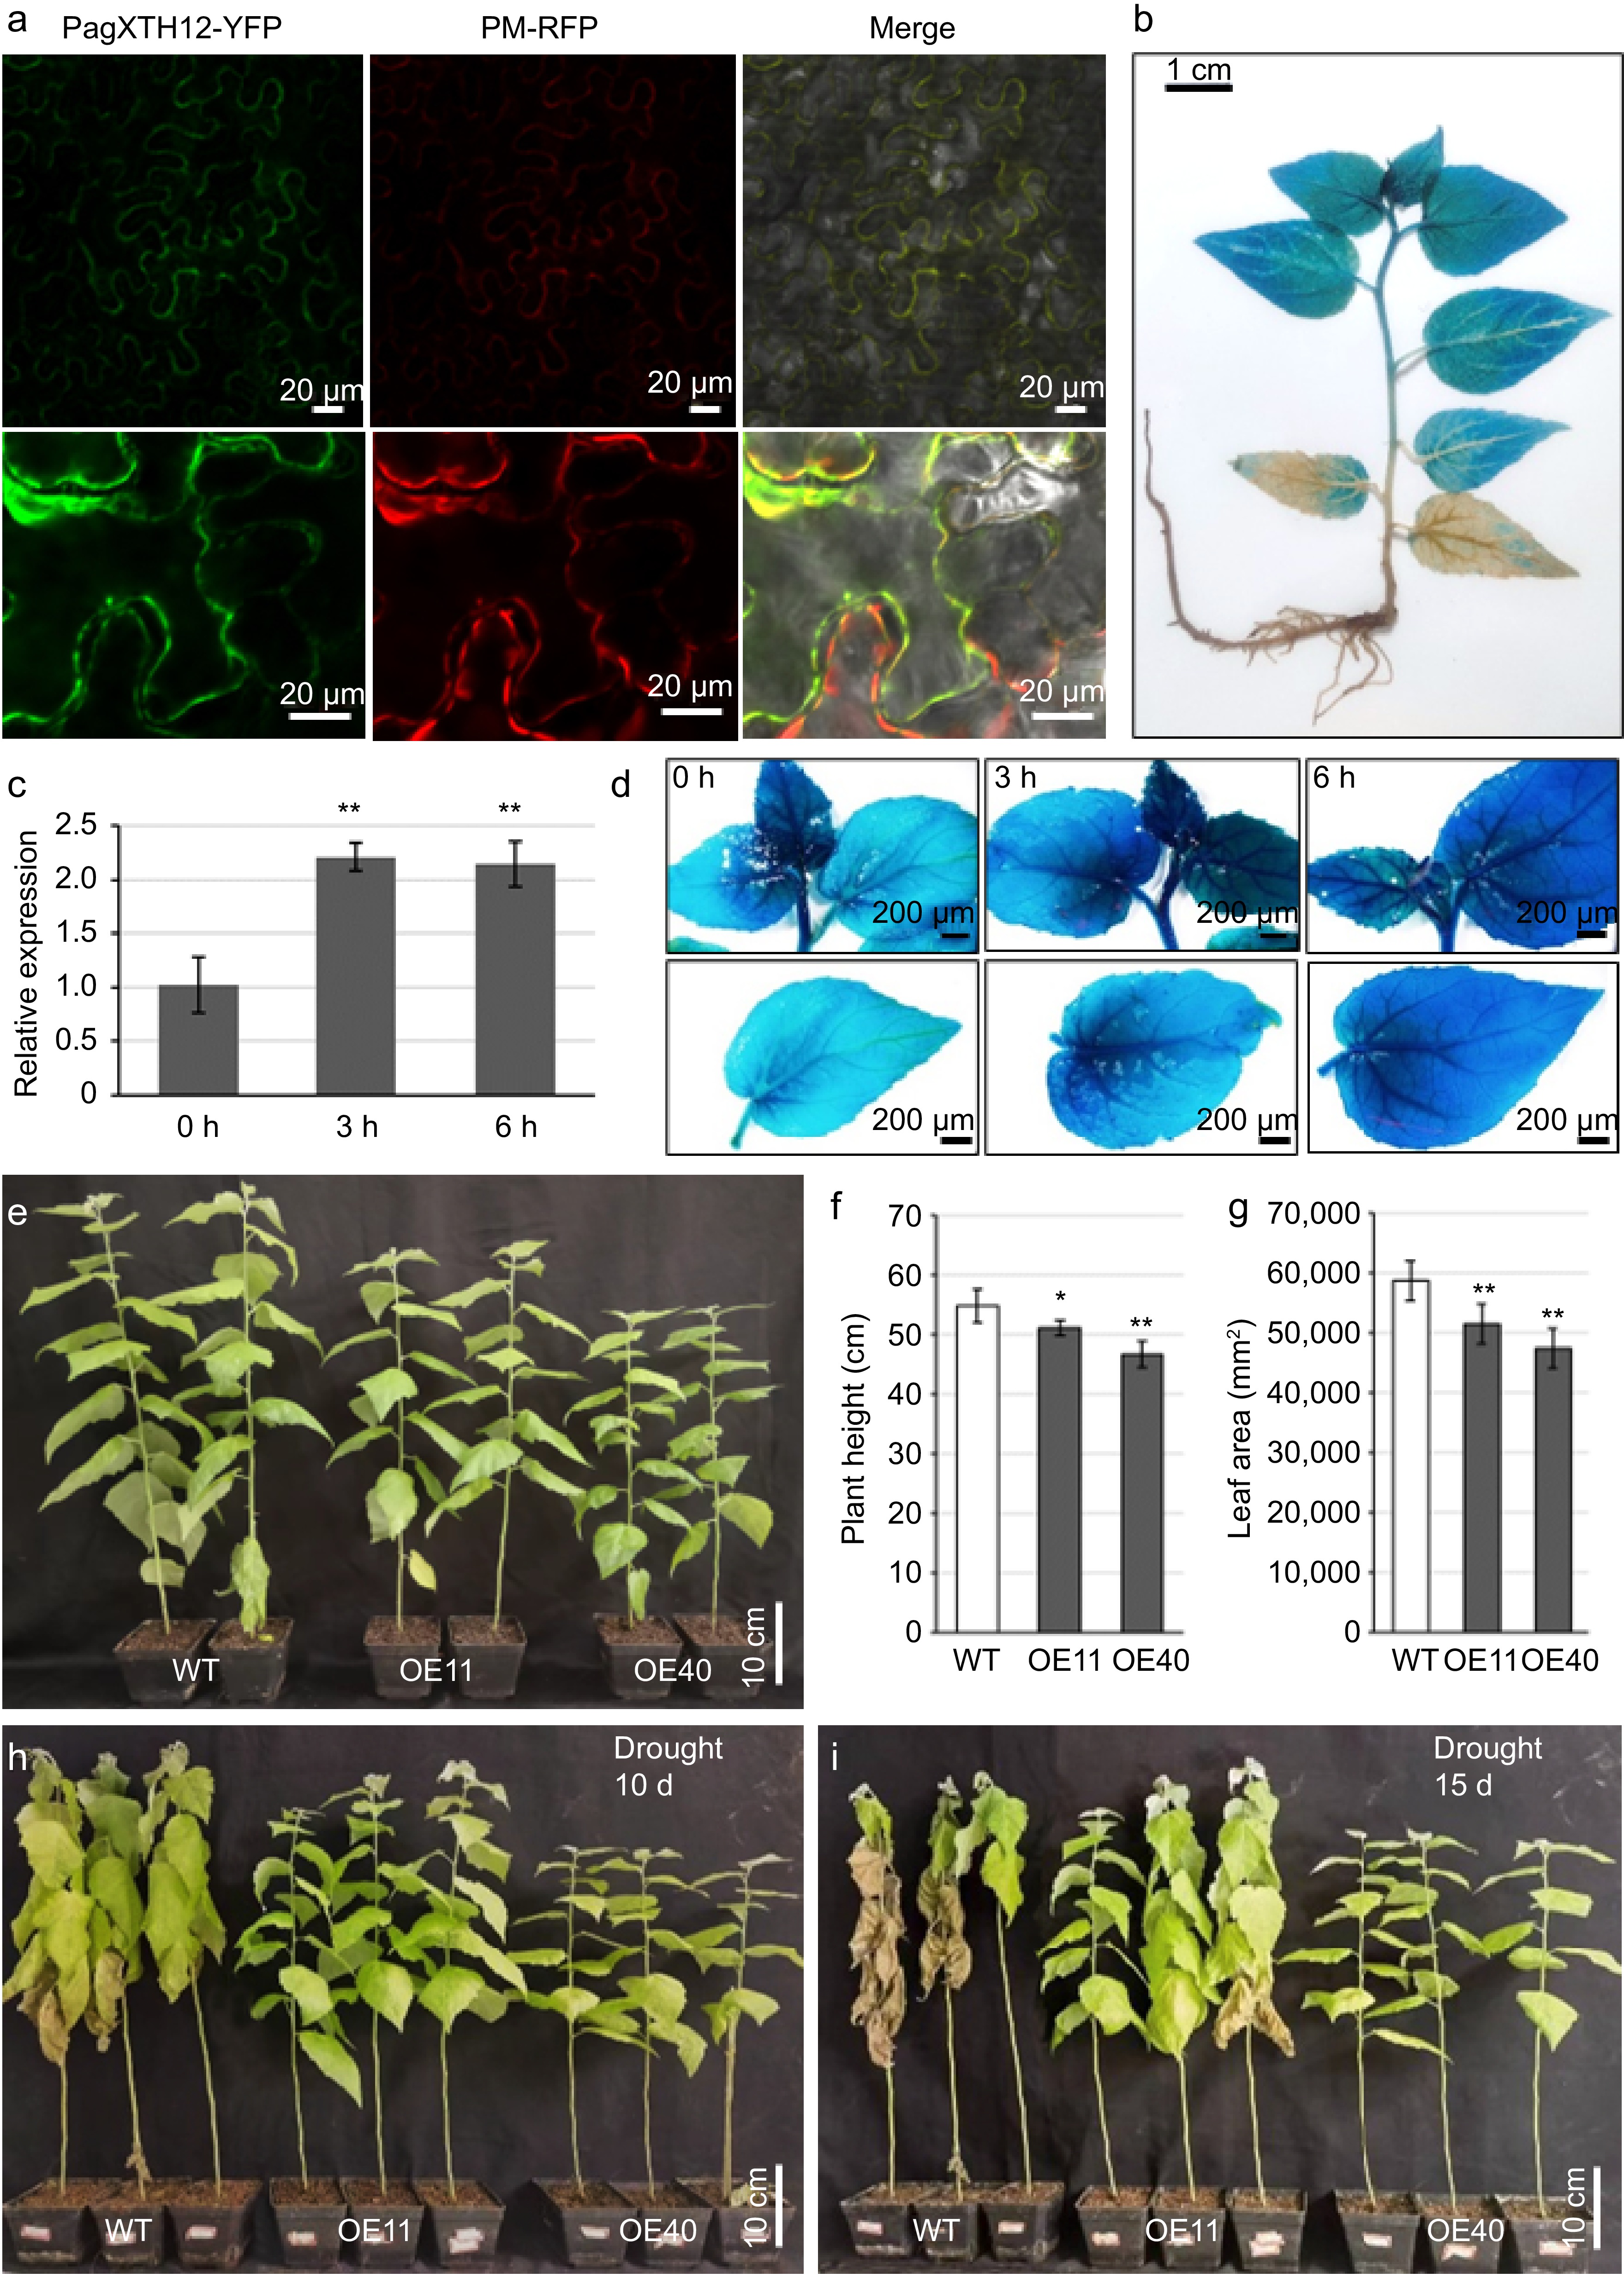
Figure 8.
PagXTH12 responds to drought stress and enhances drought resistance in transgenic poplar. (a) Subcellular localization of the PagXTH12-YFP fusion protein in the lower epidermal cells of leaves in Nicotiana benthamiana. (b) GUS staining of ProPagXTH12::GUS transgenic poplar. (c) Expression of PagXTH12 under 20% PEG6000 simulated drought stresses at 0 h, 3 h, and 6 h, the data are presented as mean ± SD. ** p < 0.01. (d) The GUS staining of ProPagXTH12::GUS transgenic poplar under PEG-simulated drought stress conditions shows that the GUS signal intensity increases with prolonged drought treatment duration. (e)−(g) Under well-watered conditions, the overexpression of PagXTH12 inhibits plant height and biomas. After 90 d of cultivation, the (f) plant height, and (h) total leaf area of the overexpression lines OE11 and OE40 were significantly lower than the control. * p < 0.05, ** p < 0.01. (h), (i) After 10 and 15 d of natural drought stress, the PagXTH12 overexpression lines OE11 and OE40 exhibited significantly improved drought resistance compared to the control.
Figures
(8)
Tables
(0)