-
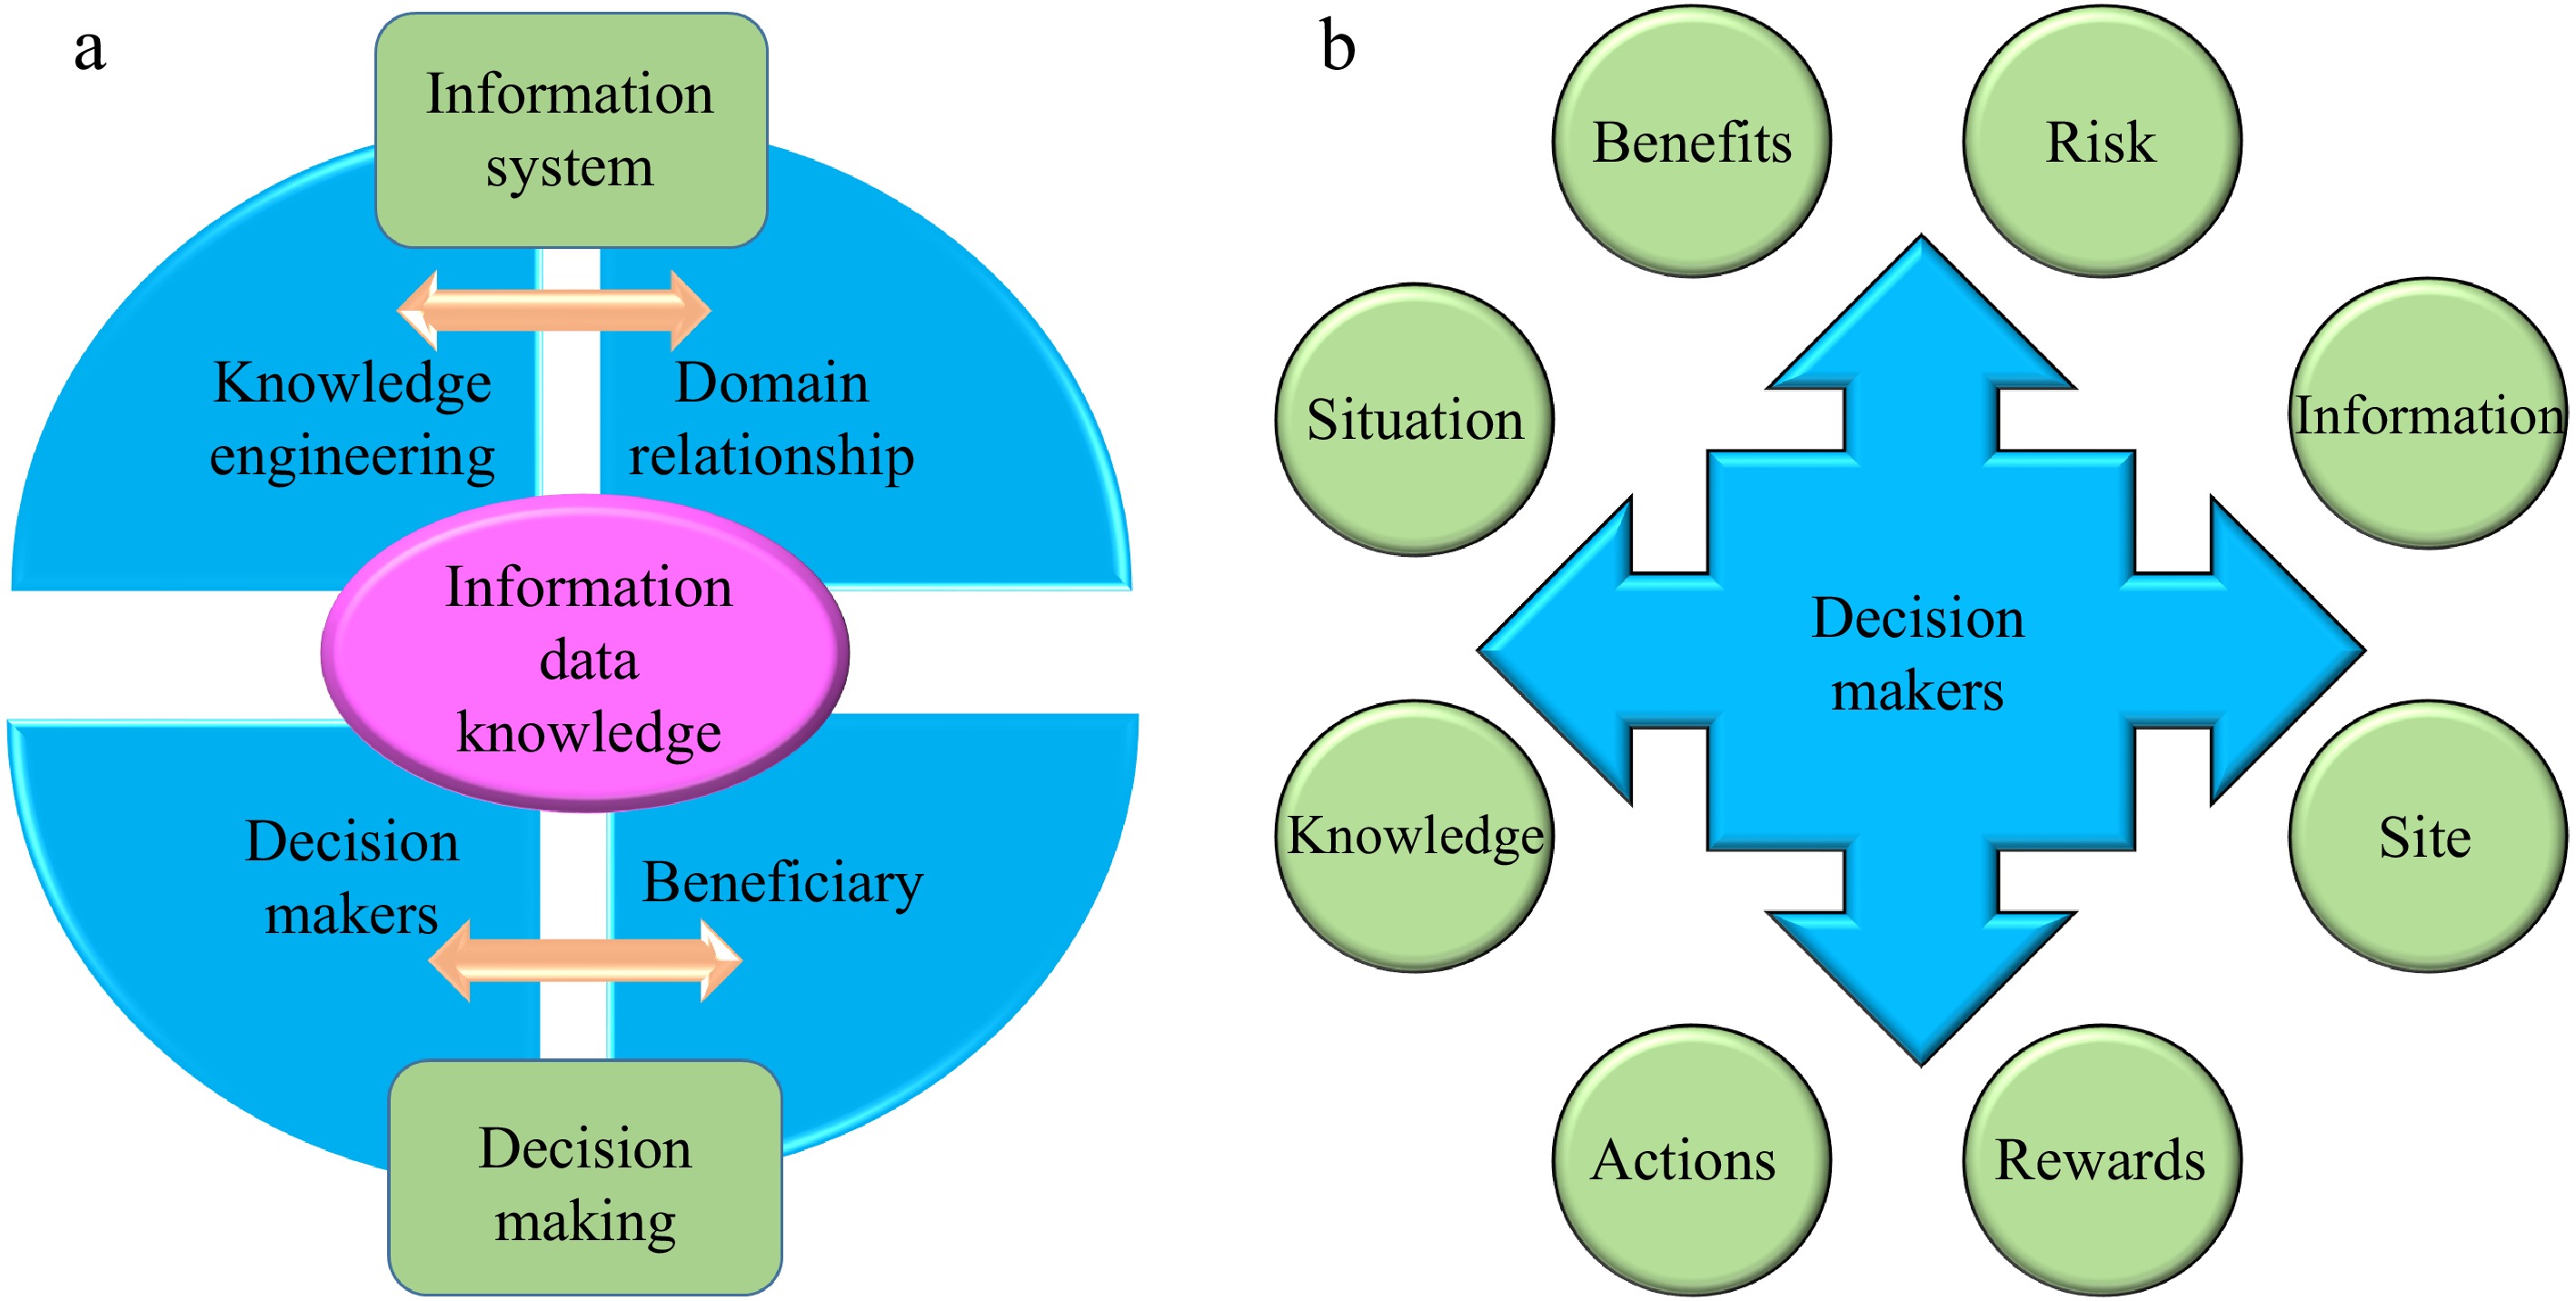
Figure 1.
(a) Information system and decision-making interconnection, and (b) decision makers - where decisions are made (adapted from Barrett & Jones[14]).
-
-
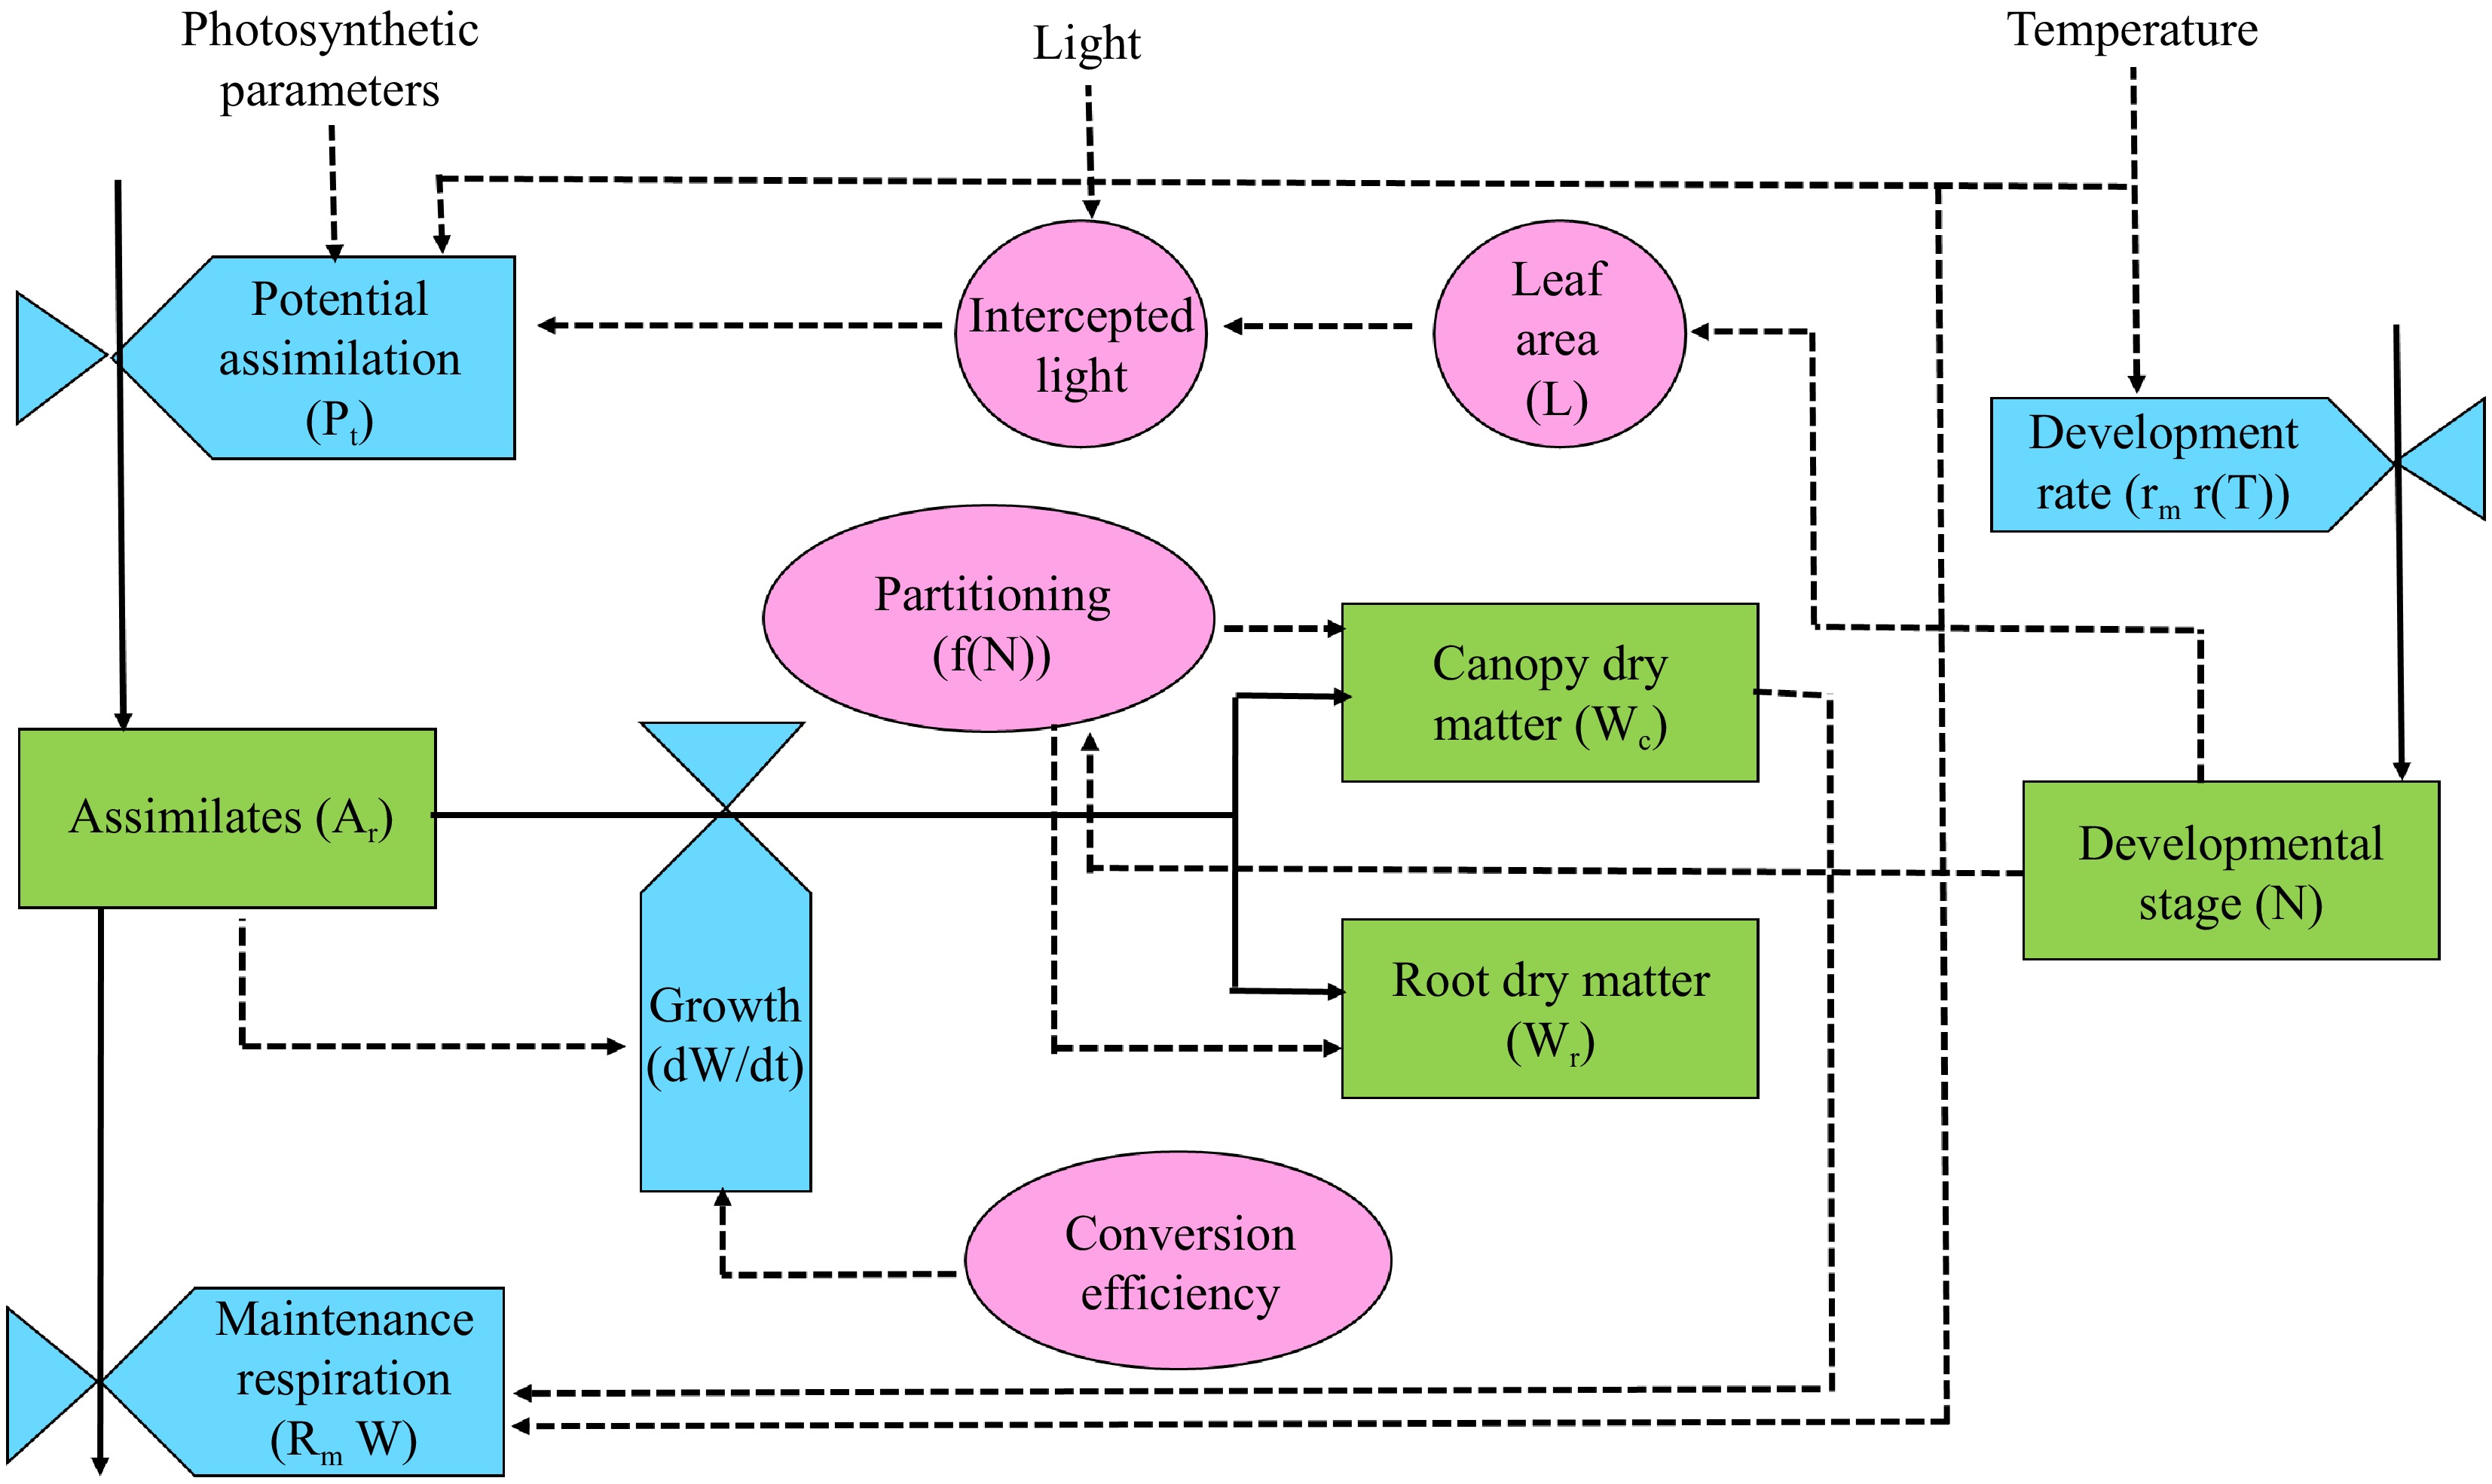
Figure 3.
A crop model with a potential production level framework is depicted with three auxiliary variables, state variables (green), rate variables (cyan), and intermediate product (pink). The solid arrow tells the pathway of material flow, dashed arrow - tells the pathway of information flow (modified from Jones et al.[26]).
-
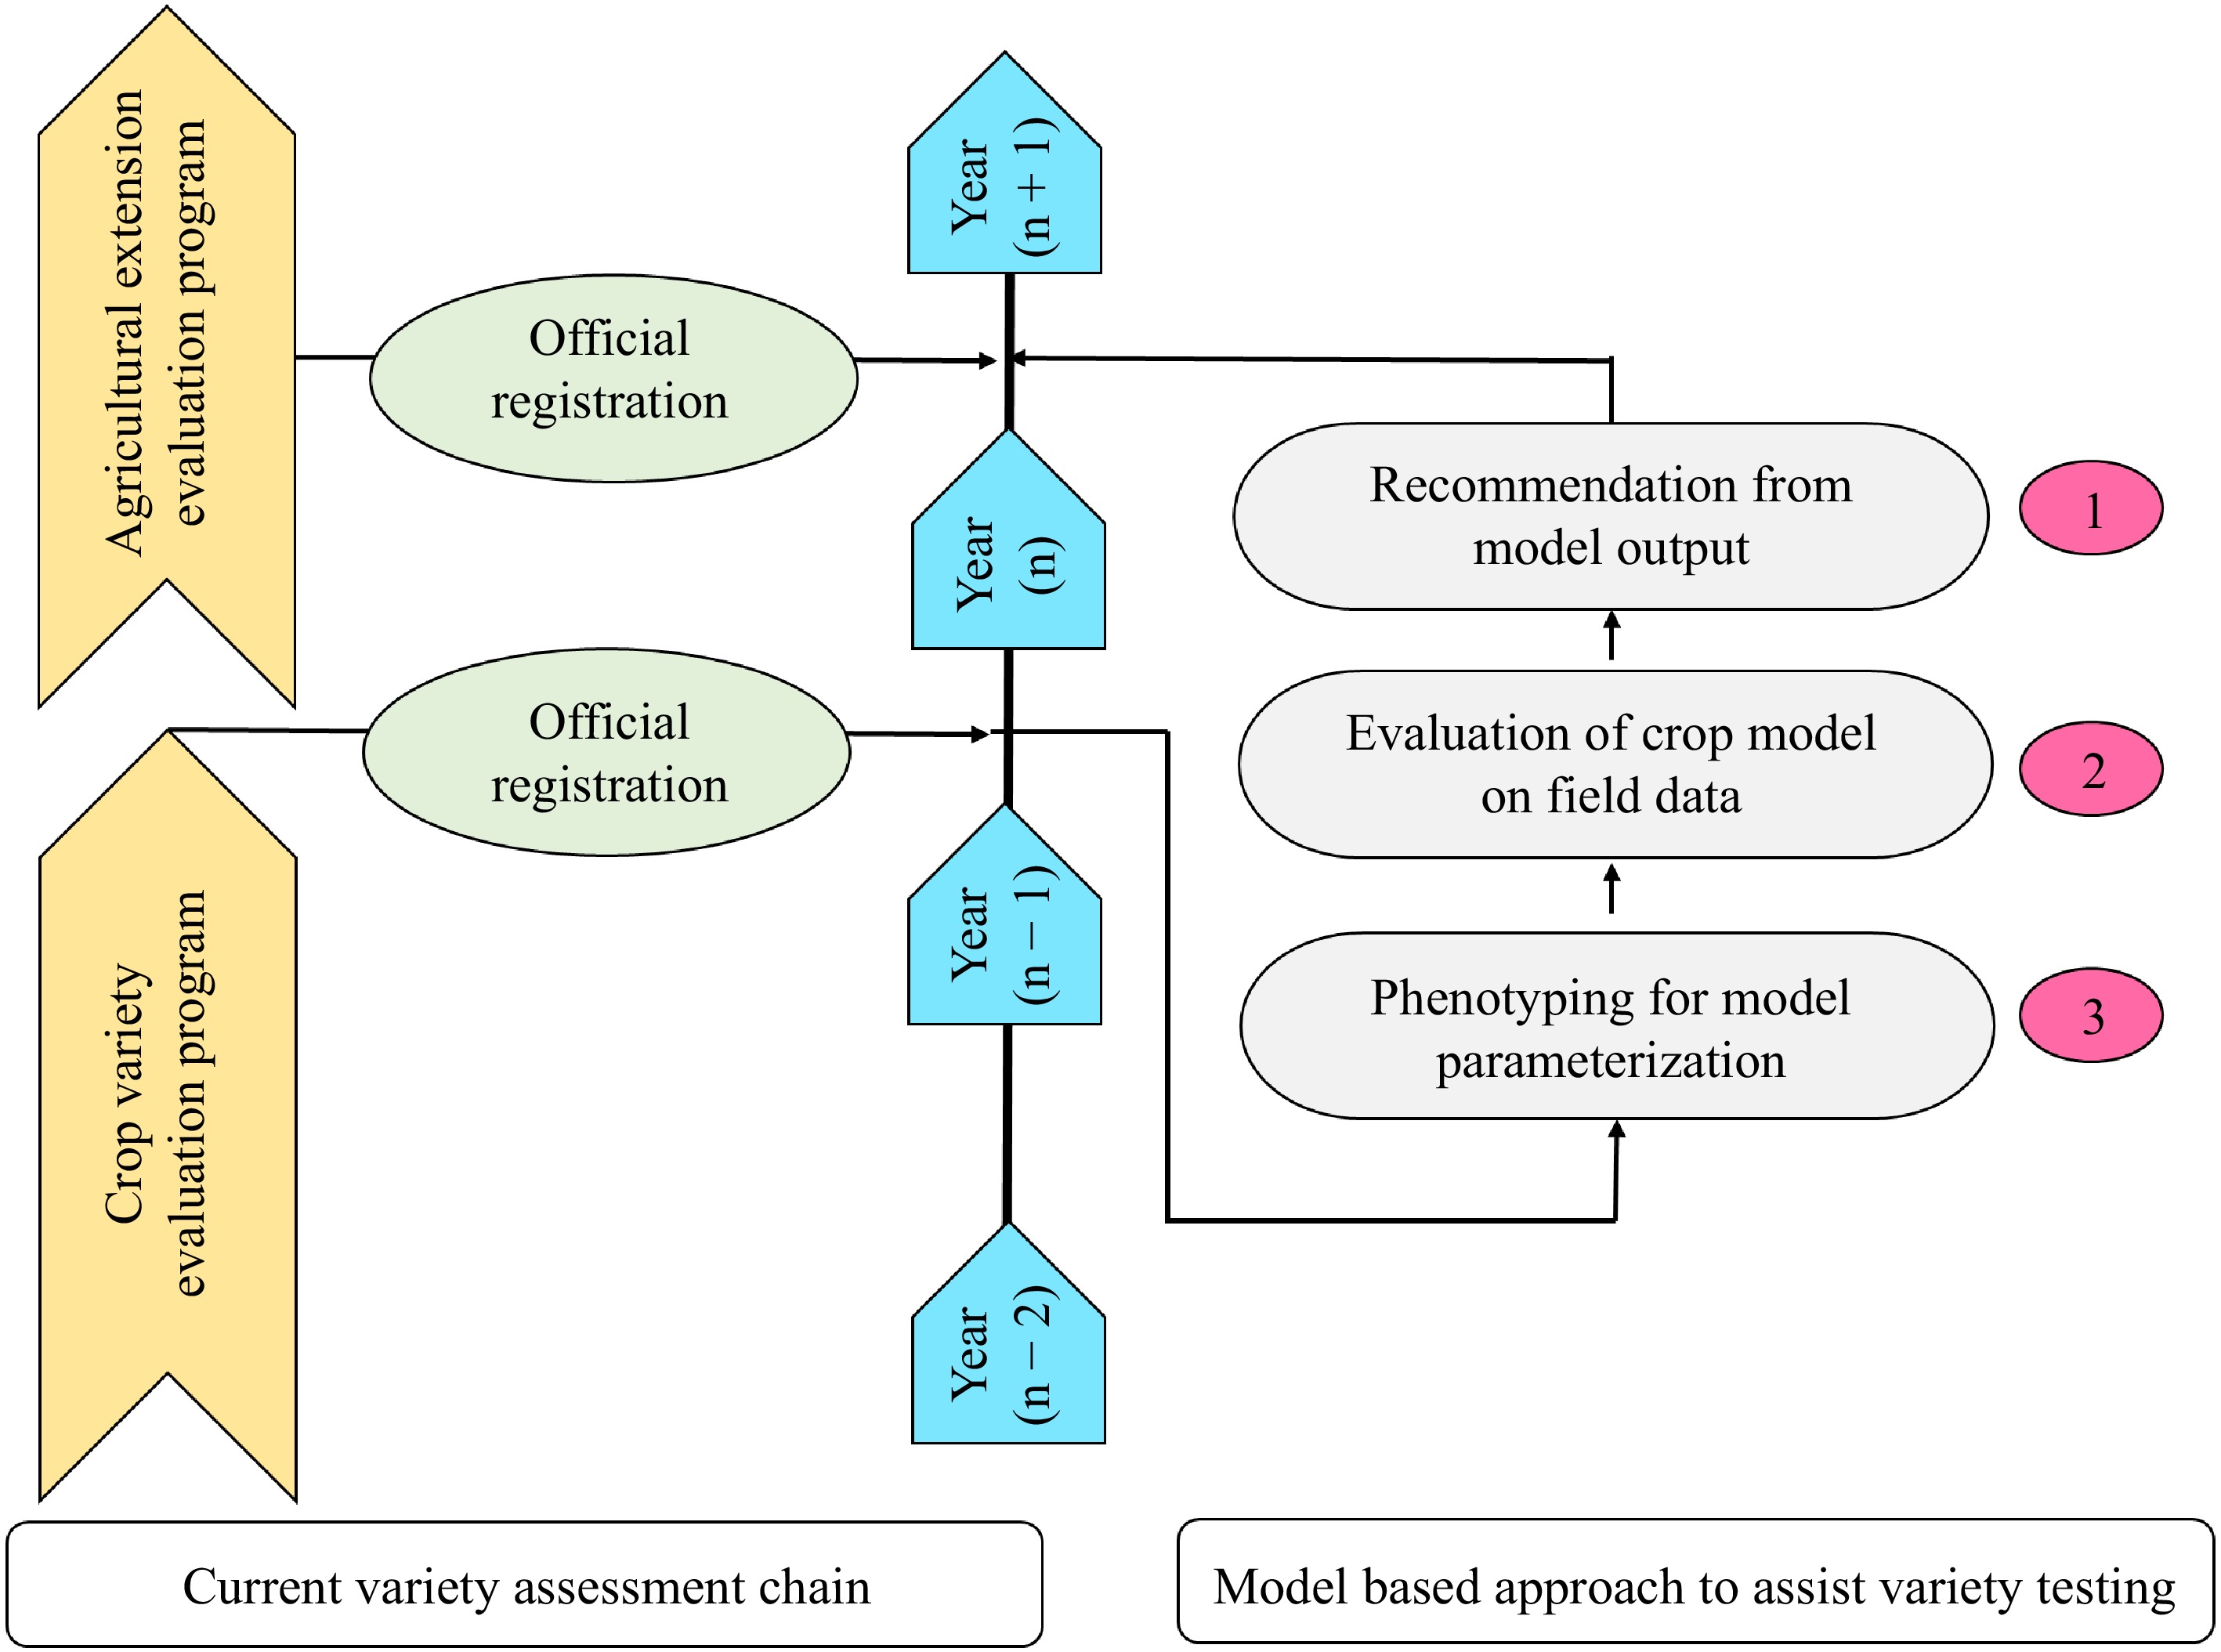
Figure 4.
Framework to include crop modeling in the variety evaluation process (modified from Casadebaig et al.[128]).
-
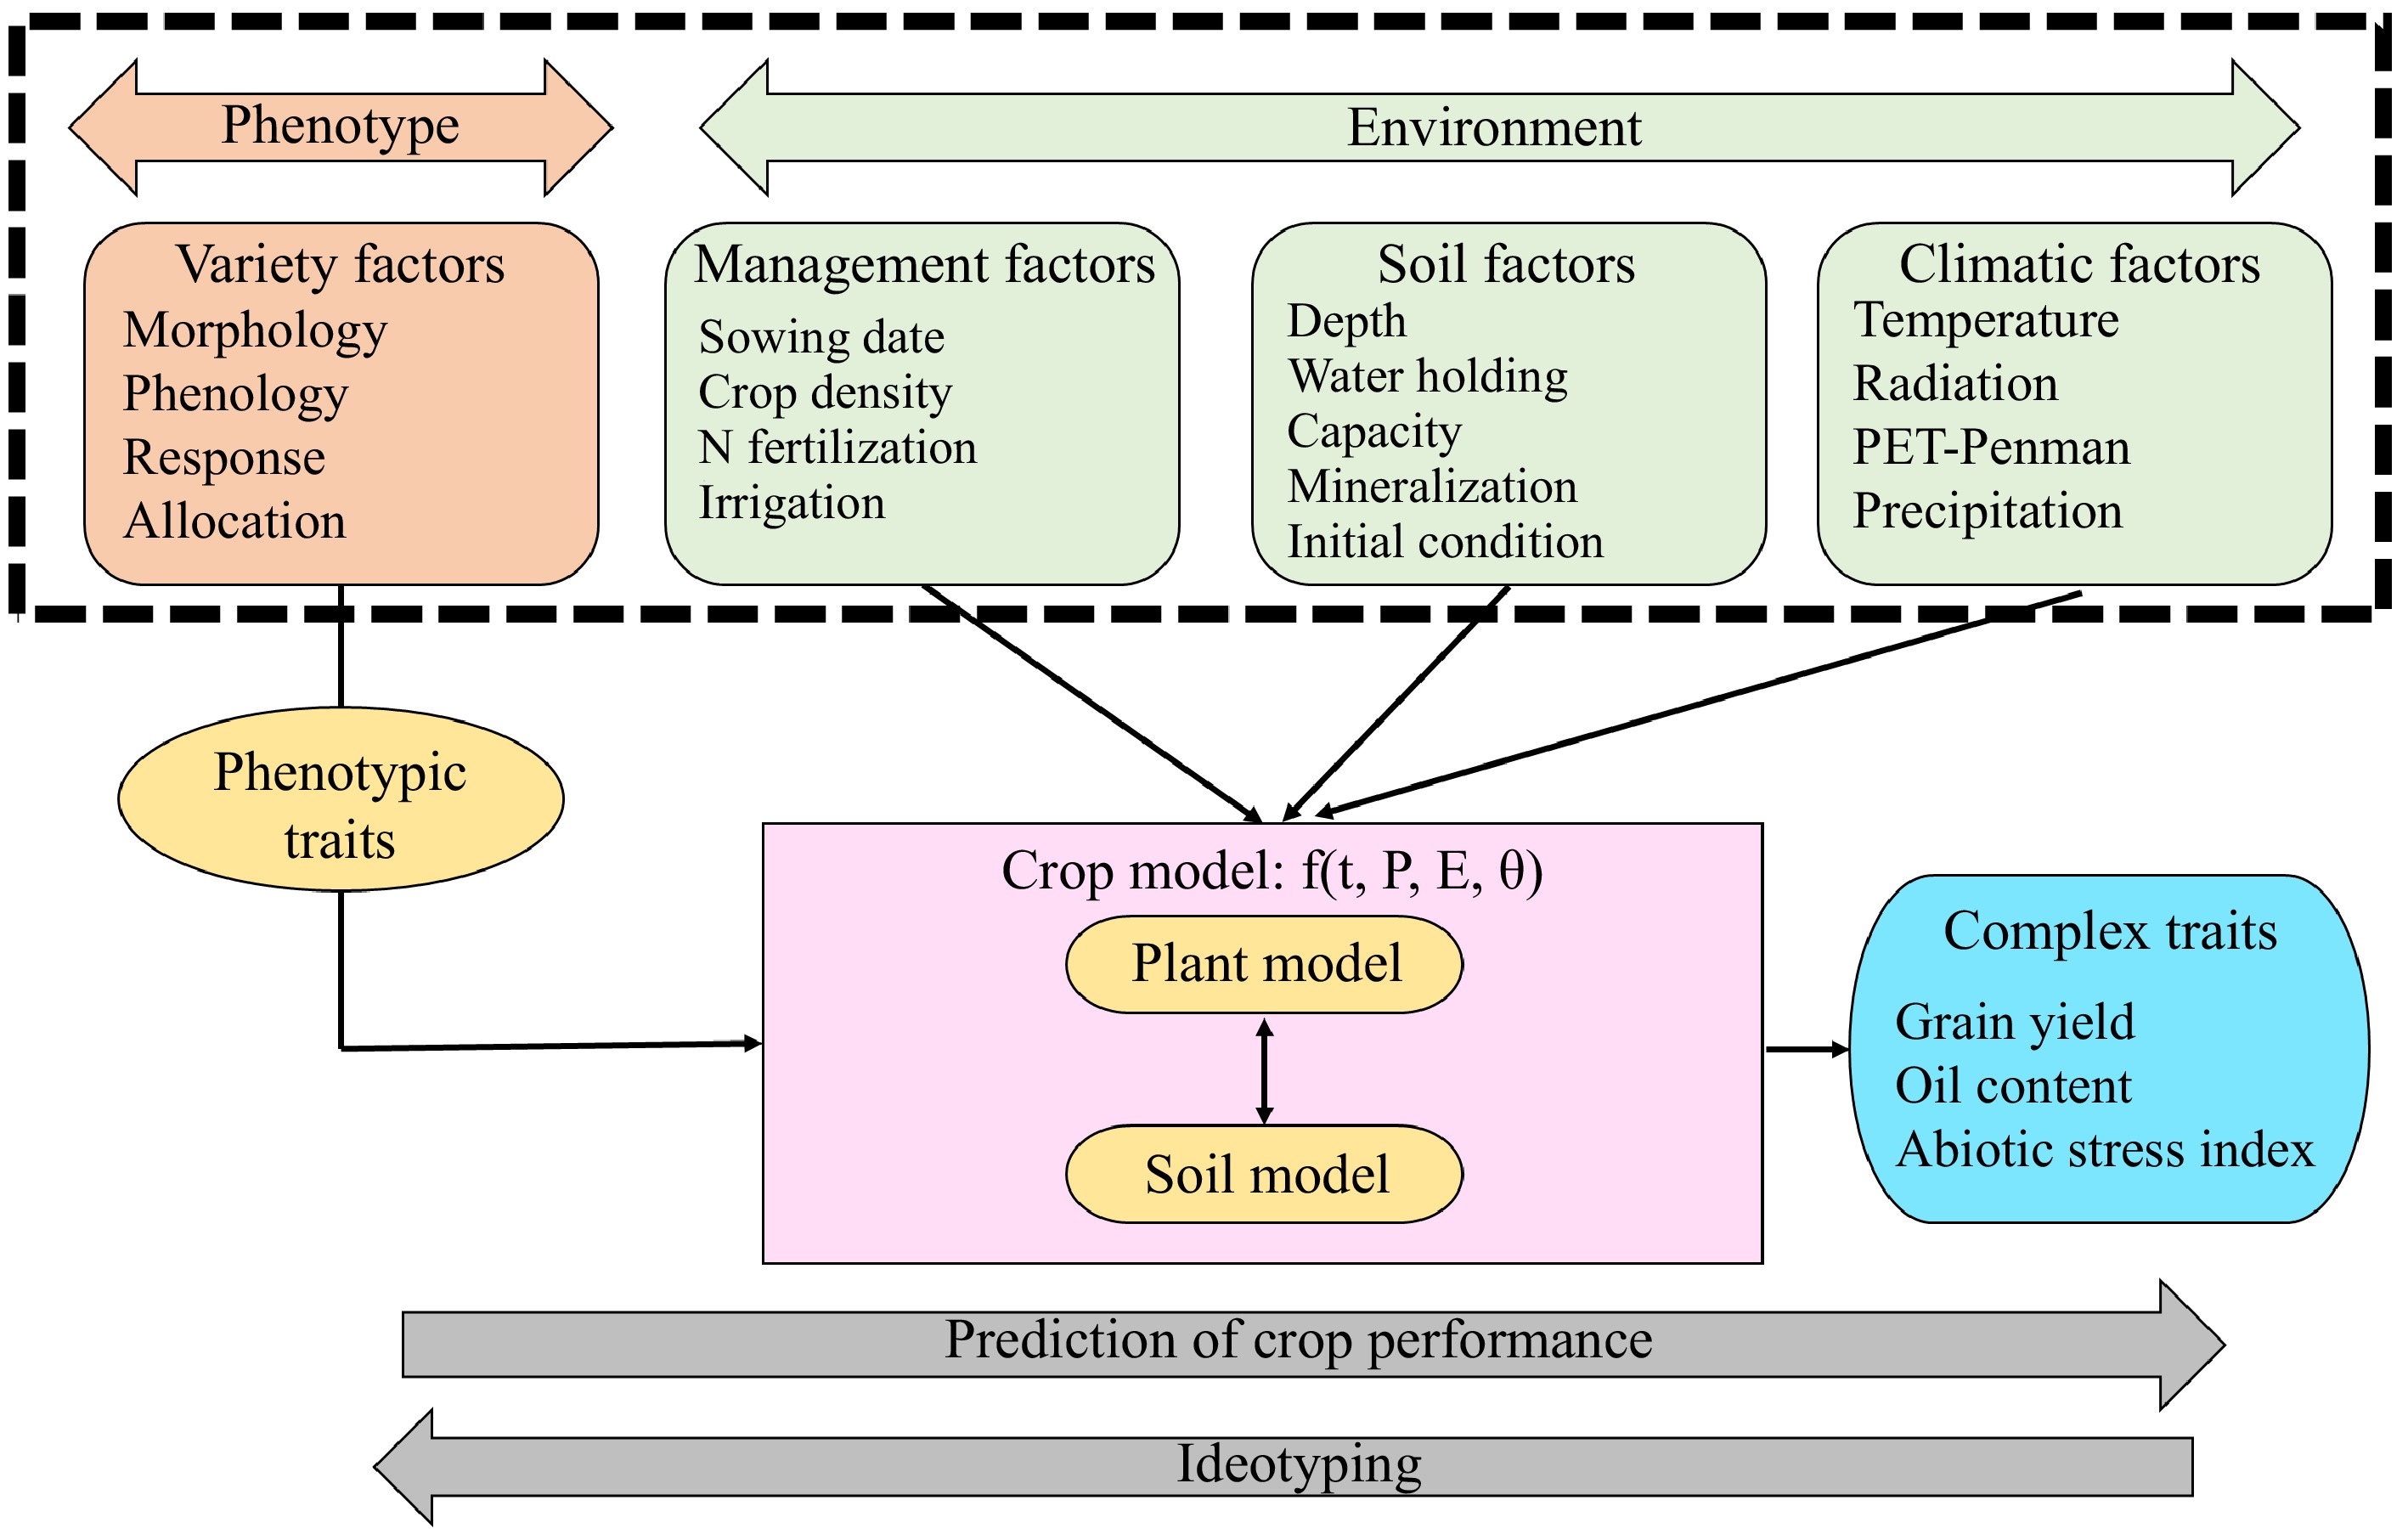
Figure 5.
Schematic representation of the SUNFLO crop model (modified from Casadebaig et al.[128]).
-
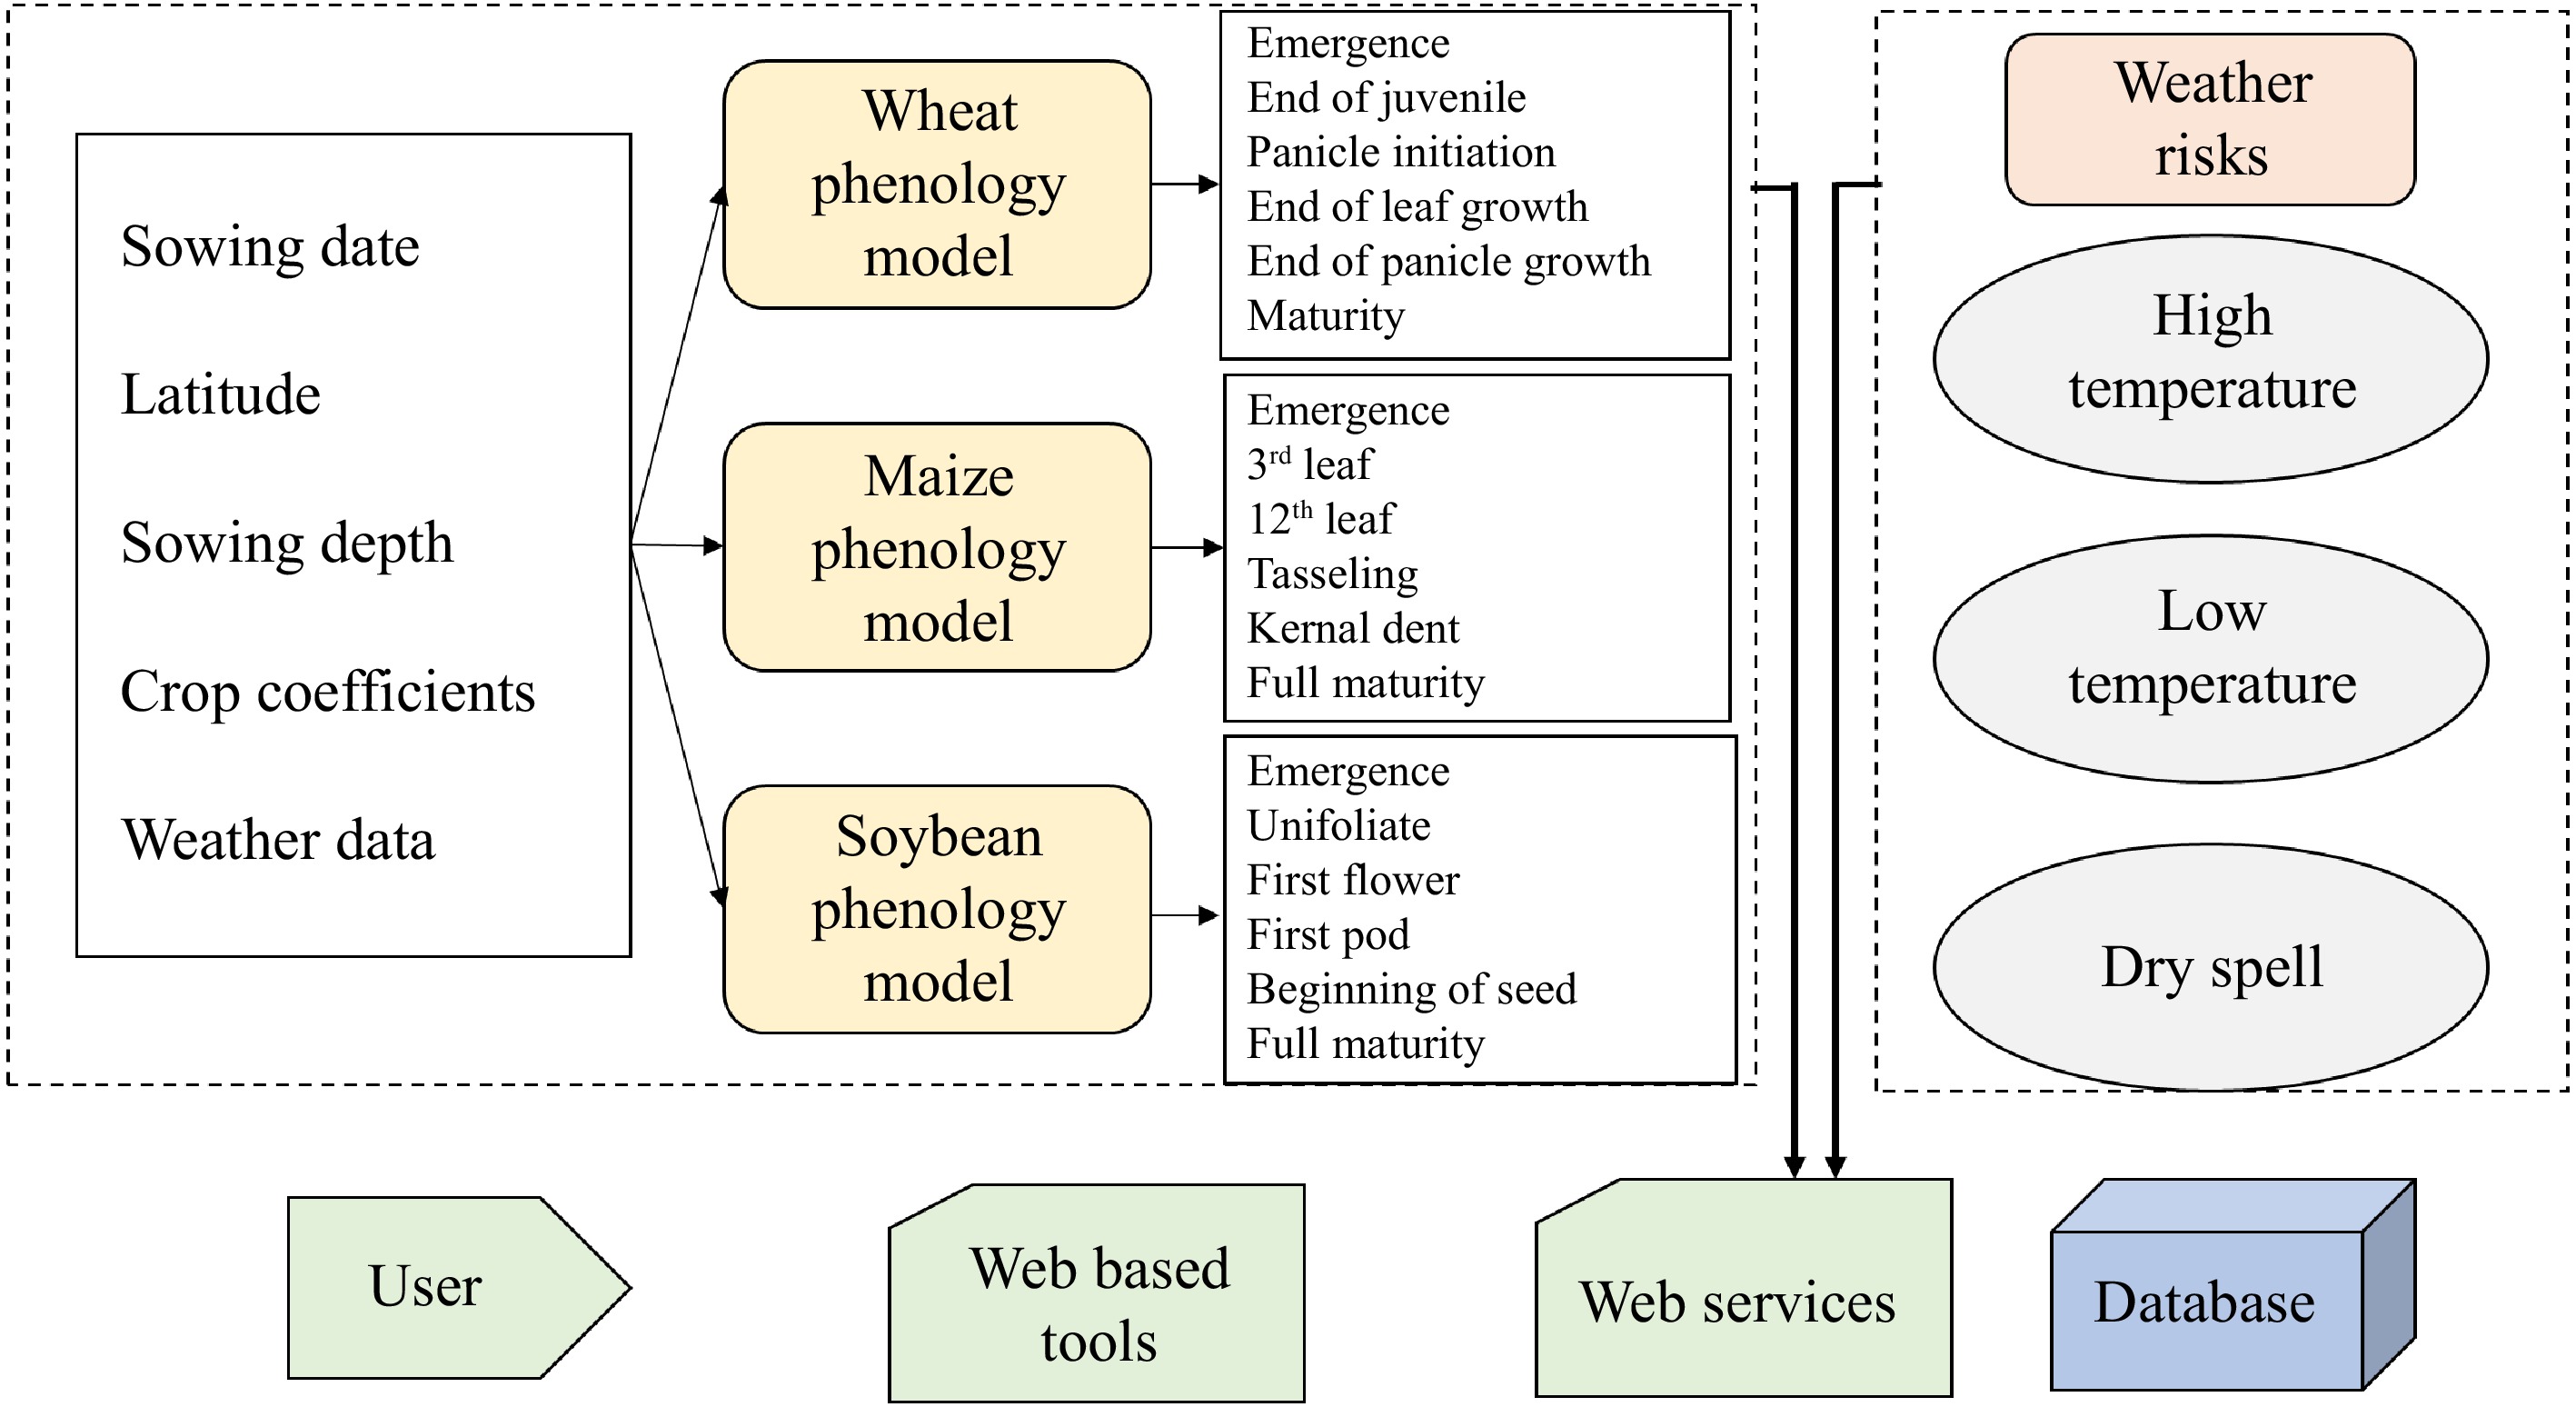
Figure 6.
The system structure for web services integrates a crop simulation model and web-based tools (adapted from Perondi et al.[138]).
-
Decision tools Application Ref. Amaize-N Forecasting crop yield and N-fertilizer requirements, and planning N-fertilizer and irrigation applications for site-specific maize crops nitrogen recommendation for maize [110] NuDSS Software for Irrigated Rice Nutrient management as well as a tool for SSNM for rice [111] Nutrient
ExpertSoftware for formulation of fertilizer recommendations as well as SSNM tool for maize and rice [112] QUEFTS Nutrient management for rice and wheat as well as SSNM tool for rice and wheat [112] Adapt-N Nitrogen management for maize and assessing the environmental fate of applied nitrogen [113] Expert-N Nitrogen management for wheat and annual crops [114] Table 1.
Summary of some of the decision tools widely used in crop nutrient management.
Figures
(6)
Tables
(1)