-
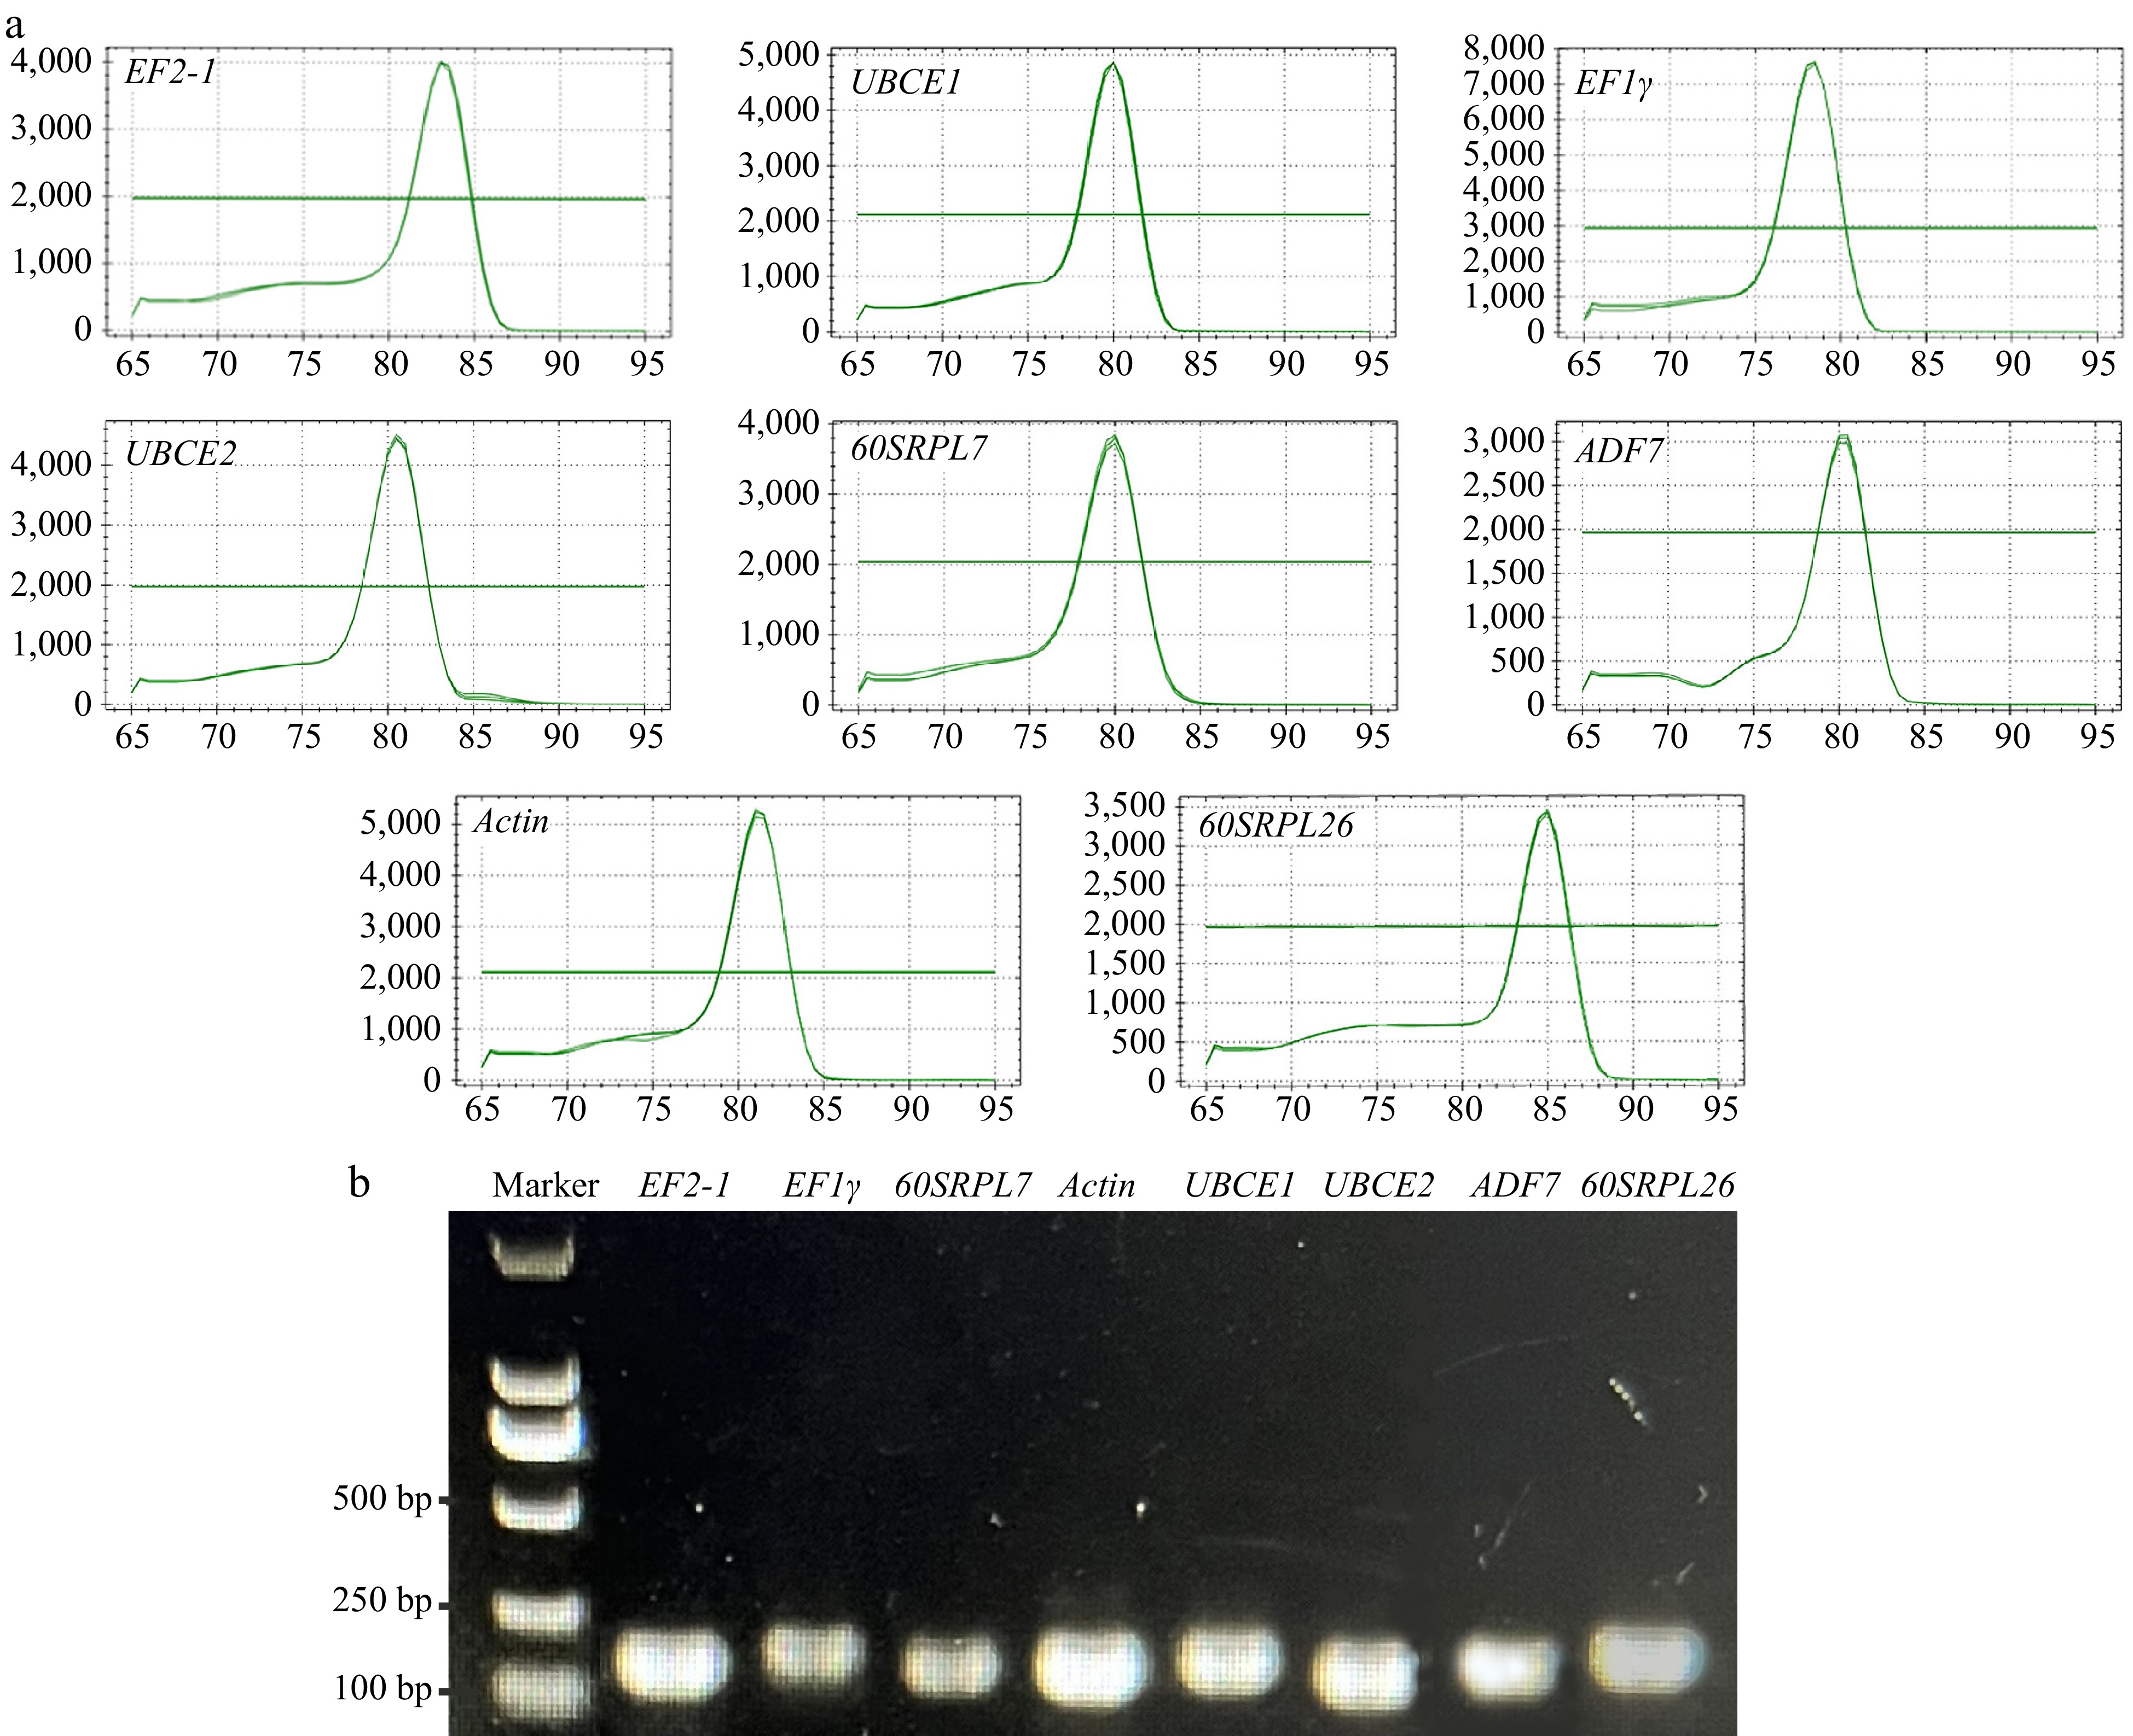
Figure 1.
Specificity of primer pairs for qRT-PCR amplification. (a) Melting curve analysis displayed a single peak for each amplicon. (b) Agarose gel electrophoresis revealed that all eight candidate RGs were specifically amplified with a single amplicon of the expected sizes.
-
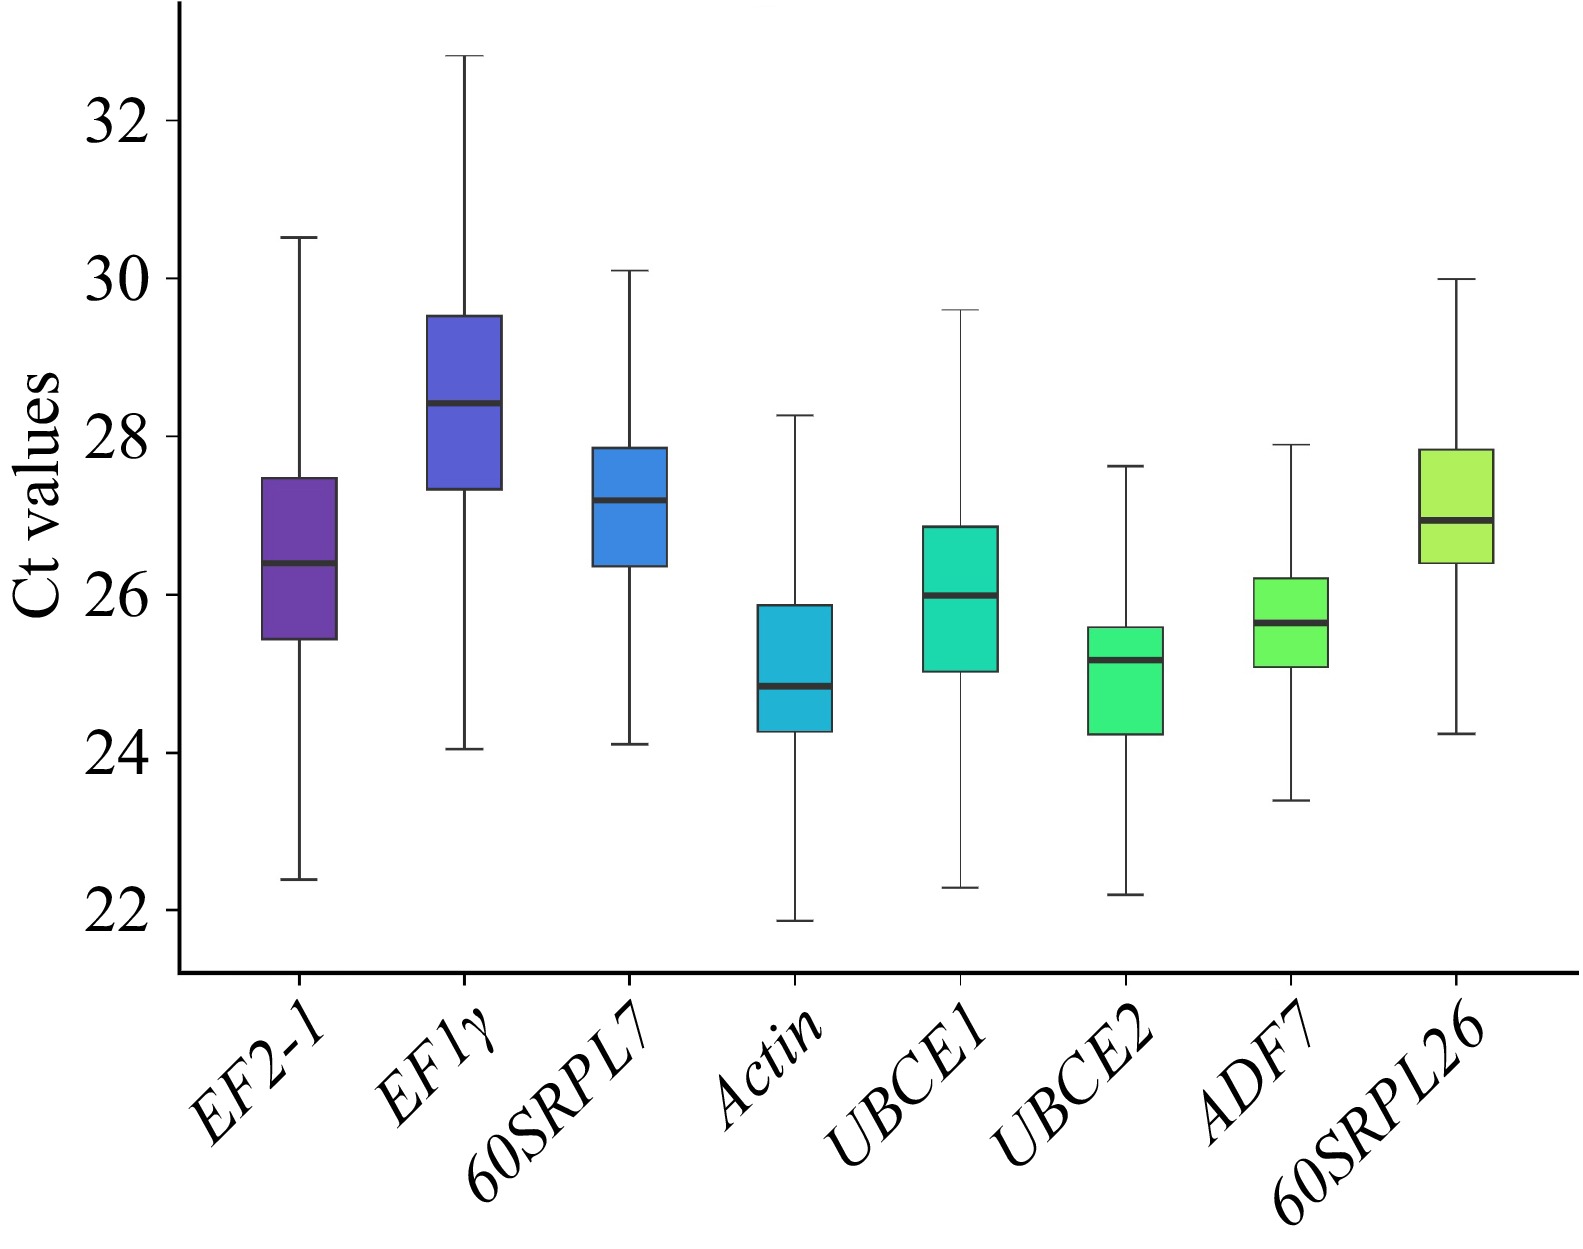
Figure 2.
The Cq values of the candidate reference genes across all samples. Lines across the box indicated the median. Lower and upper boxes showed 25th percentile to the 75th percentile. Whiskers represented the maximum and minimum values.
-

Figure 3.
Average expression stability values (M) and the ranking of eight candidate reference genes as calculated by geNorm. The horizontal axis represents the different genes, while the vertical axis indicates the average expression stability. A lower value signifies greater stability in gene expression level.
-
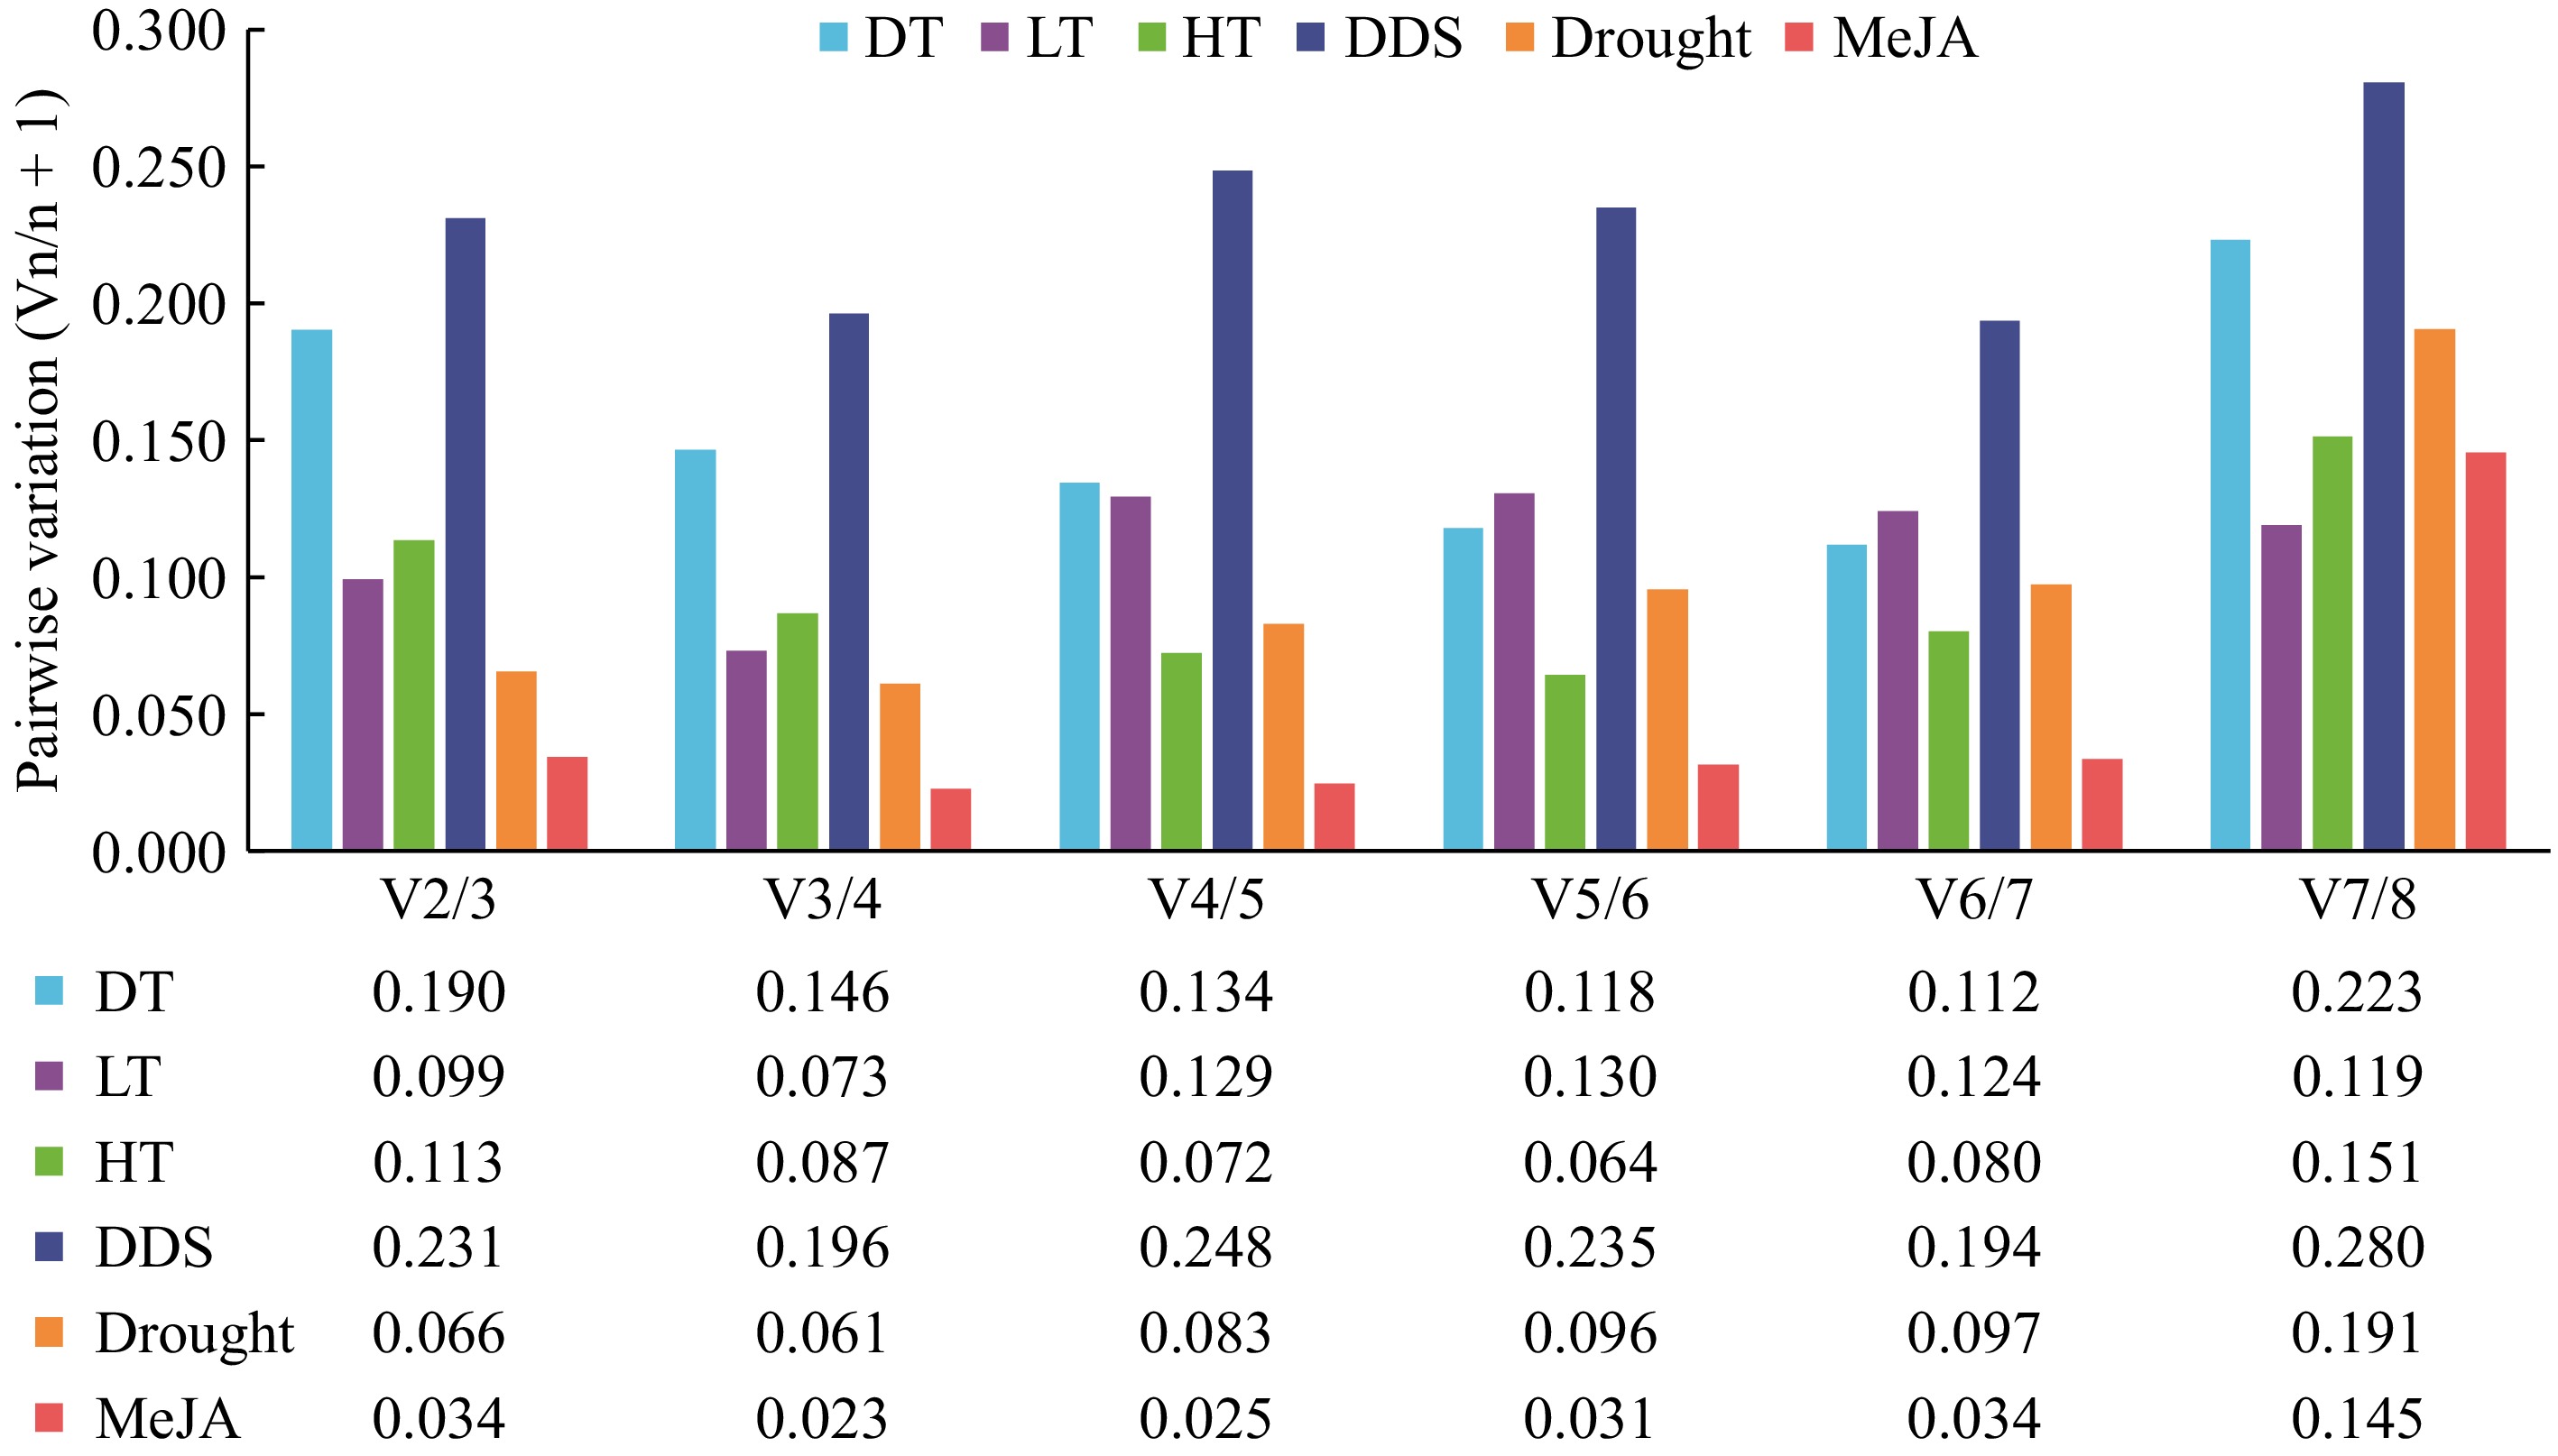
Figure 4.
Pairwise variation analysis of candidate reference genes. The geNorm software was utilized to analyze the pairwise variation (Vn/Vn+1) between the normalization factors (NF) NFn and NFn+1 in order to determine the optimal number of candidate reference genes necessary for RT-qPCR data normalization. If Vn/Vn+1 is less than 0.15, the minimum value of n represents the optimal number of genes required.
-
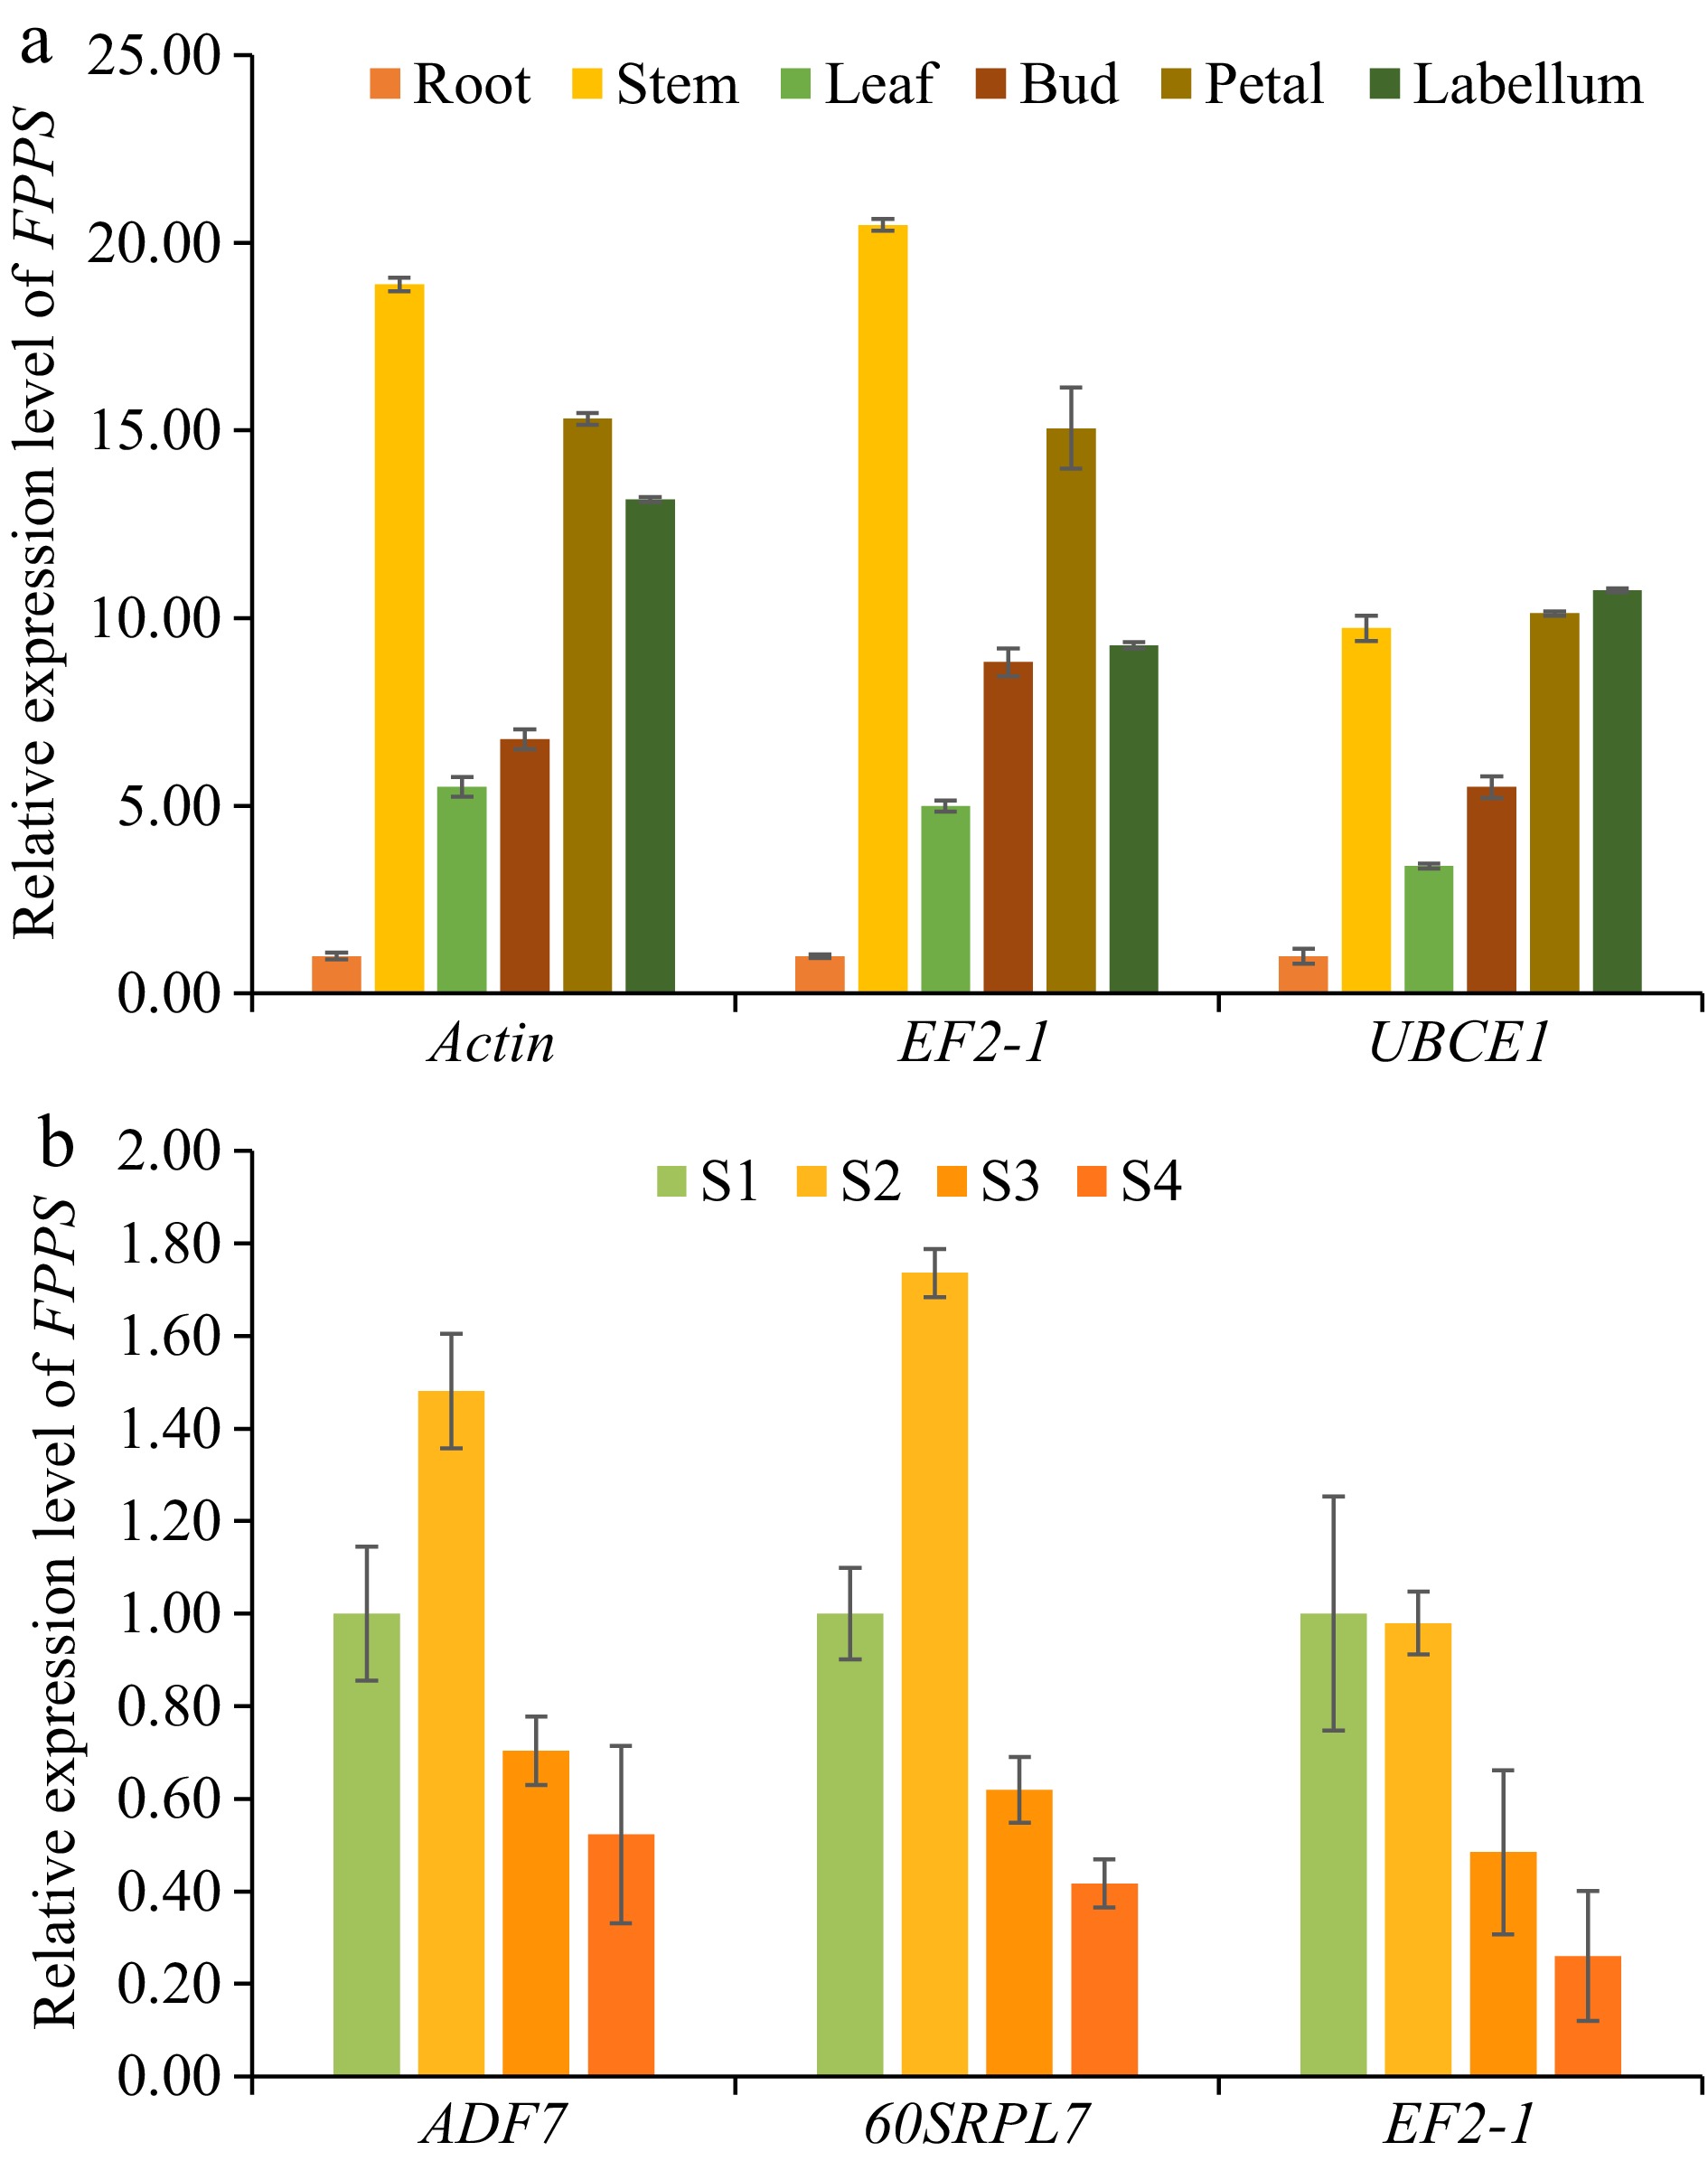
Figure 5.
The expression patterns of DnFPPS in D. nobile were examined in DT and DDS samples to validate selected reference genes (RGs) for normalization. (a) The expression levels of DnFPPS were evaluated among different tissues using various reference genes: the most stable RG, Actin; the second stable RG, EF2-1; the least stable RG, UBCE1. (b) The expression levels of DnFPPS were assessed across different developmental stages using the different reference genes: the most stable RG, ADF7; the second stable RG, 60SRPL7; the least stable RG, EF2-1. The expression levels of root and S1 in D. nobile were set to a value of 1. The bars represent standard errors. Three biological replicates were taken for each treatment in the qRT-PCR experiment and RNA-seq. Data are presented as average ± SD.
-
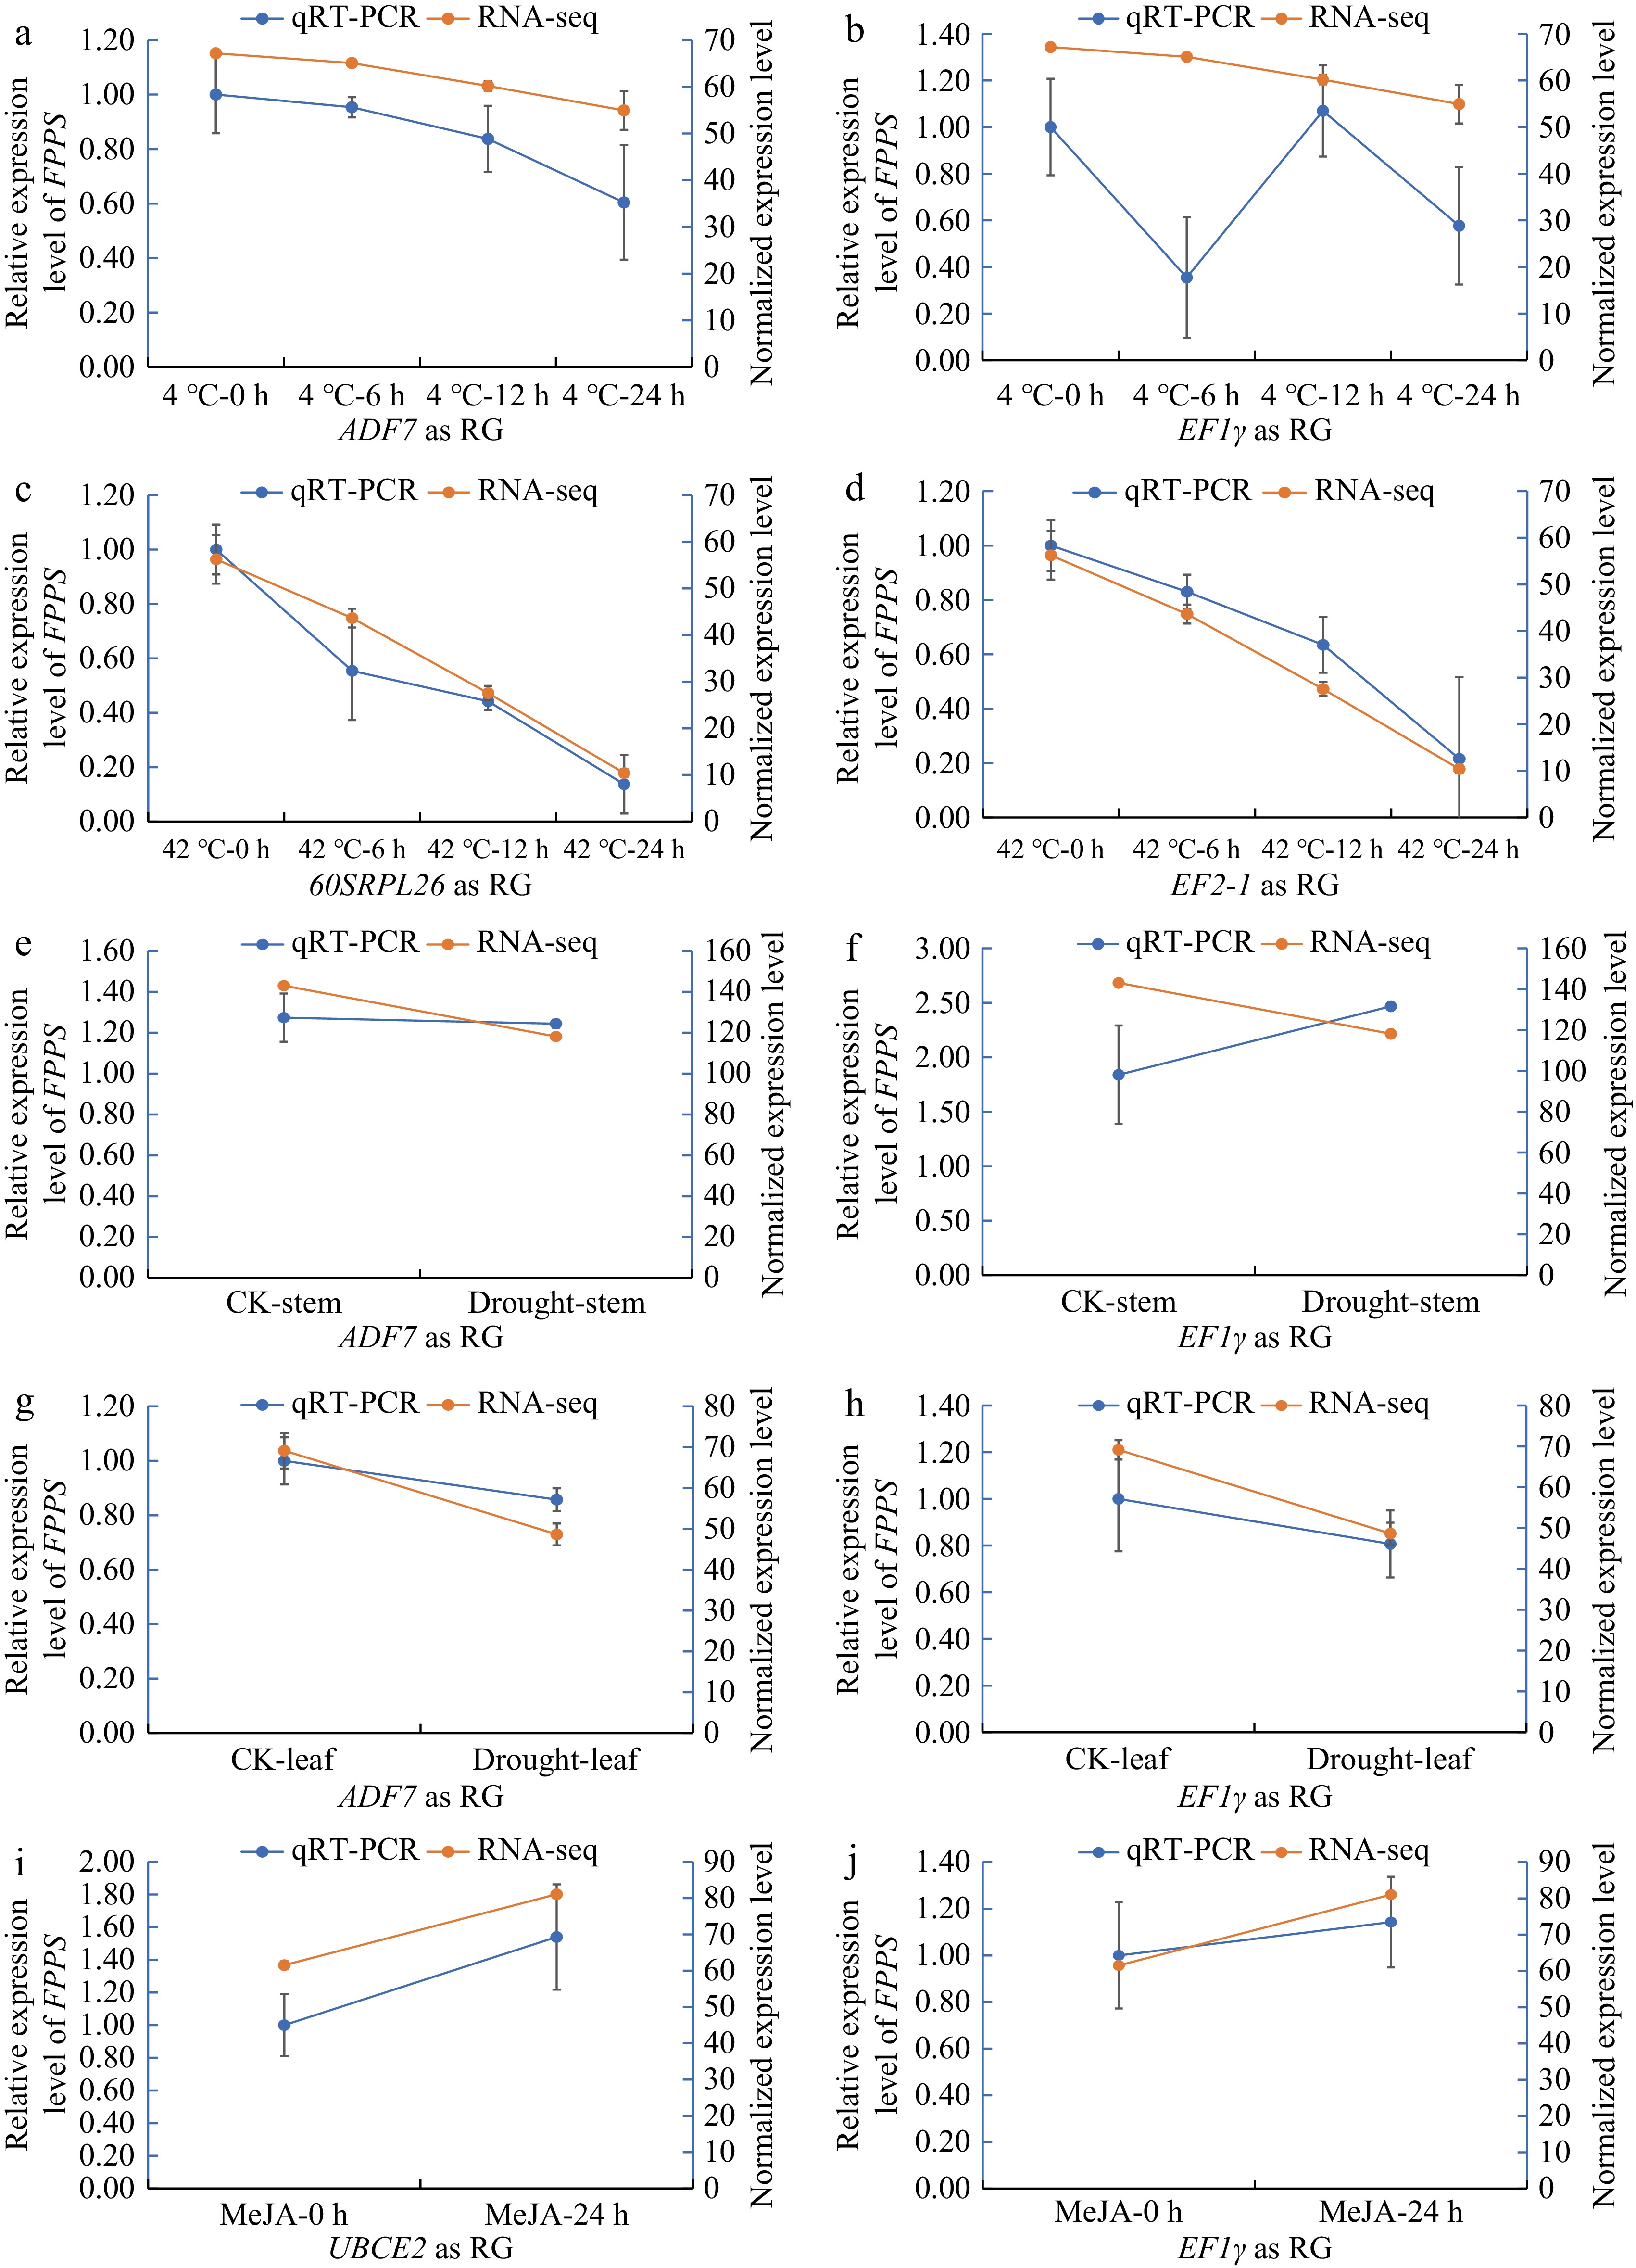
Figure 6.
qRT-PCR was conducted using the most stable RGs and the least stable RGs to validate the expression levels of DnFPPS based on previous transcriptome data under various abiotic stress conditions. (a), (b) The expression level of DnFPPS under low temperature (4 °C). The X-axis labels represent different time points after cold stress, with the most stable gene (ADF7) used as the RG and the least stable gene (EF1γ) alos used as RG, respectively. (c), (d) The expression level of DnFPPS under high temperature (42 °C). The X-axis labels represent different time points after high temperature stress, with the most stable gene (60SRPL26) as reference gene and the least stable gene (EF2-1) as reference gene. The expression level of DnFPPS under drought in the (e), (f) stem, and (g), (h) leaf. The most stable gene (ADF7) served as the reference gene, while the least stable gene (EF1γ) was also used as a reference gene. (i), (j) The expression level of DnFPPS under MeJA stress, with the most stable gene (UBCE2) as the reference gene and the least stable gene (EF1γ) as the reference gene. Three biological replicates were collected for each treatment in the qRT-PCR experiment, and two biological replicates were used for RNA-seq. Data are presented as the average ± SD.
-
Biological process Experimental conditions Sampling tissue Different tissues Normal development Root, stem, leaves, bud, petal, labellum Different developmental stages Normal development Leaves Cold stress 4 °C for 0, 6, 12, 24 h Leaves High temperature stress 42 °C for 0, 6, 12, 24 h Leaves Drought stress Drought of 30 d Leaves MeJA spraying MeJA oncentration: 100 μmol /L Leaves Table 1.
Detailed information of experimental samples.
-
Gene ID Gene symbol Gene description Primer sequence (5'−3') Tm of primer GC (%) Amplicon length (bp) Amplification efficiency (%) R2 evm.model.Chr04.142 EF2-1 Elongation factor 2 F: GGAAAACATGCGTGGGATATG 57.65 47.62 127 97.1 0.927 R: GGCTGTCAACTGAGATGCGTAG 61.3 54.55 evm.model.Chr15.1445 EF1γ Elongation factor 1 F: GCACGCTATGTTACCCGATTG 59.74 52.38 171 102.7 0.943 R: CTCCACCTGGGCATTGTATTG 58.97 52.38 evm.model.Chr09.1351 60SRPL7 60S ribosomal protein L7-4 F: TCATTGAGCAGGGTCTTGGG 59.67 55 117 105.3 0.909 R: GCTTGAACGGCCACAAGAAG 60.04 55 evm.model.Chr15.1732 Actin Actin-7 F: AGAGATAACTGCACTTGCTCCTAG 59.9 45.83 130 98.1 0.998 R: GGAAATCCACATCTGCTGGAAAG 59.87 47.83 evm.model.Chr09.2262 UBCE1 Ubiquitin-conjugating enzyme E2 7 F: TATGAGCTTGCAAGTGAACGTTG 60.06 43.48 121 99.1 0.998 R: CTTTTGCAGCTTCCACATTTGC 59.78 45.45 evm.model.Chr04.115 UBCE2 Ubiquitin-conjugating enzyme E2 2 F: AATCCCAATTCACCTGCAAACTC 59.7 43.48 100 93 0.991 R: TCCAGCTTTGTTCAACAATCTCC 59.43 43.48 evm.model.Chr01.1237 ADF7 Actin-depolymerizing factor 7 F: CATAGCCTGGTCTCCTGACAC 59.86 57.14 111 99.1 0.976 R: GTTGCTTGCAACTCCACCTG 59.97 55 evm.model.Chr04.978 60SRPL26 60S ribosomal protein L26-2 F: AATGGATCAACAGTCAACGTTGG 59.75 43.48 135 91 0.951 R: AAACTTTCCTTTGGCCTTGTCAG 59.87 43.48 evm.model.Chr08.388 FPPS Farnesyl pyrophosphate synthase F: GATTATACTTCGTAACCACATCCCC 59.07 44 253 − − R: CATTAACAAGGCACATGCAACAG 59.32 43.5 Table 2.
Detail of primer sequences and related information.
-
Rank DT DDS LT HT Drought MeJA 1 Actin ADF7 ADF7 UBCE1 EF2-1 Actin Stability value 0.2604 0.1643 0.085 0.076 0.0809 0.0182 2 UBCE2 60SRPL26 60SRPL7 60SRPL26 60SRPL7 UBCE2 Stability value 0.2821 0.2458 0.135 0.105 0.0938 0.0182 3 EF2-1 60SRPL7 EF2-1 Actin ADF7 ADF7 Stability value 0.2962 0.4770 0.247 0.187 0.1332 0.0291 4 ADF7 Actin UBCE2 ADF7 UBCE1 UBCE1 Stability value 0.4106 0.5031 0.252 0.203 0.2109 0.0493 5 EF1γ UBCE1 UBCE1 UBCE2 UBCE2 60SRPL26 Stability value 0.4378 0.6330 0.416 0.255 0.2843 0.1276 6 60SRPL7 UBCE2 Actin 60SRPL7 Actin EF2-1 Stability value 0.4601 0.9507 0.514 0.288 0.3676 0.1295 7 60SRPL26 EF1γ EF1γ EF1γ 60SRPL26 60SRPL7 Stability value 0.5077 1.0981 0.582 0.394 0.4677 0.2367 8 UBCE1 EF2-1 60SRPL26 EF2-1 EF1γ EF1γ Stability value 1.227 1.535 0.646 0.835 1.052 0.806 Table 3.
The expression stability of eight candidate RGs was analyzed by NormFinder.
-
Rank DT DDS LT HT Drought MeJA 1 Actin UBCE2 Actin ADF7 60SRPL26 60SRPL26 SD ± CV 0.49 ± 1.92 0.33 ± 1.42 0.31 ± 1.29 0.22 ± 0.86 0.42 ± 1.56 0.02 ± 0.07 2 EF2-1 EF1γ ADF7 60SRPL26 UBCE1 EF2-1 SD ± CV 0.50 ± 1.88 0.34 ± 1.26 0.64 ± 2.51 0.25 ± 0.94 0.46 ± 1.71 0.05 ± 0.17 3 UBCE2 UBCE1 60SRPL7 UBCE1 ADF7 60SRPL7 SD ± CV 0.60 ± 2.39 0.49 ± 2.04 0.74 ± 2.73 0.25 ± 0.96 0.46 ± 1.76 0.09 ± 0.33 4 ADF7 60SRPL26 60SRPL26 UBCE2 60SRPL7 UBCE2 SD ± CV 0.68 ± 2.63 1.13 ± 4.26 0.74 ± 2.82 0.28 ± 1.10 0.53 ± 1.95 0.10 ± 0.38 5 EF1γ ADF7 EF2-1 60SRPL7 EF2-1 Actin SD ± CV 0.72 ± 2.49 1.25 ± 4.96 0.74 ± 2.98 0.34 ± 1.25 0.58 ± 2.14 0.10 ± 0.38 6 60SRPL26 60SRPL7 UBCE2 Actin UBCE2 EF1γ SD ± CV 0.76 ± 2.77 1.58 ± 6.19 0.78 ± 3.18 0.35 ± 1.44 0.63 ± 2.44 0.14 ± 3.95 7 60SRPL7 Actin UBCE1 EF1γ Actin ADF7 SD ± CV 0.82 ± 3.04 1.61 ± 6.61 0.91 ± 3.49 0.50 ± 1.77 0.70 ± 2.75 0.15 ± 0.55 8 UBCE1 EF2-1 EF1γ EF2-1 EF1γ UBCE1 SD ± CV 1.16 ± 4.55 2.68 ± 10.42 1.24 ± 4.42 1.09 ± 4.09 1.47 ± 4.87 0.26 ± 0.95 Table 4.
The expression stability of eight candidate reference genes was analyzed by Bestkeeper.
-
Rank DT DDS LT HT Drought MeJA 1 Actin ADF7 ADF7 60SRPL26 ADF7 Actin 0.84 1.16 0.59 0.51 0.54 0.27 2 EF2-1 60SRPL26 60SRPL7 UBCE1 60SRPL7 UBCE2 0.88 1.23 0.6 0.53 0.55 0.28 3 UBCE2 60SRPL7 EF2-1 ADF7 EF2-1 ADF7 0.91 1.31 0.64 0.55 0.57 0.29 4 ADF7 Actin UBCE2 Actin UBCE1 60SRPL26 0.92 1.33 0.65 0.57 0.58 0.3 5 60SRPL7 UBCE1 UBCE1 UBCE2 UBCE2 EF2-1 0.95 1.39 0.82 0.58 0.77 0.3 6 EF1γ UBCE2 Actin 60SRPL7 Actin UBCE1 1.01 1.59 0.9 0.6 0.77 0.34 7 60SRPL26 EF1γ EF1γ EF1γ 60SRPL26 60SRPL7 1.03 1.73 0.99 0.73 0.77 0.39 8 UBCE1 EF2-1 60SRPL26 EF2-1 EF1γ EF1γ 1.85 2.29 1.06 1.25 1.55 1.16 Table 5.
The expression stability of eight candidate reference genes when analyzed by ΔCt.
-
DT DDS LT HT Drought MeJA RGs Rank values RGs Rank values RGs Rank values RGs Rank values RGs Rank values RGs Rank values Actin 1.00 ADF7 1.97 ADF7 1.57 60SRPL26 1.57 ADF7 1.57 UBCE2 1.68 EF2-1 2.45 60SRPL7 2.71 60SRPL7 2.11 UBCE1 2.11 60SRPL7 2.00 Actin 1.78 ADF7 2.83 60SRPL26 2.83 EF2-1 2.45 ADF7 2.45 EF2-1 2.78 60SRPL26 2.91 UBCE2 3.08 Actin 3.25 Actin 3.83 UBCE2 3.16 UBCE1 3.46 EF2-1 3.76 60SRPL7 5.38 UBCE2 3.83 UBCE2 4.43 Actin 4.56 60SRPL26 3.96 ADF7 4.05 EF1γ 5.69 UBCE1 4.40 UBCE1 5.44 60SRPL7 5.18 UBCE2 5.69 60SRPL7 5.45 60SRPL26 6.48 EF1γ 5.12 60SRPL26 6.26 EF1γ 7.00 Actin 6.24 UBCE1 5.86 UBCE1 8.00 EF2-1 8.00 EF1γ 7.24 EF2-1 8.00 EF1γ 8.00 EF1γ 8.00 Table 6.
The expression stability of eight candidate RGs analyzed by RefFinder.
Figures
(6)
Tables
(6)