-

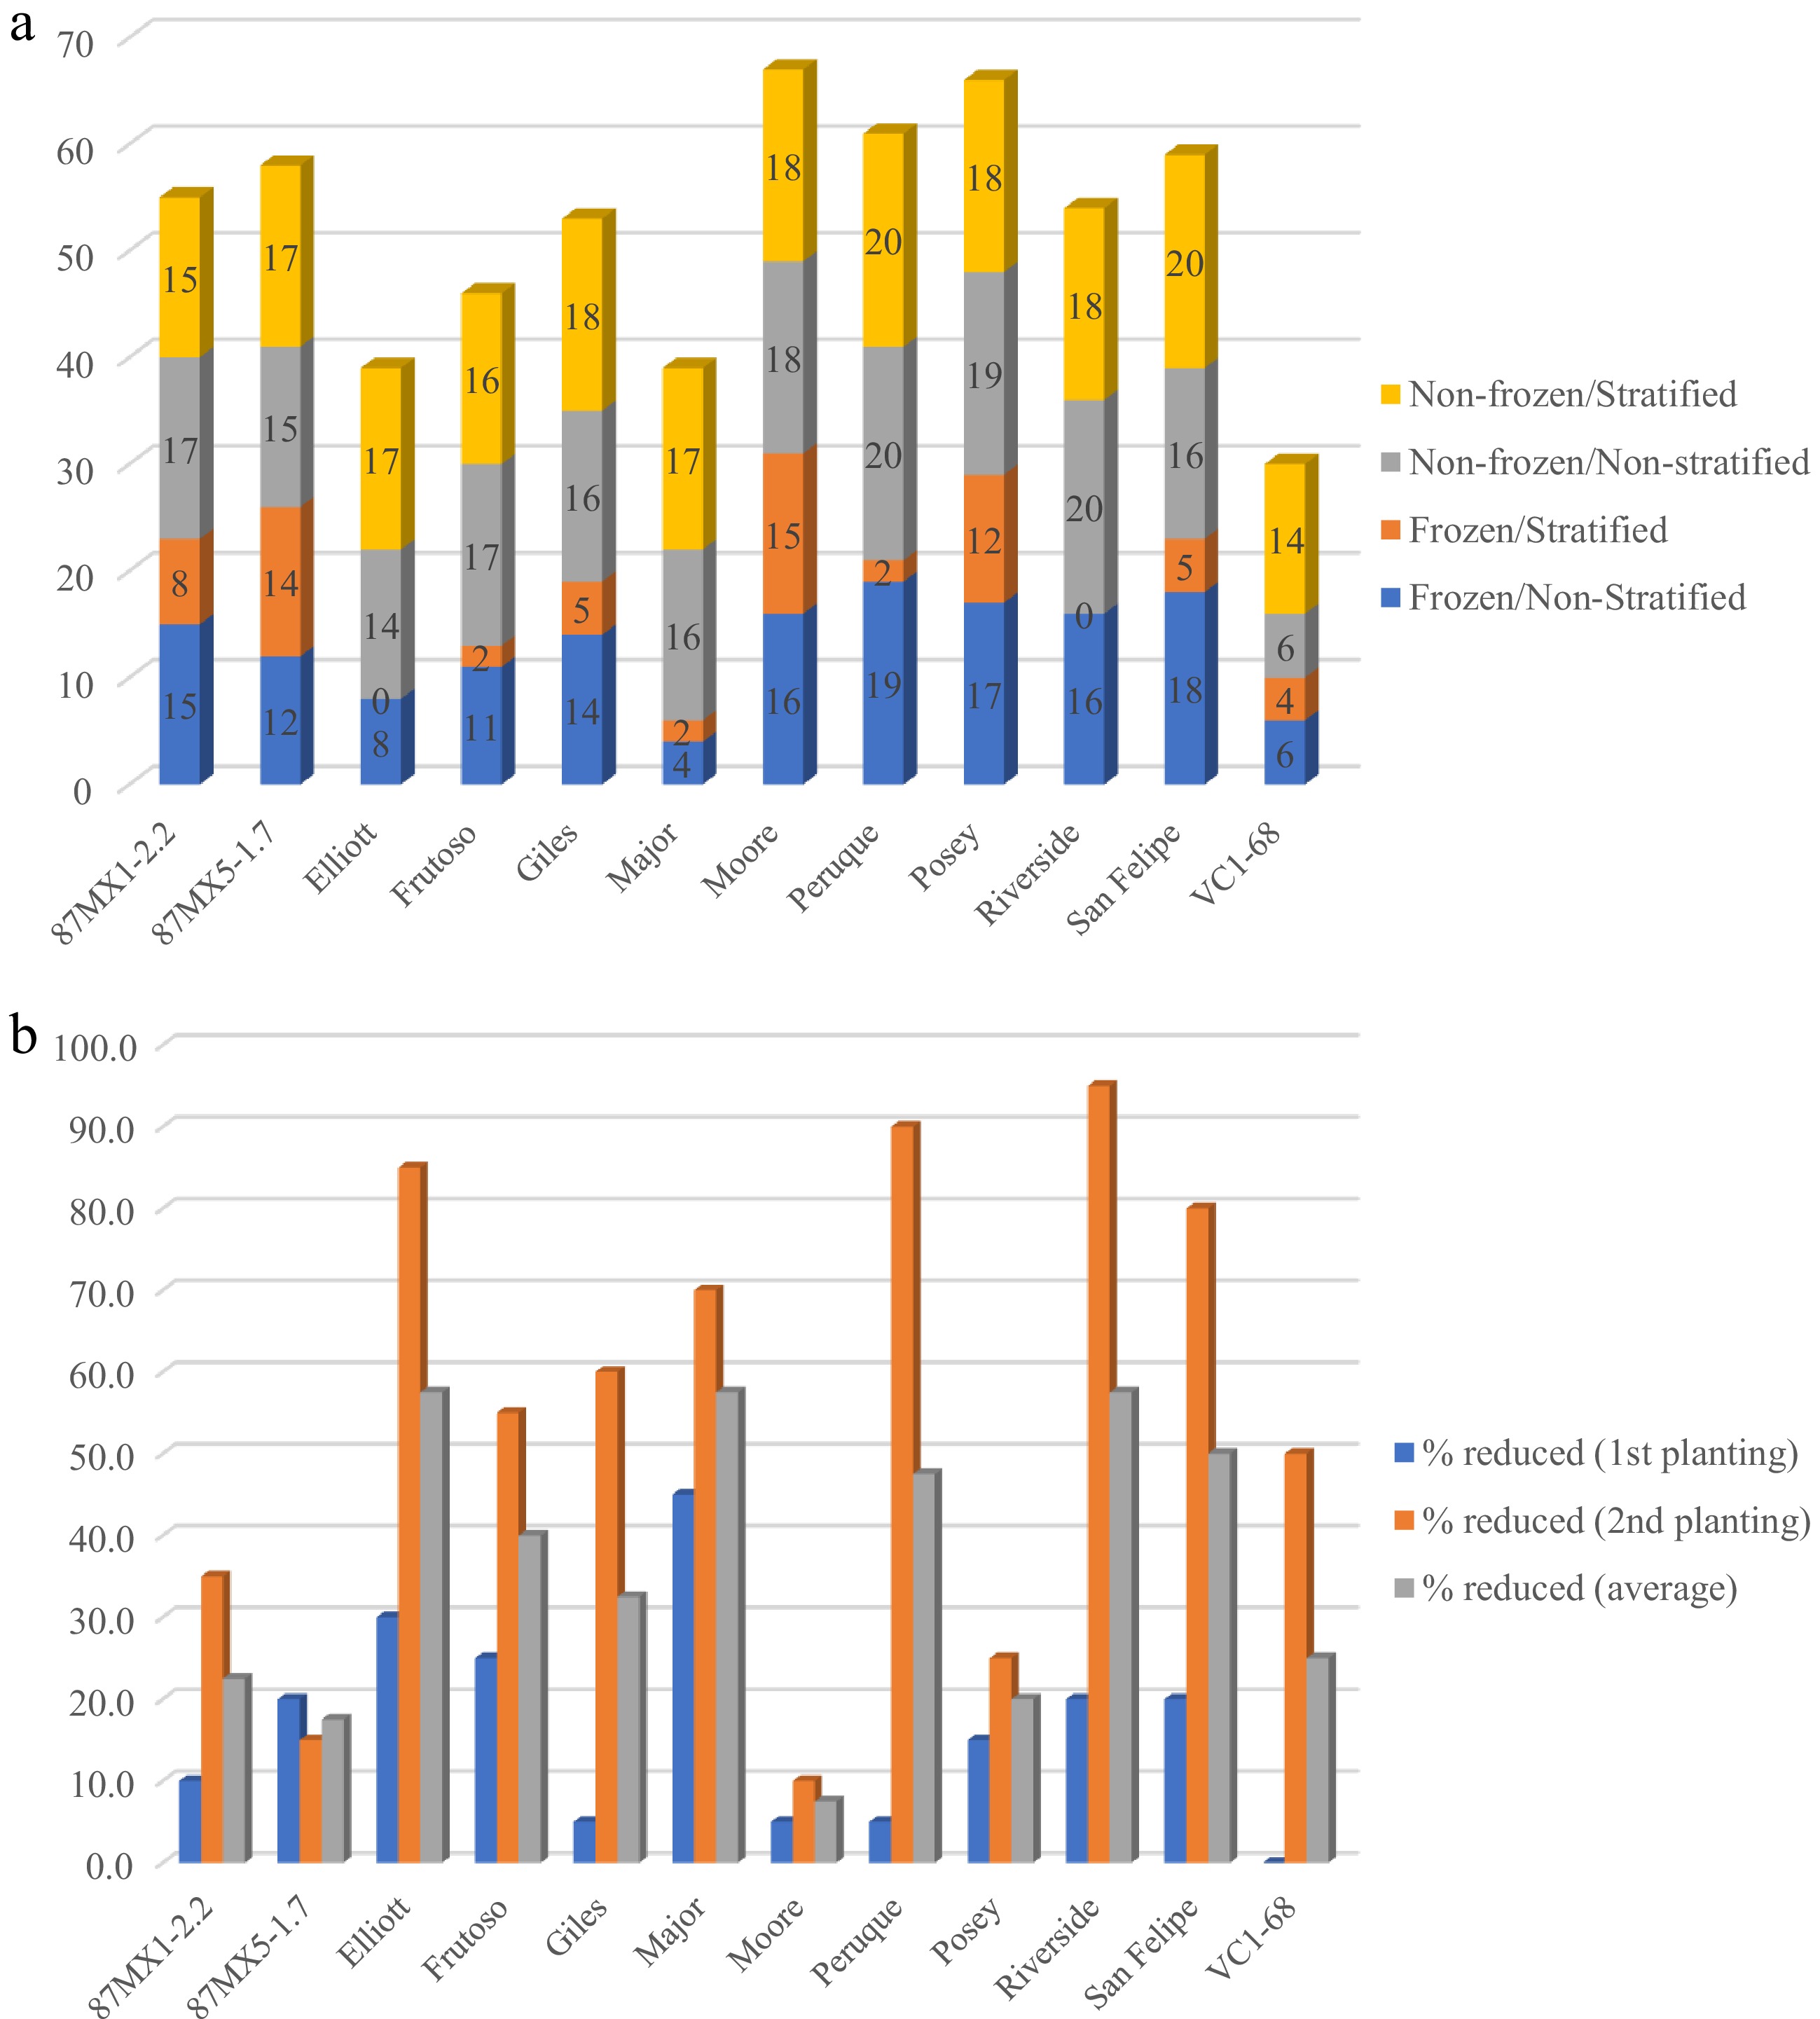
Figure 1.
(a) Numbers of germinated seeds of 12 seedstocks for each treatment of 20 seeds, and (b) percentage of seeds that failed to germinate in the first planting (frozen and non-frozen but non-stratified seeds) and the second planting (frozen and non-frozen but stratified).
-

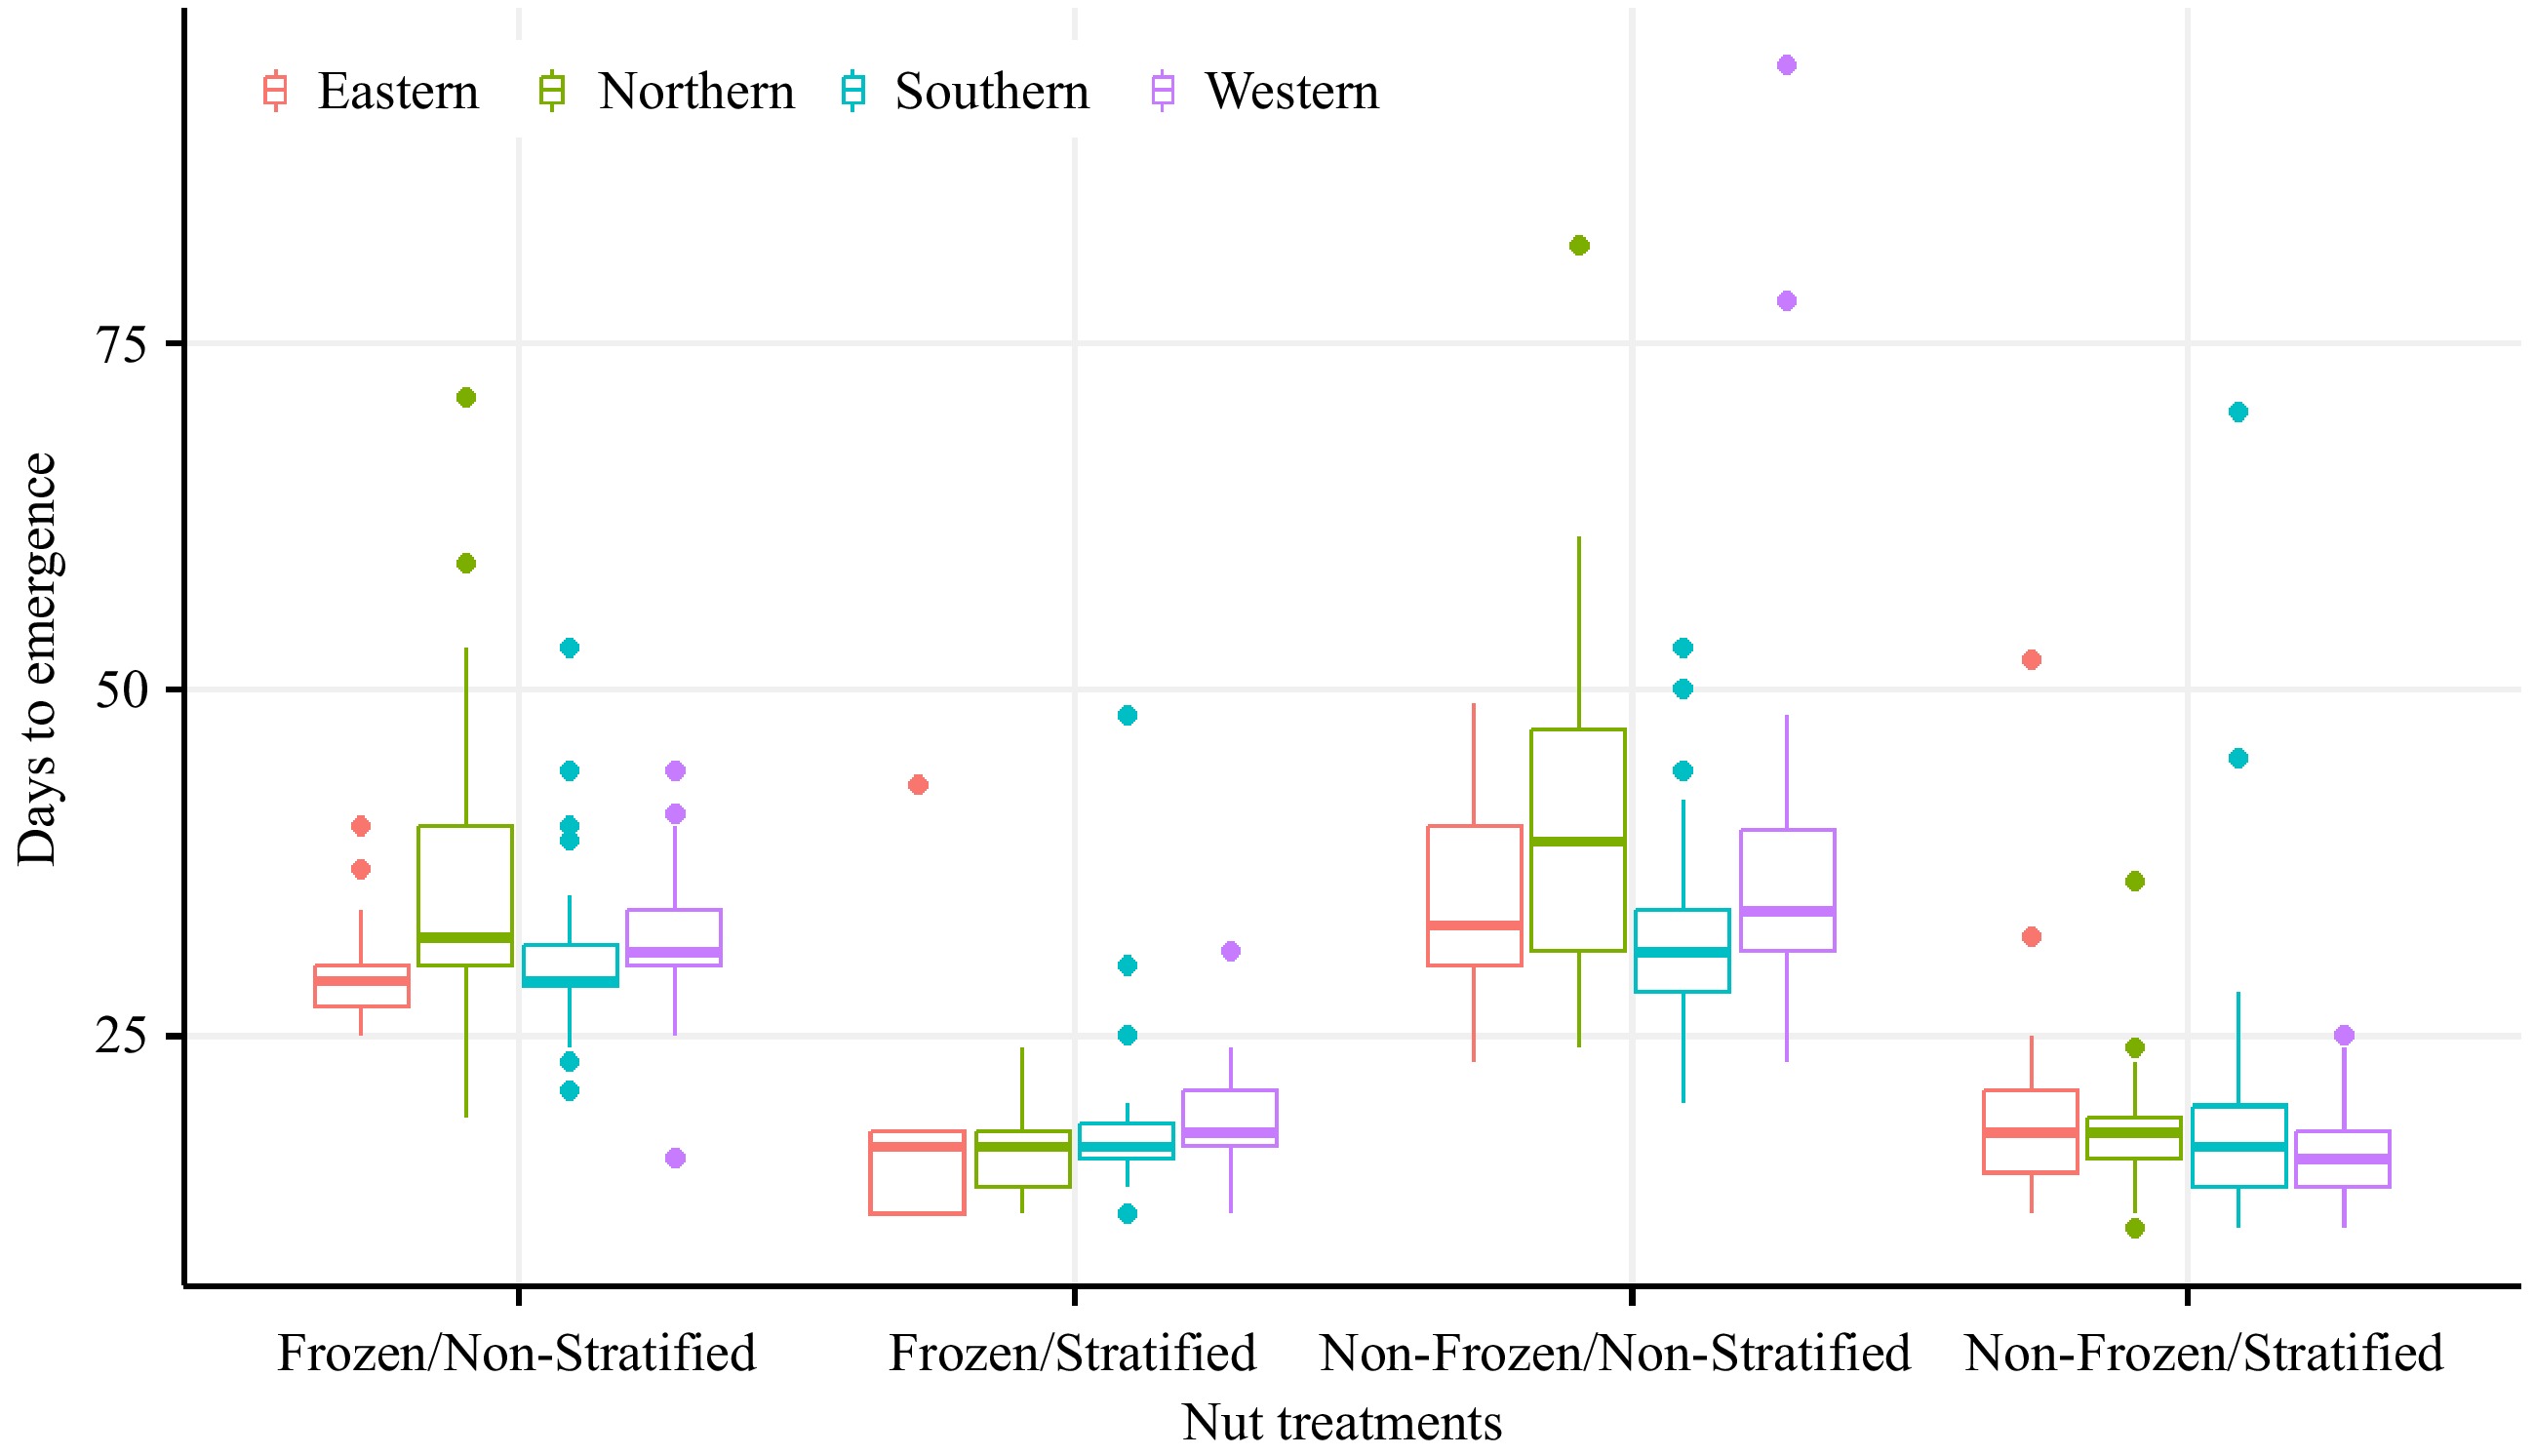
Figure 2.
The visual comparisons of days to emergence of the 12 seedstocks from four regions under different seed treatments.
-

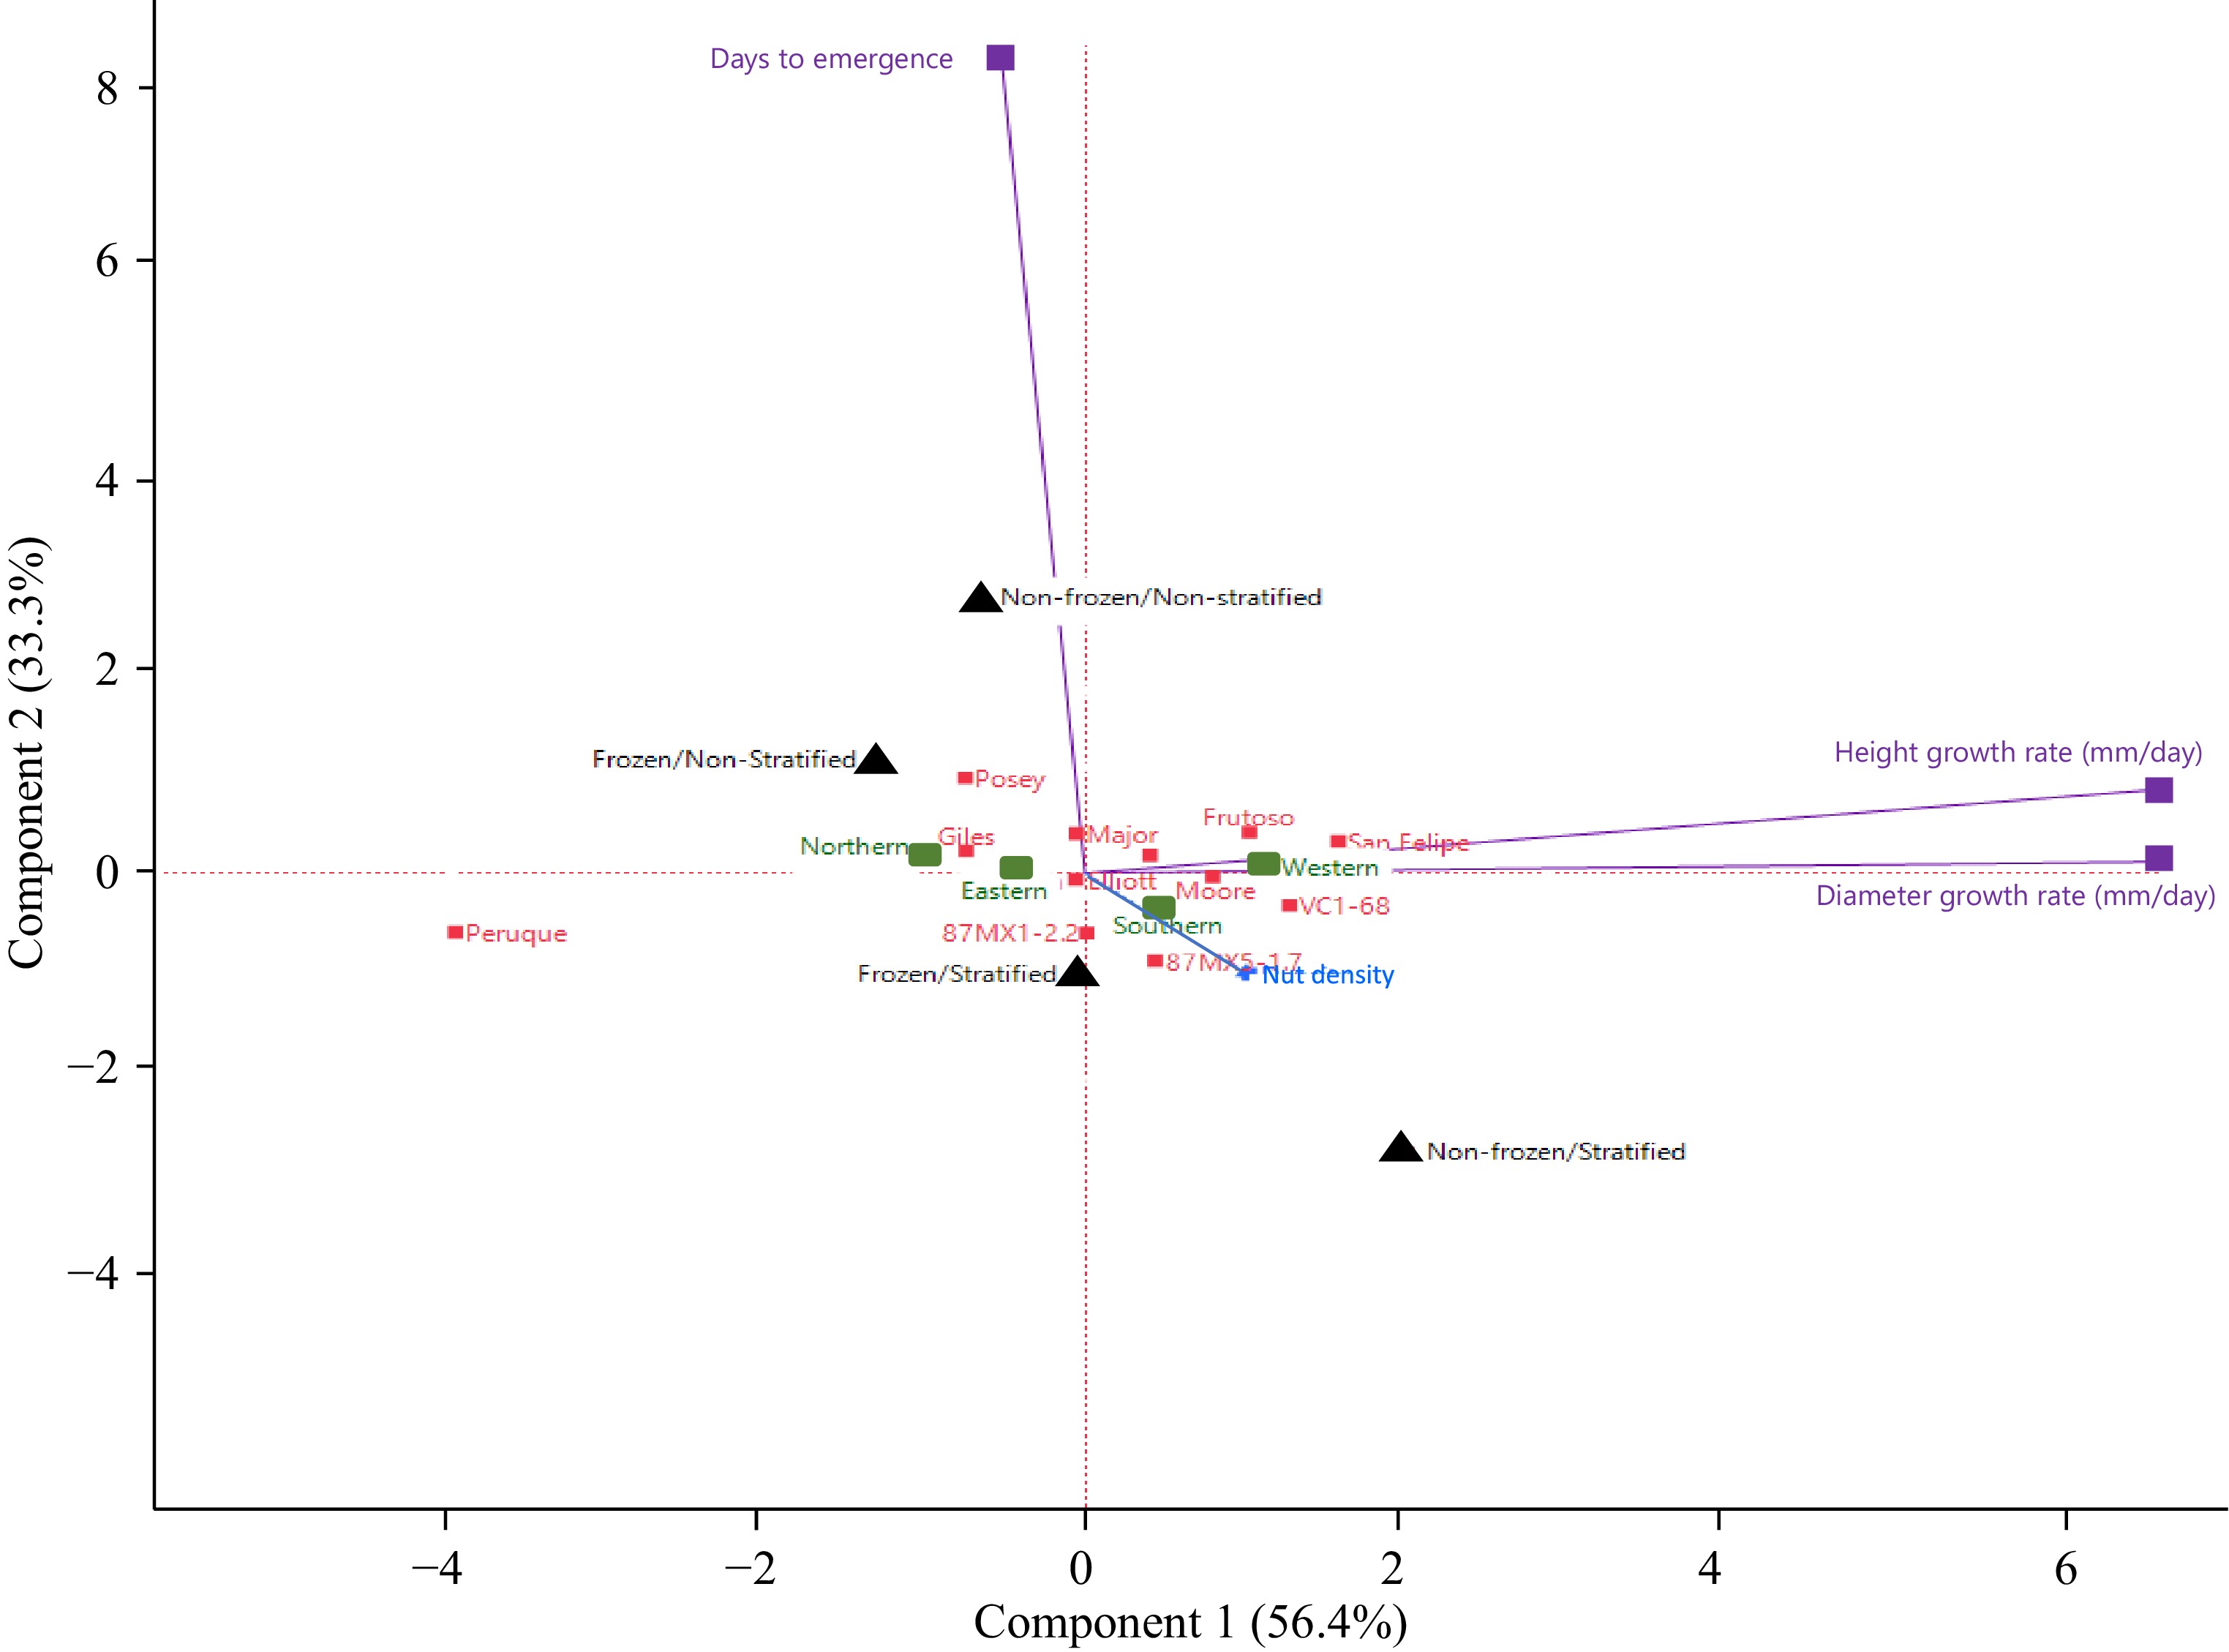
Figure 3.
PCA biplot of nut treatments to 12 seedstocks, origins, and nut density on nut germination, seedling height, and diameter. The explained variance of the axes is given in percentage. The eigenvalues of the first two PCA axes were 1.691 (56.4%) and 0.999 (33.3%), respectively. Treatments are presented in black, seedstocks in red, provenance origins in green, seed quality in blue, and phenotypic traits in purple.
-
Seedstock Orchard Row Tree Provenance Origin Grafted date 87MX1-2.2 CSP 4 3 Southern Santa Catarina, San Luis Potosi, MX 1990* 87MX5-1.7 CSP 16 9 Southern Jaumave, Tamaulipas, MX 1990* Frutoso BWRom 109 23 Southern Parras, Coahuila, MX 1992 Elliott BWV 5 42 Eastern Milton, Santa Rosa, FL 1993 Moore BWV 4 39 Eastern Waukeenah, Jefferson, FL 1993 Giles BWV 6 11 Northern Chetopa, Cherokee, KS 1991 Major BWV 6 21 Northern Green River, Henderson, KY 1991 Peruque BWV 8 36 Northern Peruque, St. Charles, MO 1991 Posey BWV 7 7 Northern Gibson, IN 1991 Riverside BWV 3 16 Western Big Valley, Mills, TX 2005 San Felipe BWV 6 20 Western Del Rio, Val Verde, TX 2003 VC1-68 CSP 1 15 Western Phoenix, Maricopa, AZ 1995 * One-year-old seedlings from open-pollinated seeds were planted. Table 1.
The geographical origin of the 12 pecan seedstocks and seed source in the USDA-ARS National Clonal Germplasm Repository (NCGR) for pecans and hickories.
-
Source Nparm DF L-R ChiSquare Prob > ChiSq Without considering seedstocks Frozen/Non-Frozen 1 1 144.1823 < 0.0001** Stratified/Non-Stratified 1 1 11.5772 0.0007** Frozen/Non-Frozen*Stratified/Non-Stratified 1 1 38.7198 < 0.0001** With considering seedstocks Frozen/Non-Frozen 1 1 91.1617 < 0.0001** Stratified/Non-Stratified 1 1 0.0000 0.9964 Frozen/Non-Frozen*Stratified/Non-Stratified 1 1 0.0000 0.9961 Seedstock 11 11 92.2452 < 0.0001** Seedstock*Frozen/Non-Frozen 11 11 40.7617 < 0.0001** Seedstock*Stratified/Non-Stratified 11 11 30.0626 0.0015** Seedstock*Frozen/Non-Frozen*Stratified/Non-Stratified 11 11 20.1627 0.0432* Nparm: The number of parameters associated with this effect; DF: The degree of freedom for the effect test; L-R ChiSquare is the likelihood ratio chi-square test statistic for the hypothesis that the corresponding regression parameter is zero, given the other terms in the model. Prob > ChiSq: The probability of obtaining a greater chi-square value if the specified model fits no better than the model that includes only an intercept. * Indicates significance at p < 0.05 and ** at p < 0.01. Table 2.
The treatment effect tests on the seed germination rates.
-
Treatment Days to emergence Height growth rate (mm/day) Diameter growth rate (mm/day) Mean Std dev Std error Mean Std dev Std error Mean Std dev Std error Frozen/Non-stratified 32.455 b 7.321 0.7179 0.396 0.184 b 0.0136 0.035 c 0.008 0.0006 Frozen/Stratified 18.028 c 6.012 1.0641 0.418 0.130 b 0.0205 0.039 b 0.007 0.0009 Non-frozen/Stratified 17.802 c 6.196 0.6232 0.530 0.158 a 0.0118 0.043 a 0.007 0.0005 Non-frozen/Non-stratified 36.911 a 12.827 0.6505 0.438 0.182 b 0.0123 0.037 b 0.007 0.0005 F Ratio 192.691 21.346 39.200 Prob > F < 0.0001** < 0.0001** < 0.0001** Values within the column followed by different letters are significantly different at p < 0.01 using the Tukey-Kramer HSD test. Table 3.
The influence of seed treatments on days to emergence and seedling growth in the first season.
-
Seedstock Frozen/
Non-StratifiedFrozen/
StratifiedNon-frozen/
Non-stratifiedNon-frozen/
StratifiedAverage 87MX1-2.2 75 40 85 75 68.75 87MX5-1.7 60 70 75 85 72.50 Elliott 40 0 70 85 48.75 Frutoso 55 10 85 80 57.50 Giles 70 25 80 90 66.25 Major 20 10 80 85 48.75 Moore 80 75 90 90 83.75 Peruque 95 10 100 100 76.25 Posey 85 60 95 90 82.50 Riverside 80 0 100 90 67.50 San Felipe 90 25 80 100 73.75 VC1-68 30 20 30 70 37.50 Average 65 28.75 80.83 86.67 Data showed the percentage obtained by dividing the number of germinated seeds by the total number of seeds (20) in each treatment. Table 4.
Seed germination rate (%) of 12 seedstocks under different treatments.
-
Seedstock Days to emergence Height growth rate (mm/day) Diameter growth rate (mm/day) Mean Std dev Std error Mean Std dev Std error Mean Std dev Std error 87MX1-2.2 24.764 ab 8.658 1.666 0.483 bcd 0.126 0.020 0.037 bc 0.006 0.001 87MX5-1.7 23.526 b 9.659 1.637 0.520 abc 0.116 0.020 0.037 bc 0.005 0.001 Elliott 26.872 ab 9.606 1.979 0.474 bcd 0.145 0.024 0.037 bc 0.006 0.001 Frutoso 28.556 ab 10.400 1.842 0.587 a 0.168 0.022 0.039 bc 0.007 0.001 Giles 28.528 ab 19.122 1.697 0.414 de 0.213 0.020 0.037 bc 0.010 0.001 Major 29.910 ab 14.766 2.004 0.397 de 0.213 0.024 0.041 abc 0.009 0.001 Moore 26.881 ab 11.073 1.510 0.508 abc 0.163 0.018 0.040 bc 0.007 0.001 Peruque 26.629 ab 10.131 1.582 0.225 f 0.100 0.019 0.031 c 0.009 0.001 Posey 31.000 a 15.114 1.510 0.359 e 0.129 0.018 0.040 bc 0.008 0.001 Riverside 27.964 ab 9.303 1.666 0.460 cd 0.149 0.020 0.041 abc 0.006 0.001 San Felipe 27.895 ab 15.239 1.637 0.557 ab 0.108 0.020 0.042 ab 0.005 0.001 VC1-68 24.167 ab 7.905 2.256 0.567 ab 0.110 0.027 0.045 a 0.006 0.001 F Ratio 1.7144 26.042 10.815 Prob > F 0.0665 < 0.0001* < 0.0001* Values within the column followed by different letters are significantly different at p < 0.01 using the Tukey-Kramer HSD test. Table 5.
Days to emergence of different treated seed and seedling growth of different pecan rootstocks in the first season.
Figures
(3)
Tables
(5)