-
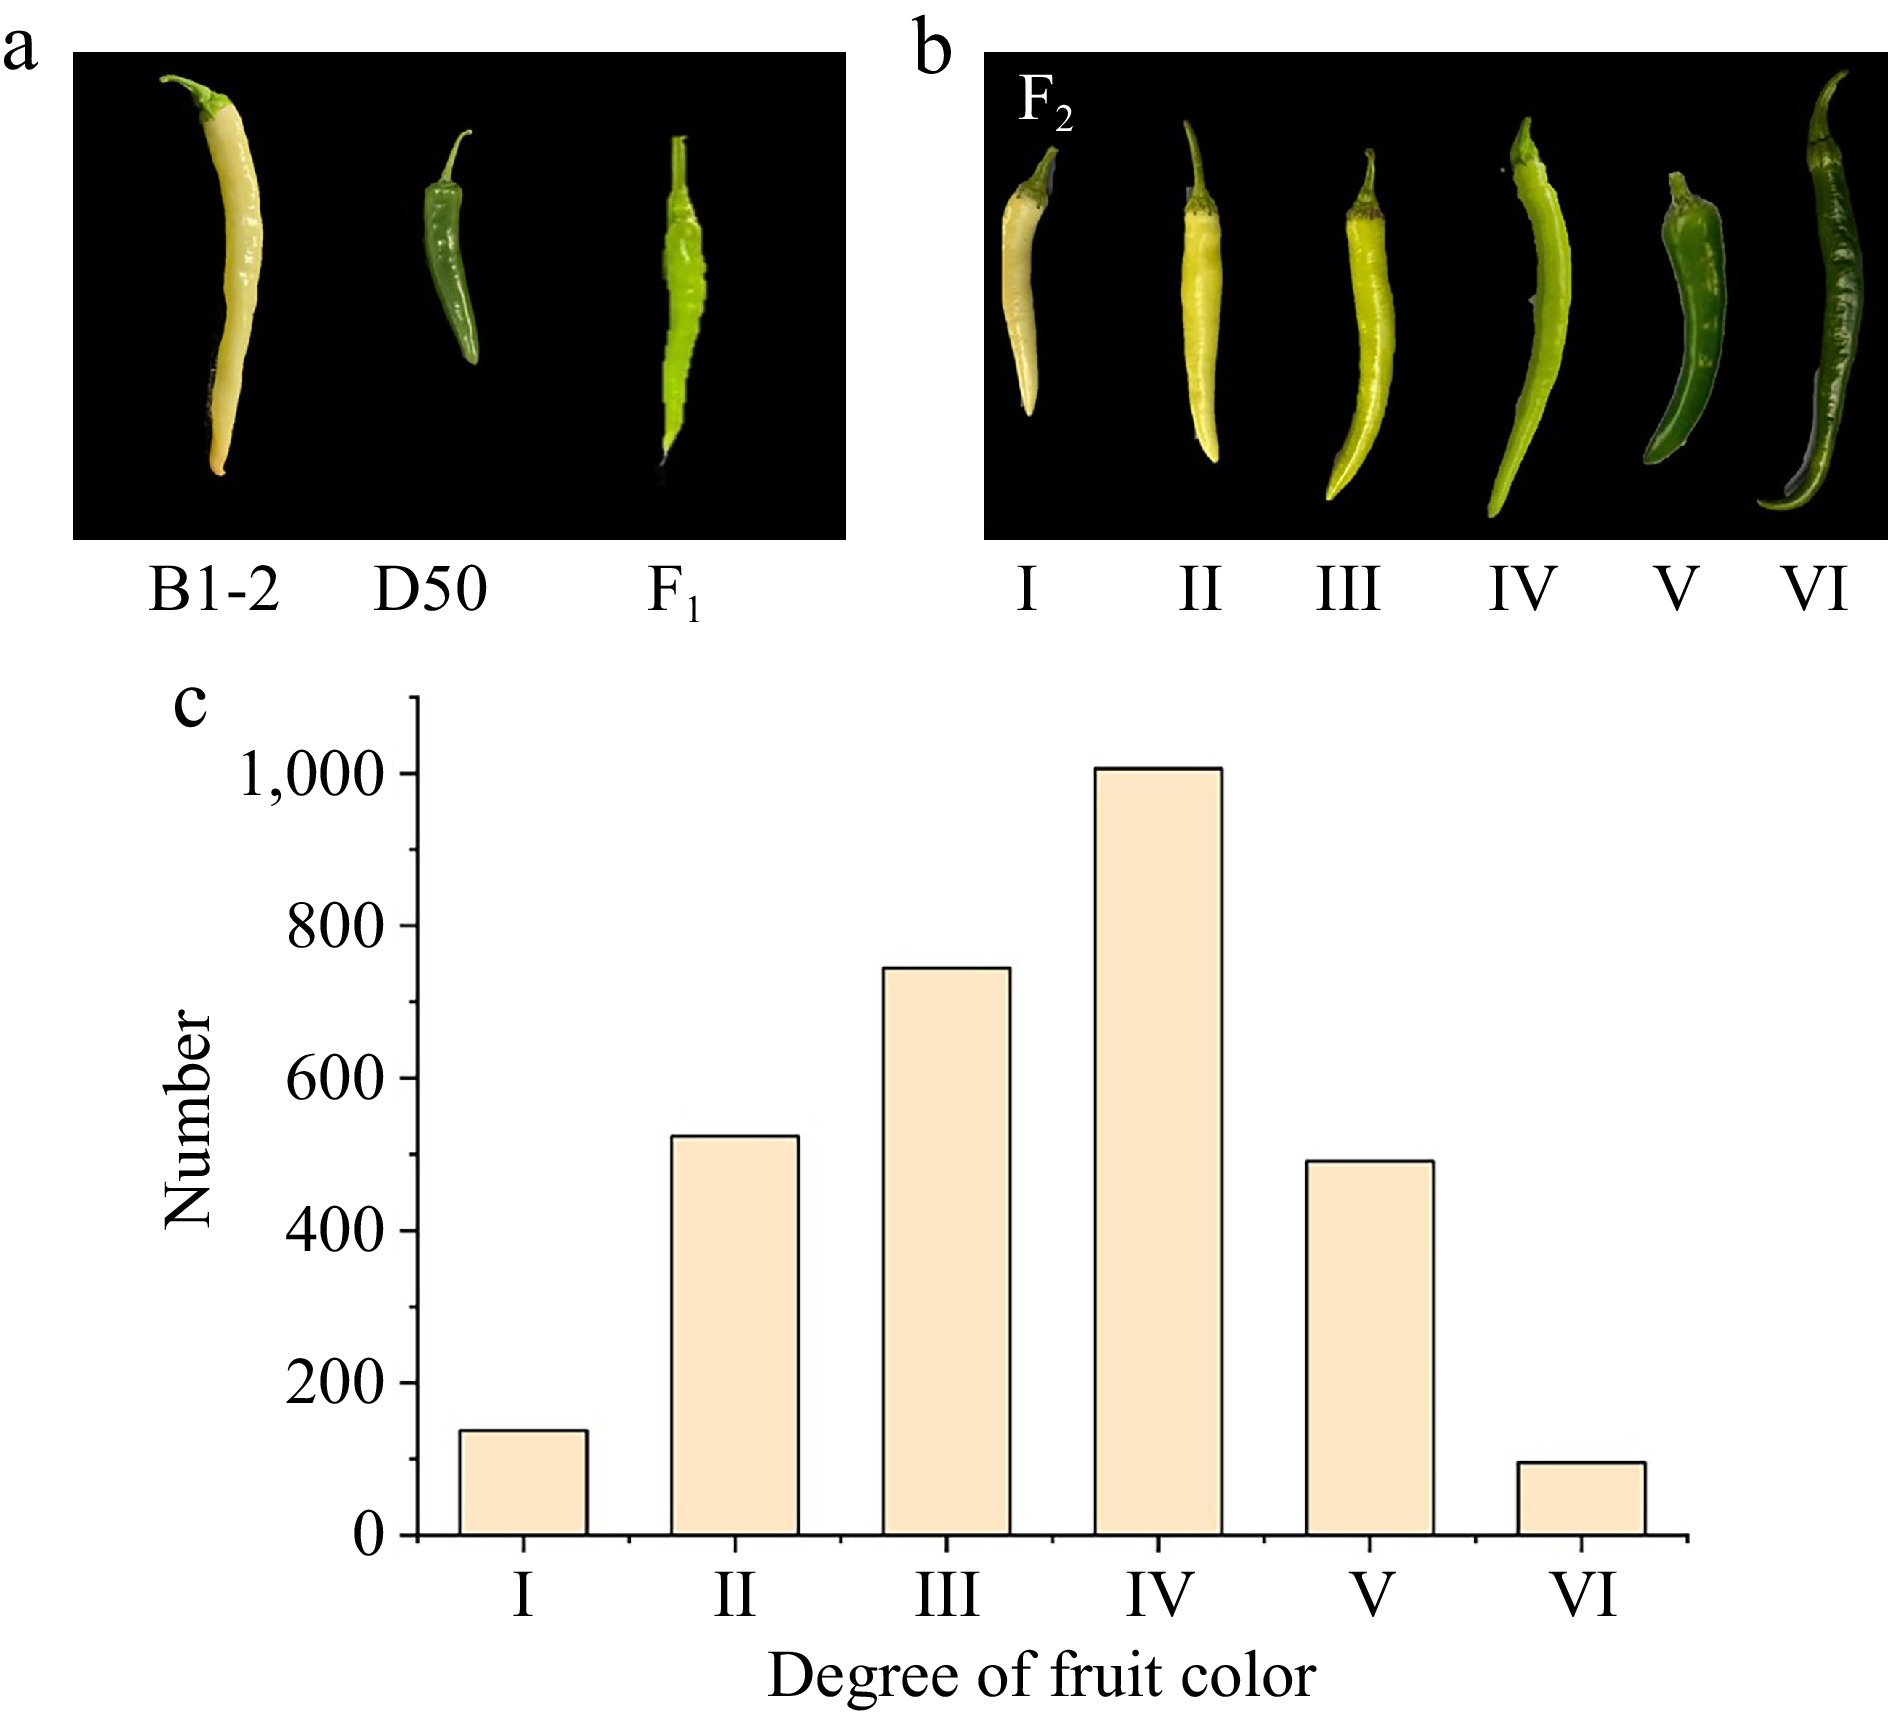
Figure 1.
Color variation of immature fruits in the F2 population. (a) The fruit performance of two parental lines and F1 population. (b) The classification of fruit color in F2 population. (c) Frequency distribution for fruit color showing phenotypic variation in F2 population.
-
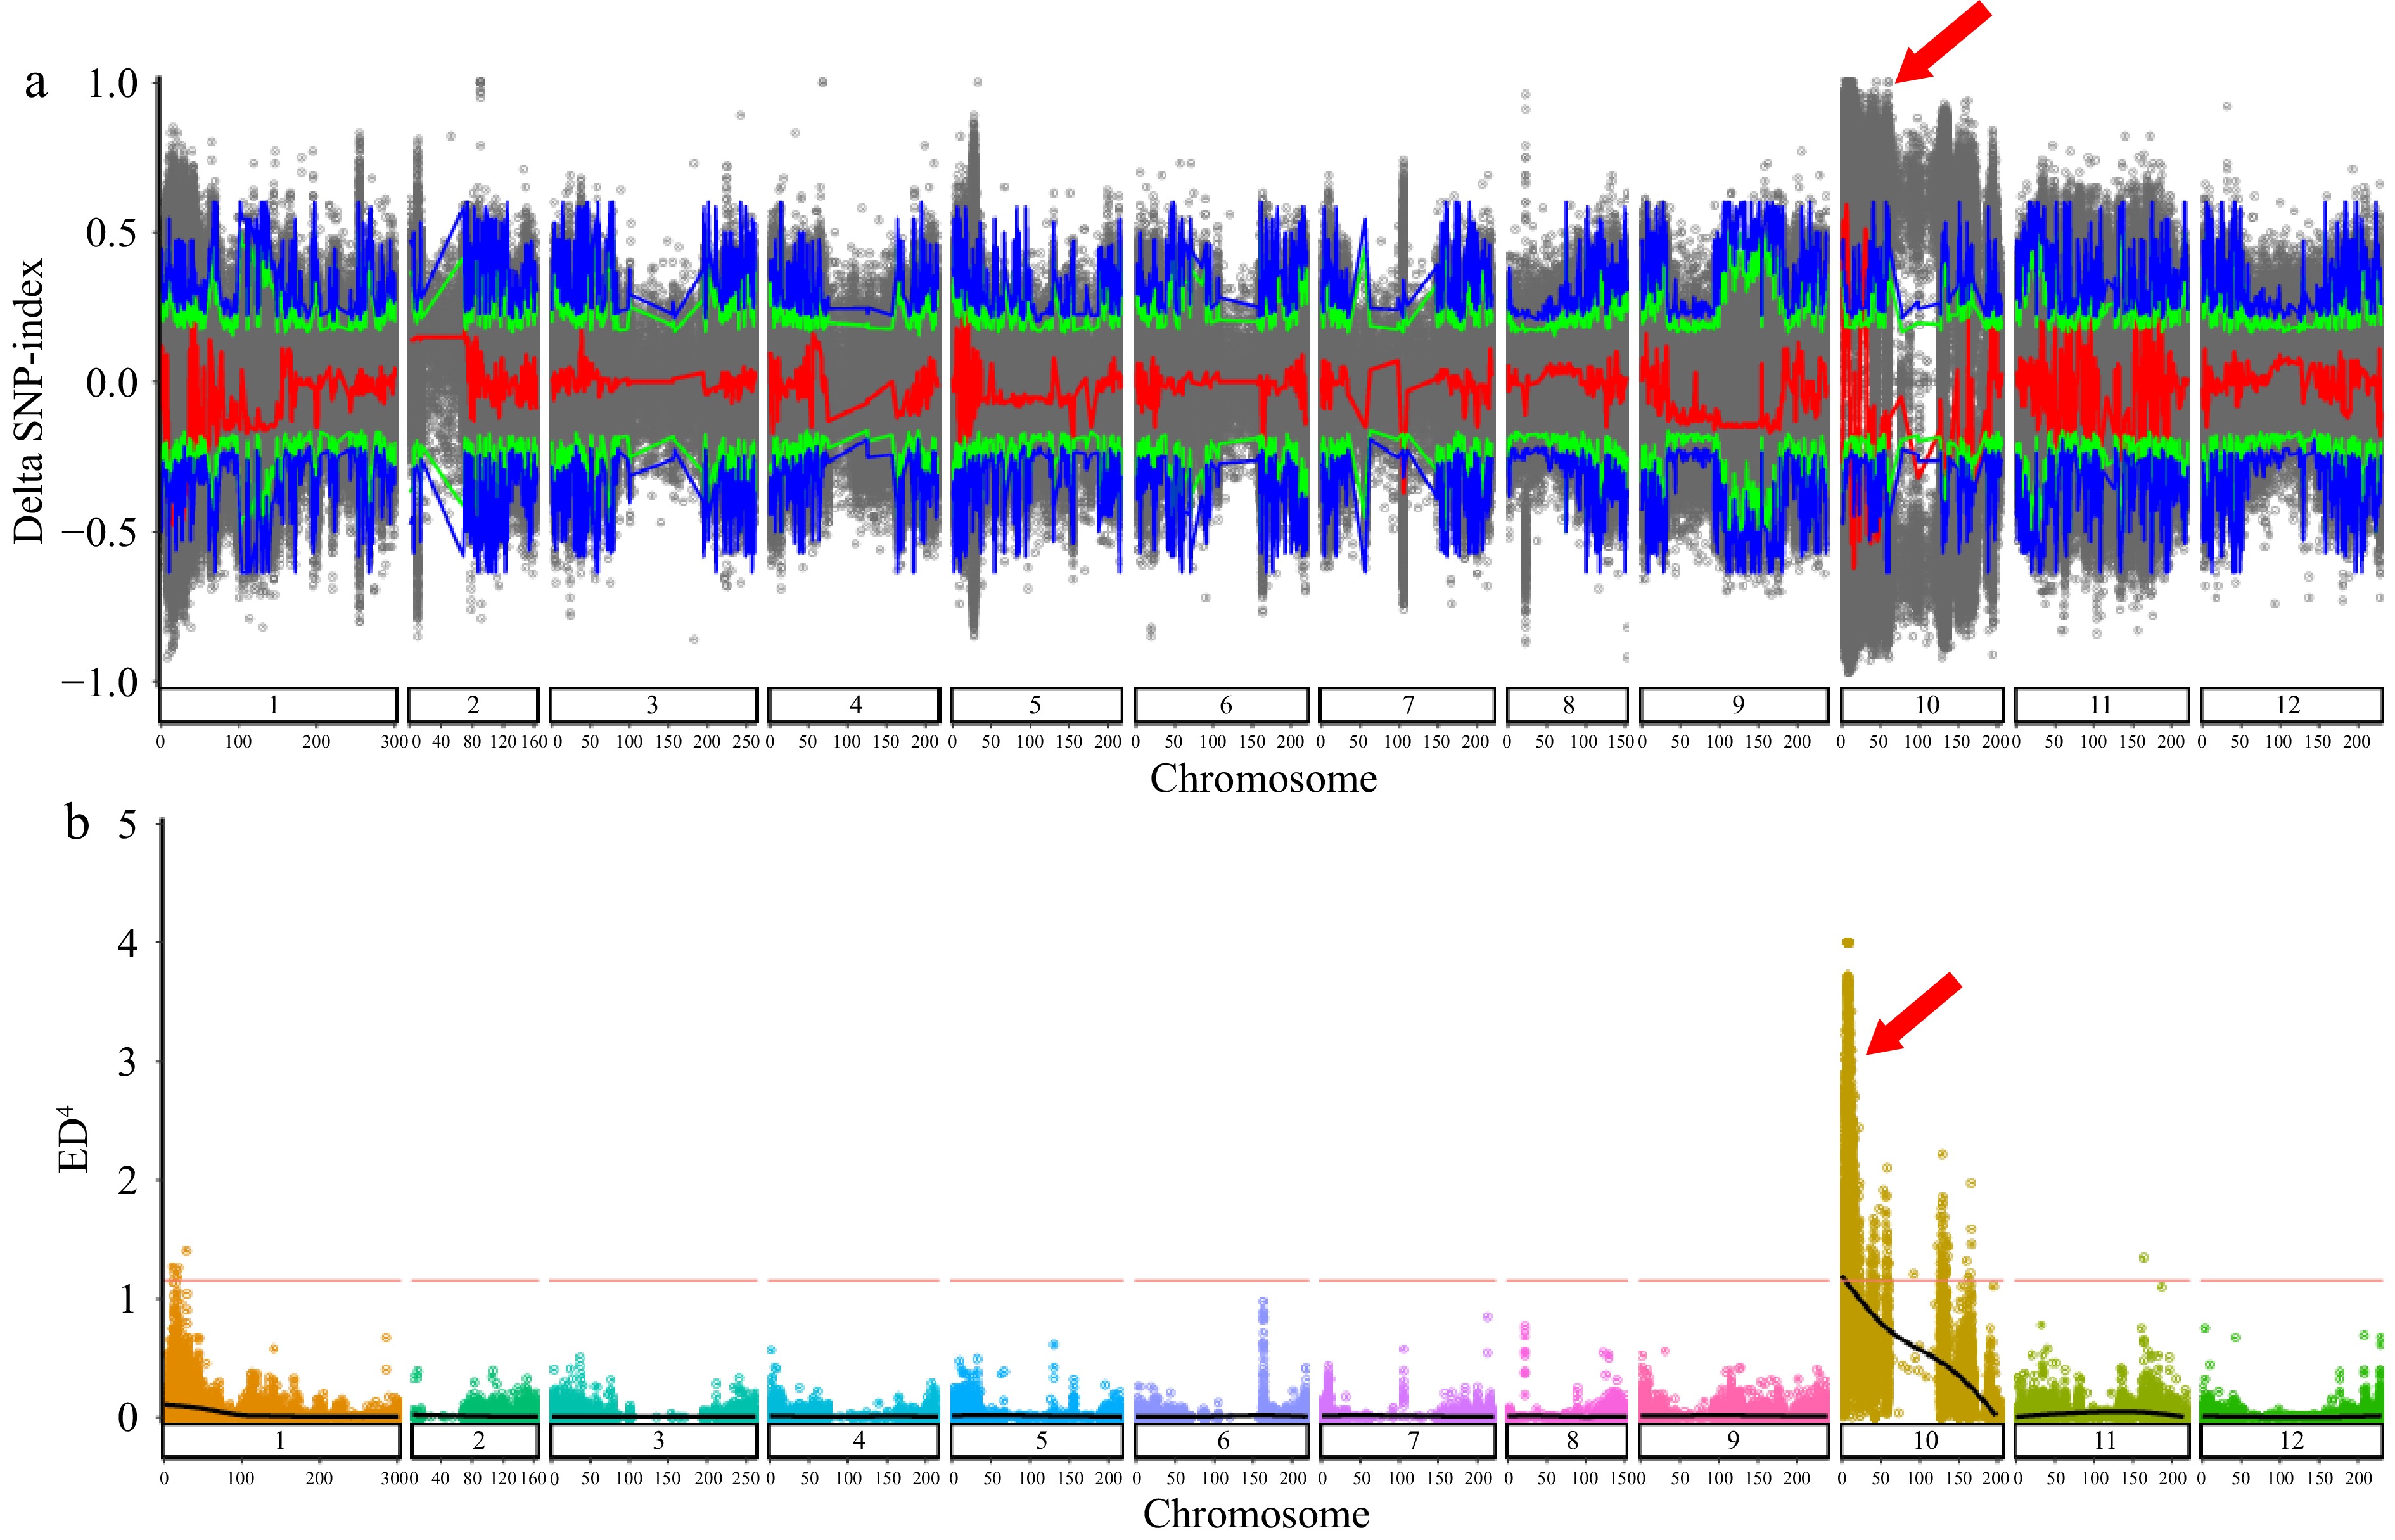
Figure 2.
Distribution of ΔSNP-index and ED4 values on 12 chromosomes. (a) Distribution of ΔSNP-index on chromosomes of EW-pool and EG-pool. x-axis: the length of chromosomes; y-axis: the value of ΔSNP-index; blue and green lines: 95% and 99% confidence intervals, respectively; gray dot: ΔSNP-index; red: the results of sliding window analysis. (b) Distribution of ED4 values on 12 chromosomes. X-axis: the position of the chromosome; Y-axis: the value of ED4. Red lines: 99% confidence intervals.
-
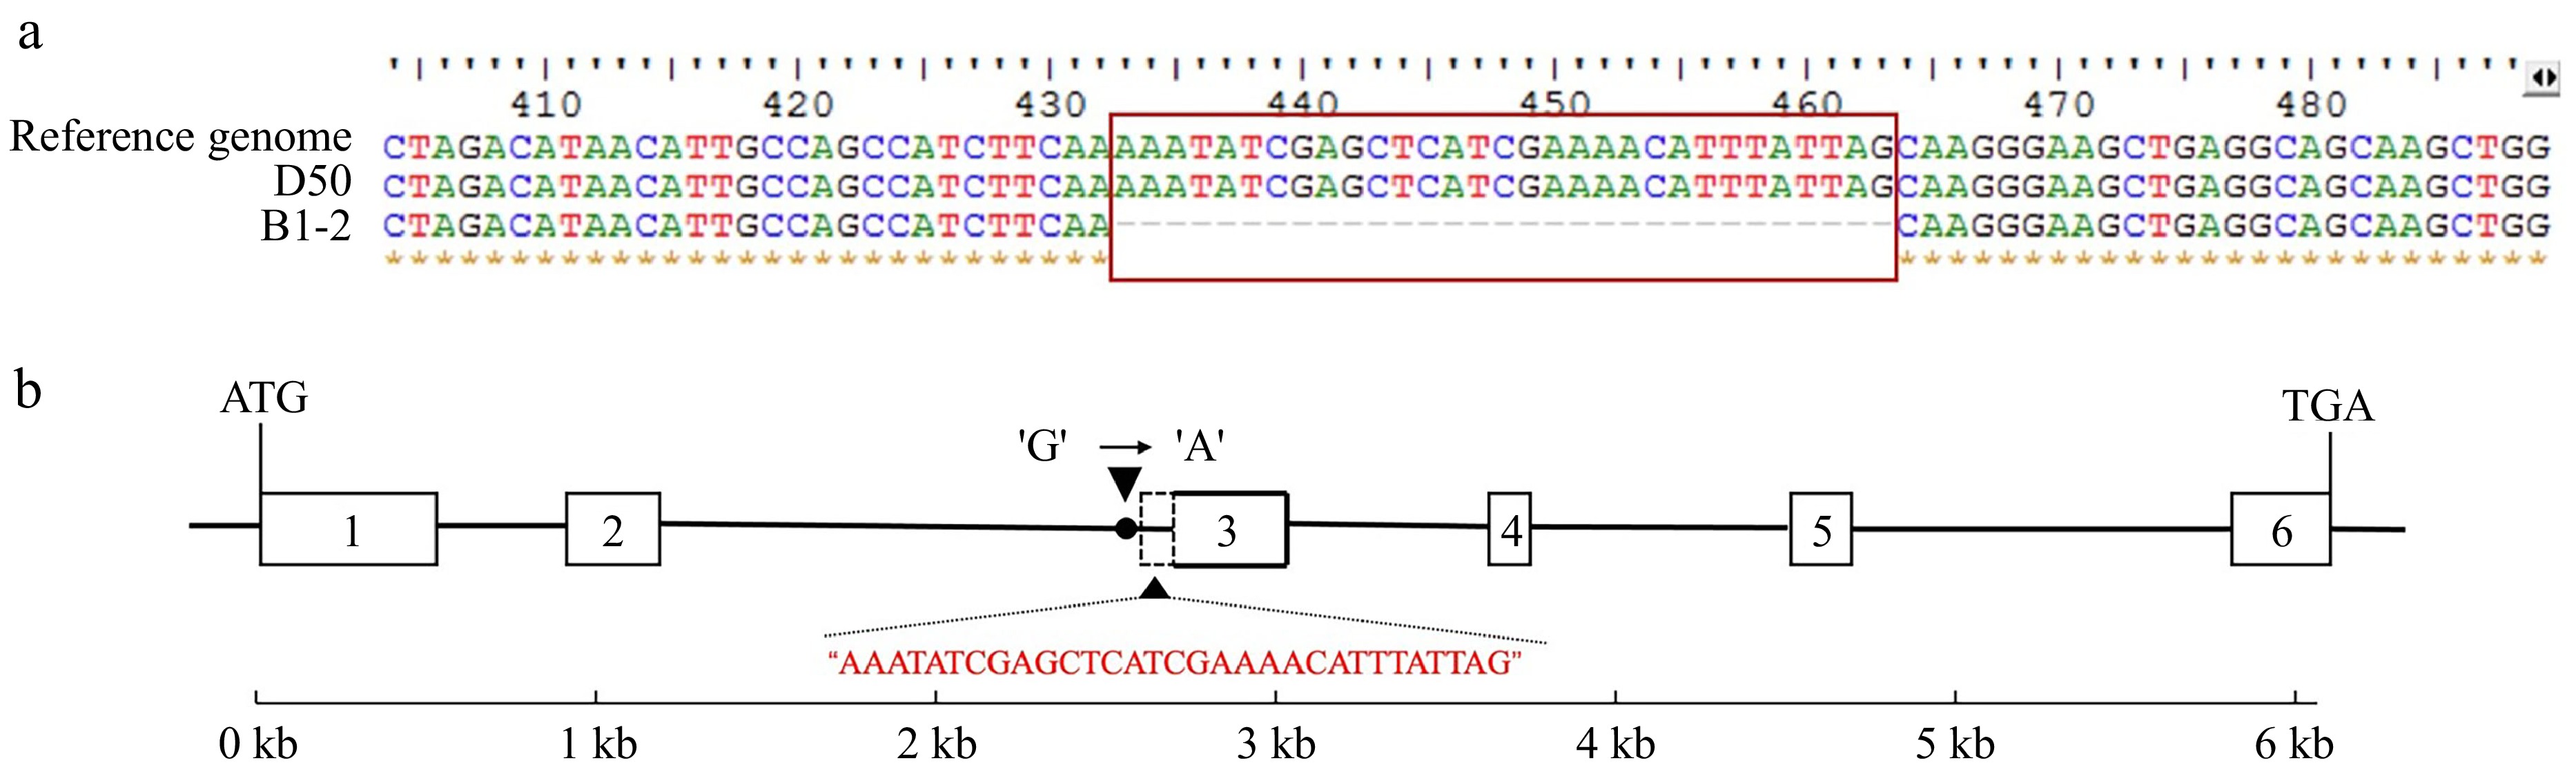
Figure 3.
Variation of CaGLK gene (cDNA sequence and DNA sequence in B1-2). (a) Multiple sequence alignment analysis of CaGLK cDNA sequence among reference genome, D50 and B1-2. (b) Structure and variation sites of CaGLK gene in the DNA sequence. The grid represents the exon, the black line represents the intron, and the red base is the deletion part.
-
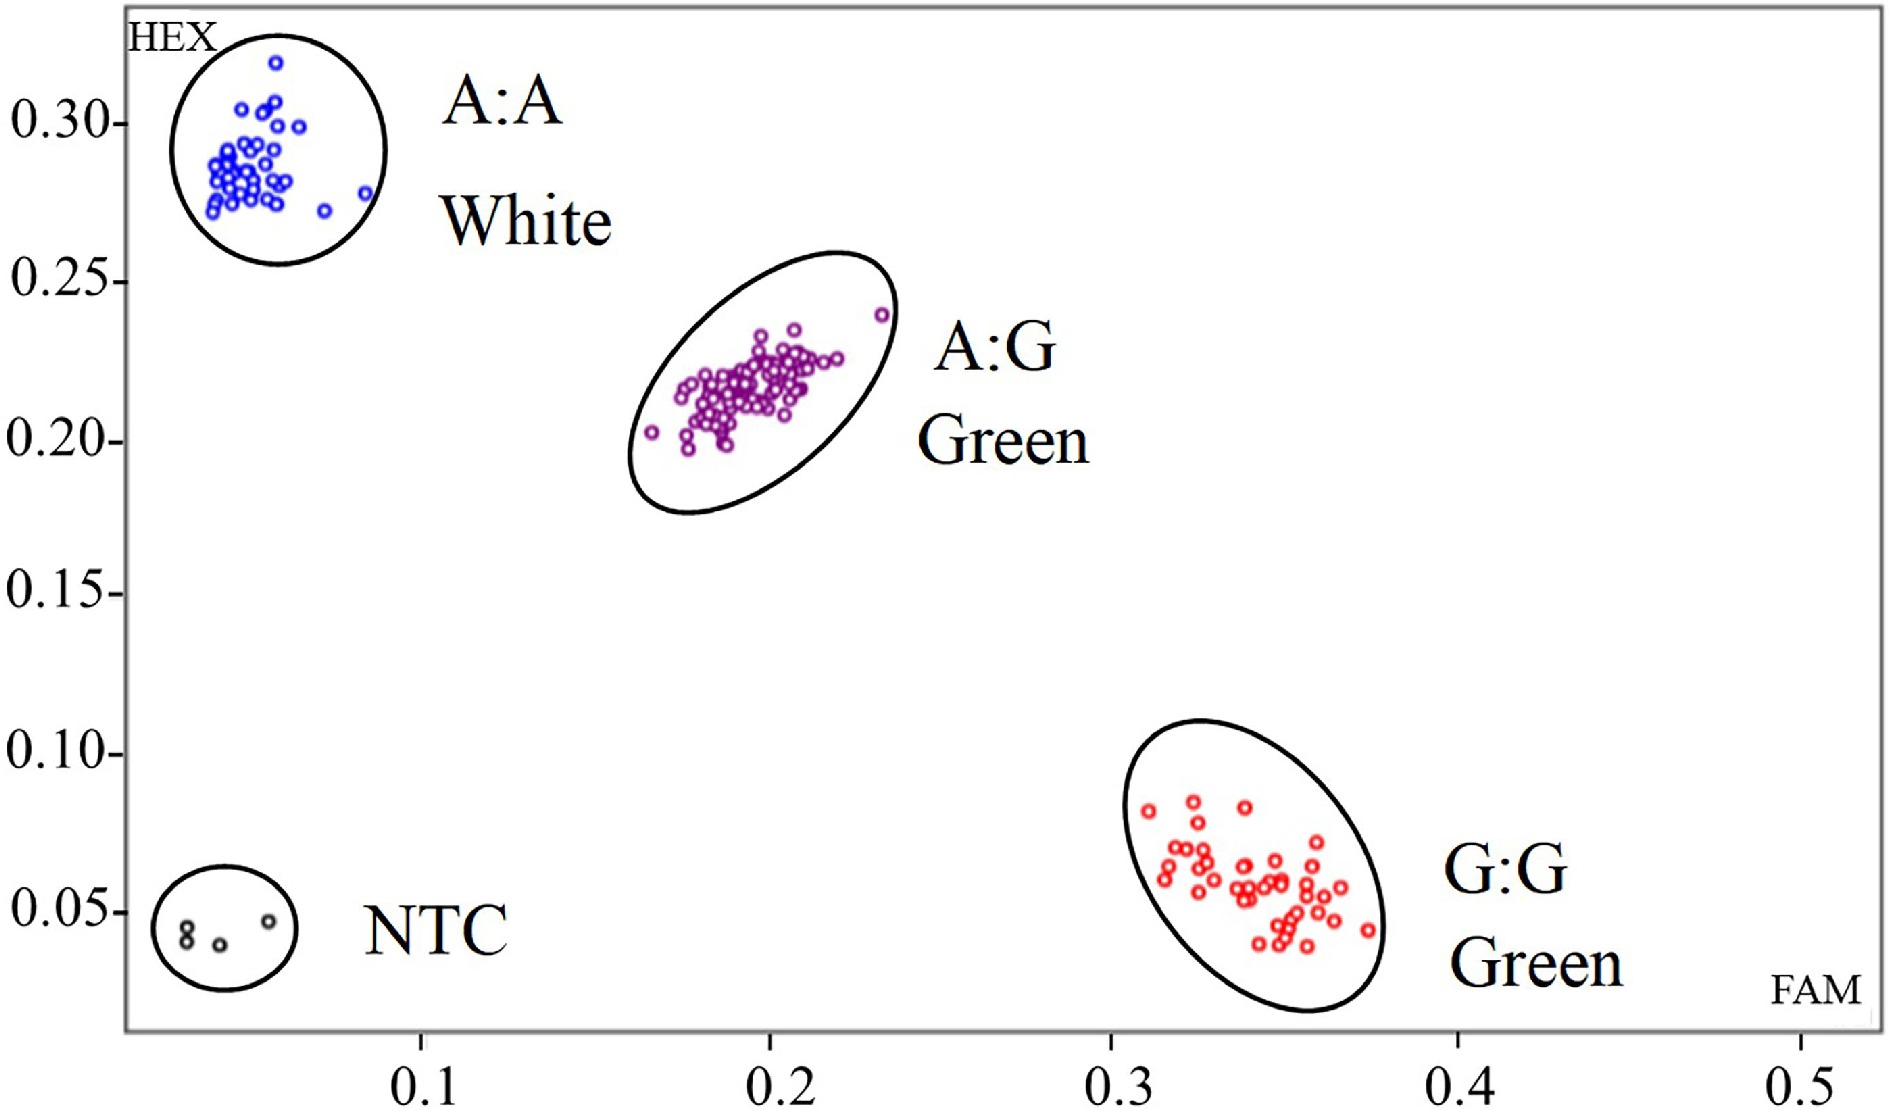
Figure 4.
KASP genotyping of GLKA/G variant associated with white color fruit for the F2 population. Randomly selected 184 F2 individual plants were classified into three genotypes. Each dot represents a certain genotype. Blue dots represent CaGLKA genotype, which produce white fruit; red dots represent CaGLKG genotype, which produce green fruit; and purple dots represent heterozygous genotype. Black dots represent non template control (NTC).
-
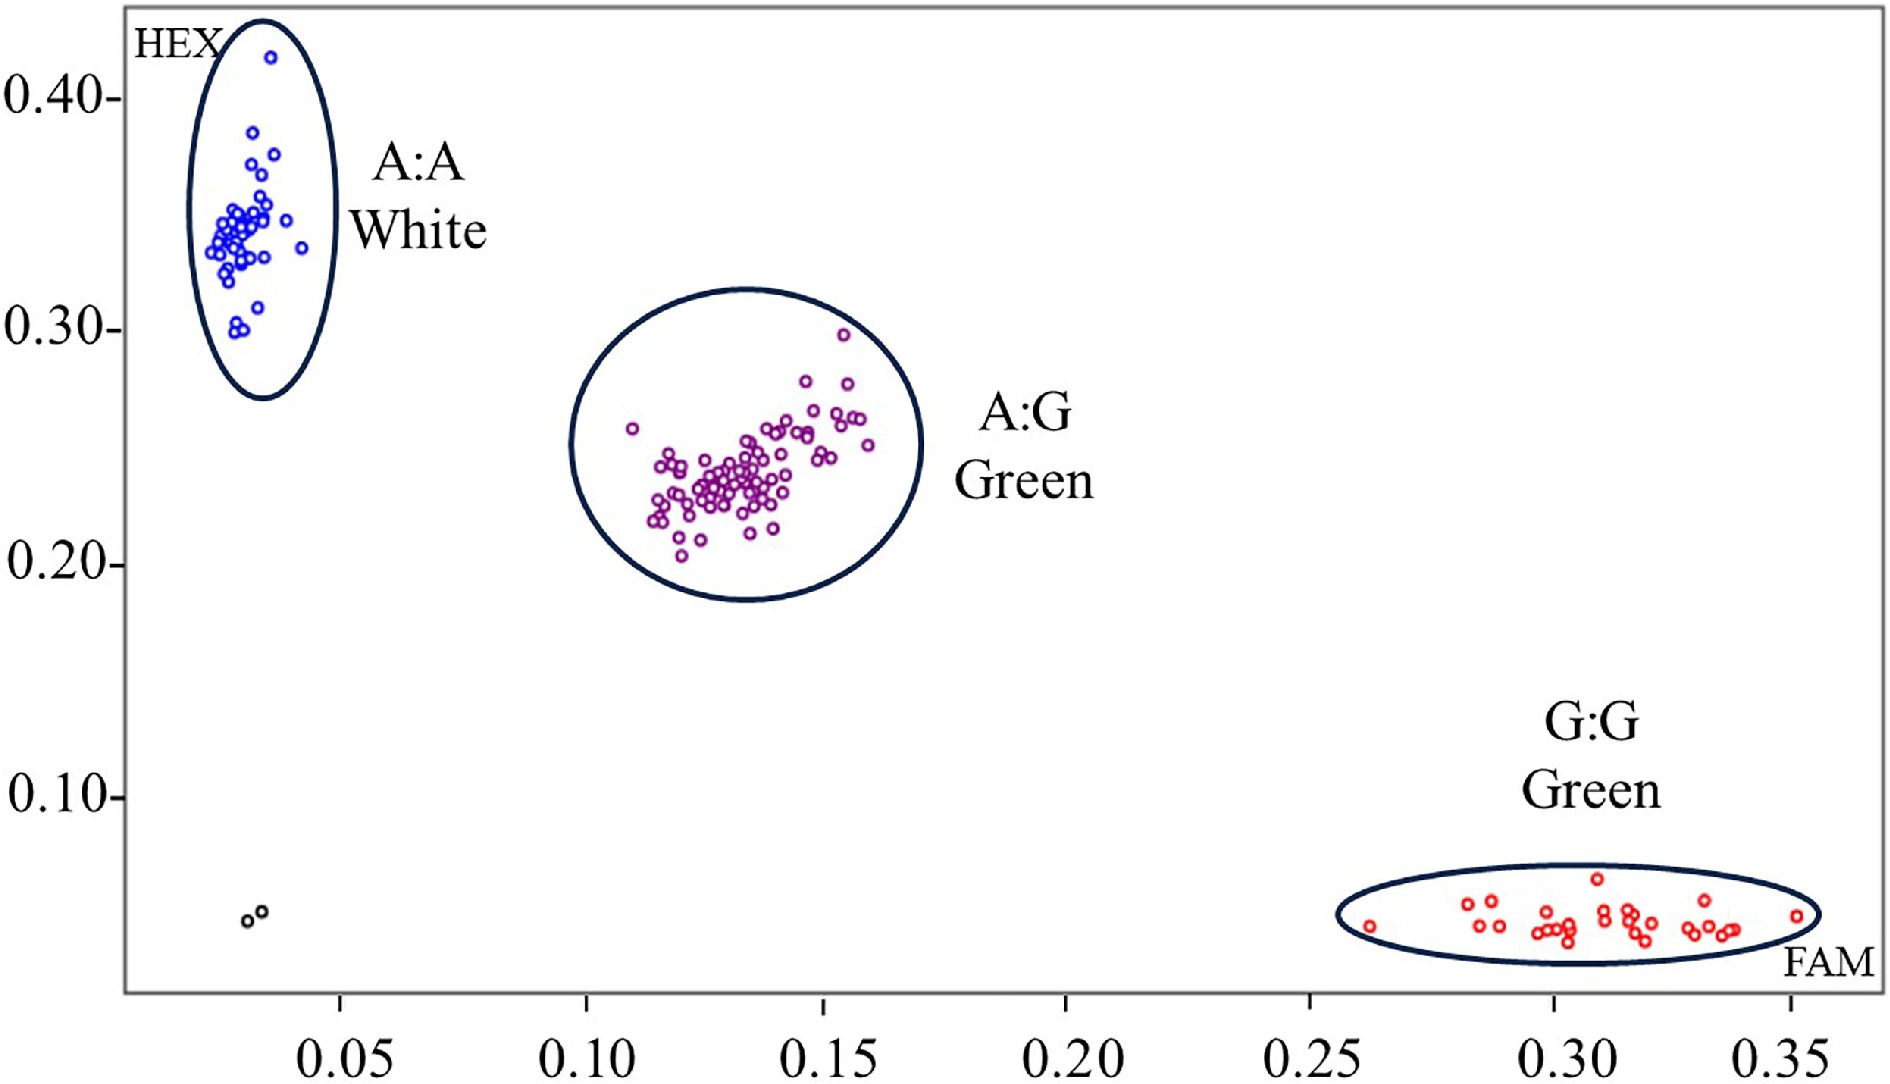
Figure 5.
KASP genotyping of GLKA/G variant associated with white color fruit for pepper germplasm accessions. Each dot represents a certain genotype. Homozygous genotypes are marked with blue (CaGLKA) and red (CaGLKG) dots, respectively, and heterozygous genotypes are marked with purple dots. Black dots indicates no template control (NTC). A natural population, comprising 113 germplasm accessions were tested.
-
Chromosome name SNP number Chromosome name SNP number Chr01 1,063,601 Chr07 308,508 Chr02 308,087 Chr08 270,086 Chr03 472,929 Chr09 955,711 Chr04 249,986 Chr10 447,555 Chr05 279,766 Chr11 631,473 Chr06 417,558 Chr12 414,592 Total 5,826,852 Table 1.
The distribution of high-quality SNPs on 12 chromosomes.
Figures
(5)
Tables
(1)