-
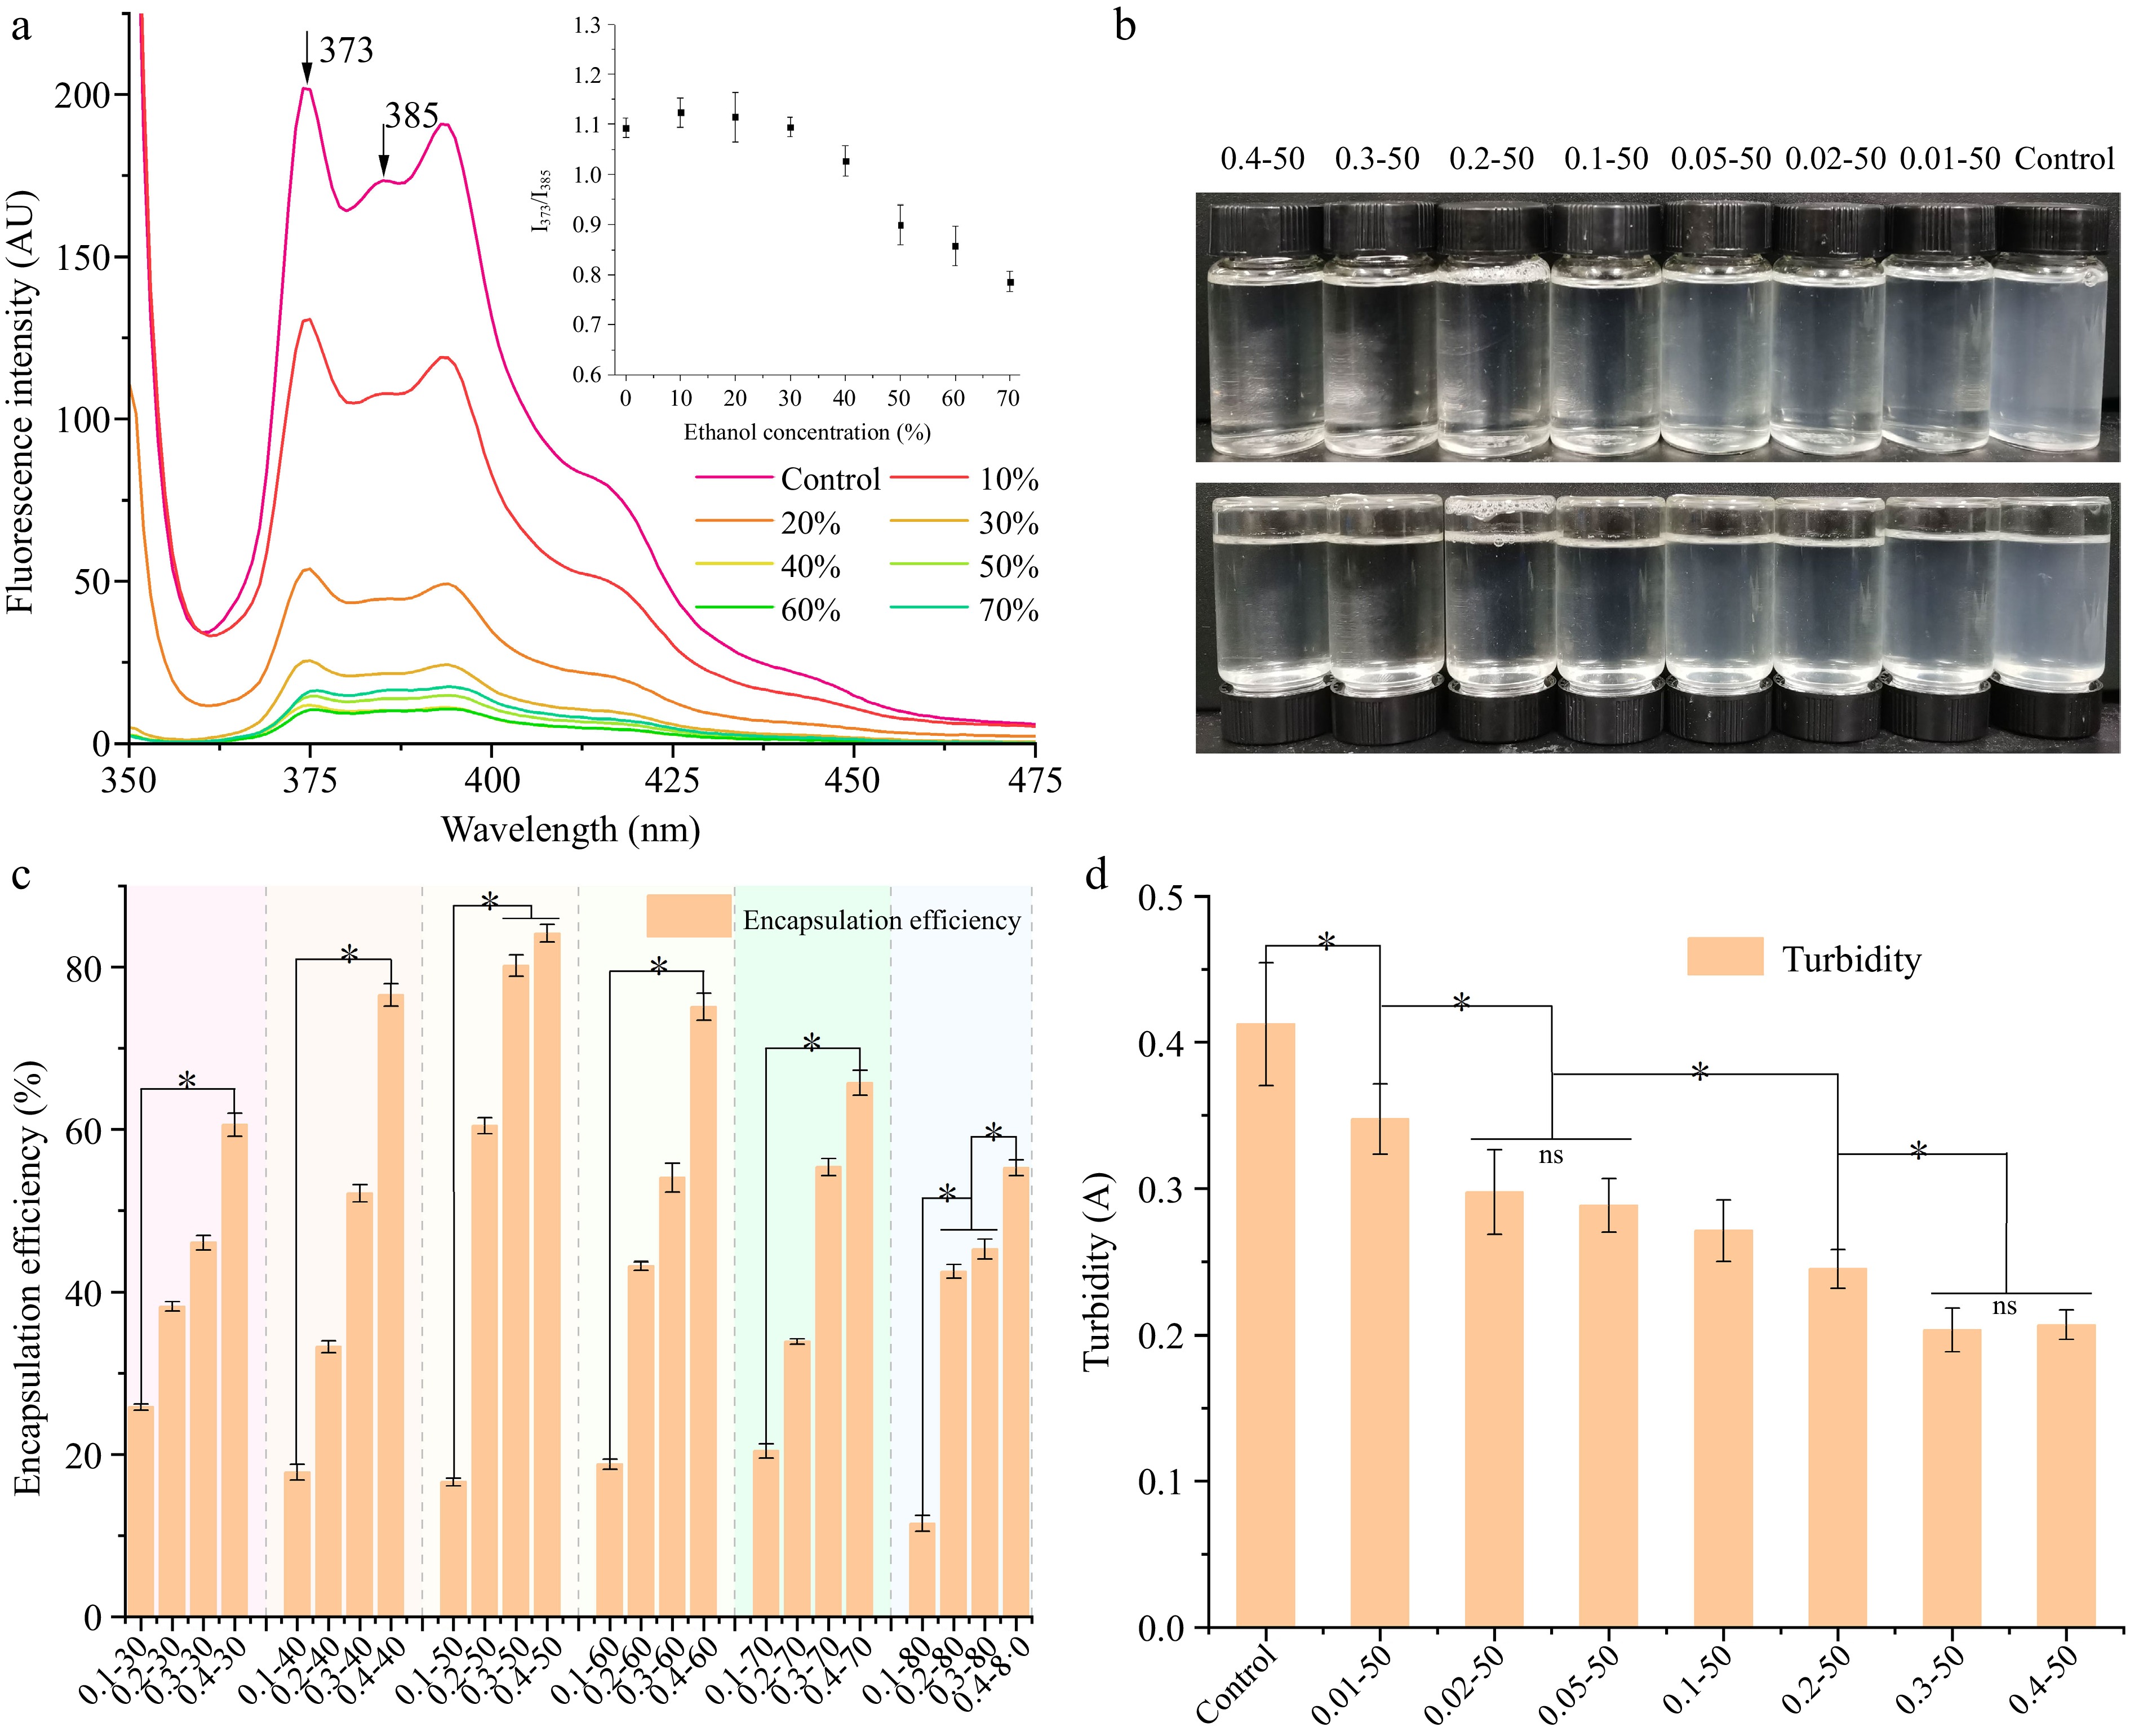
Figure 1.
(a) Pyrene fluorescence, and the interpolation shows the ratio of I373/I385 of EWP with adding different proportion of ethanol. The (b) appearance features, (c) encapsulation efficiency, and (d) turbidity of ethanol-induced EWP with adding different proportion of RES. 0.01−50, the preceding digits are RES concentrations (mg/mL), and the following numbers are ethanol concentrations (v/v), other groups are similar. * Indicates significant difference (p < 0.05).
-
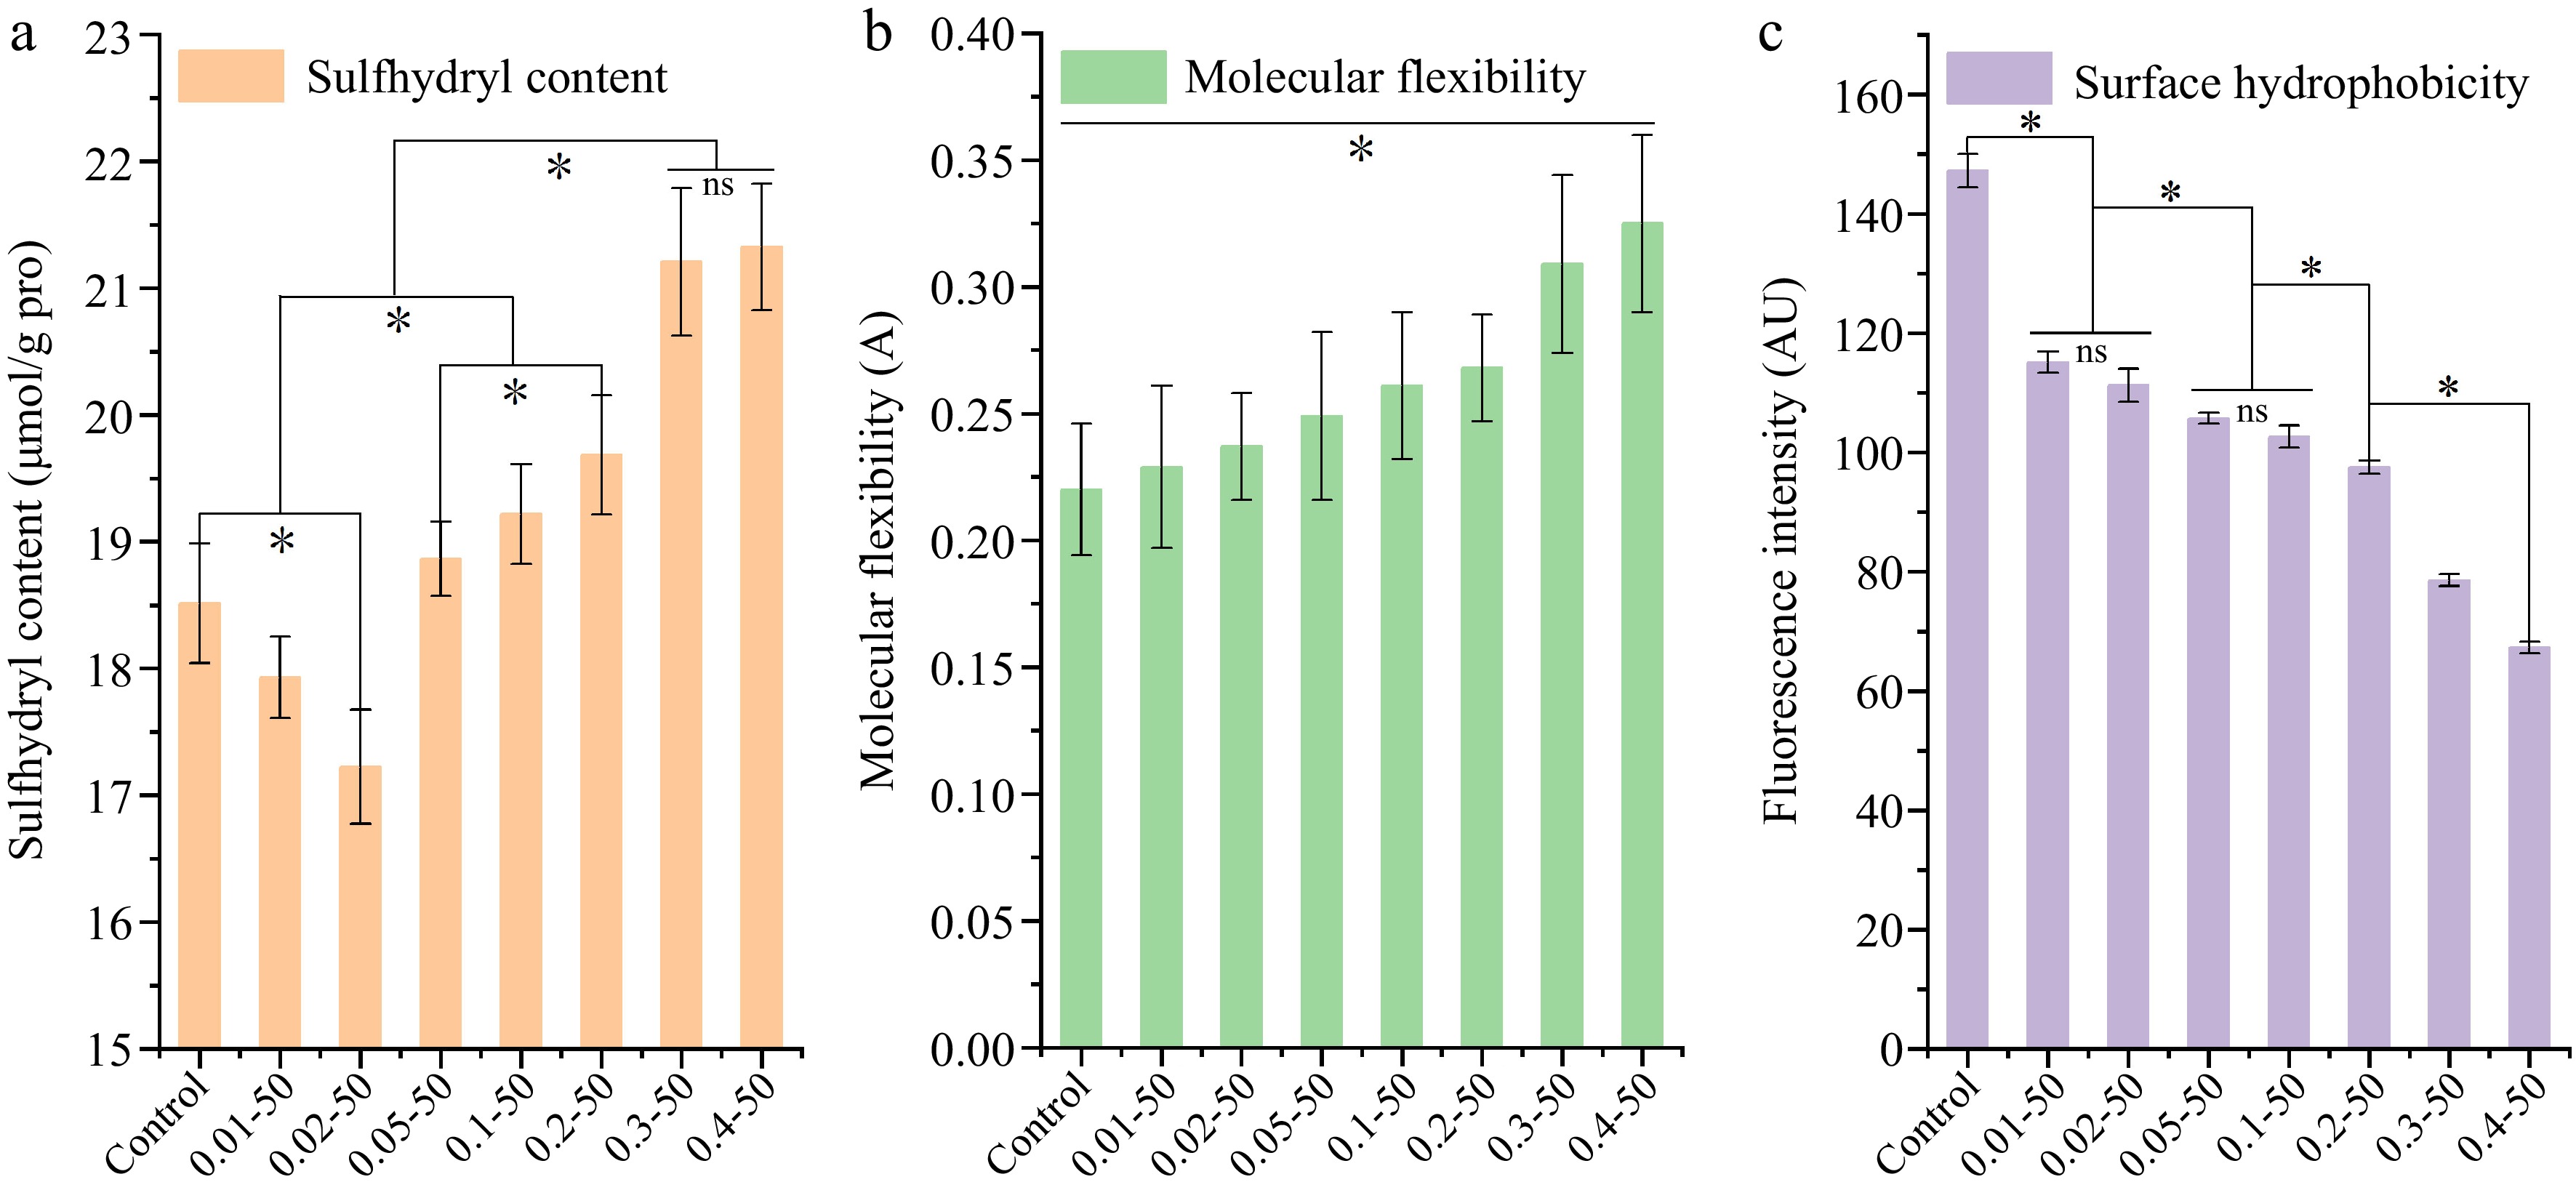
Figure 2.
The (a) sulfhydryl content, (b) molecular flexibility, and (c) surface hydrophobicity of ethanol-induced EWP with adding different proportion of RES. 0.01-50, the preceding digits are RES concentrations (mg/mL), and the following numbers are ethanol concentrations (v/v), other groups are similar. * Indicates significant difference (p < 0.05).
-
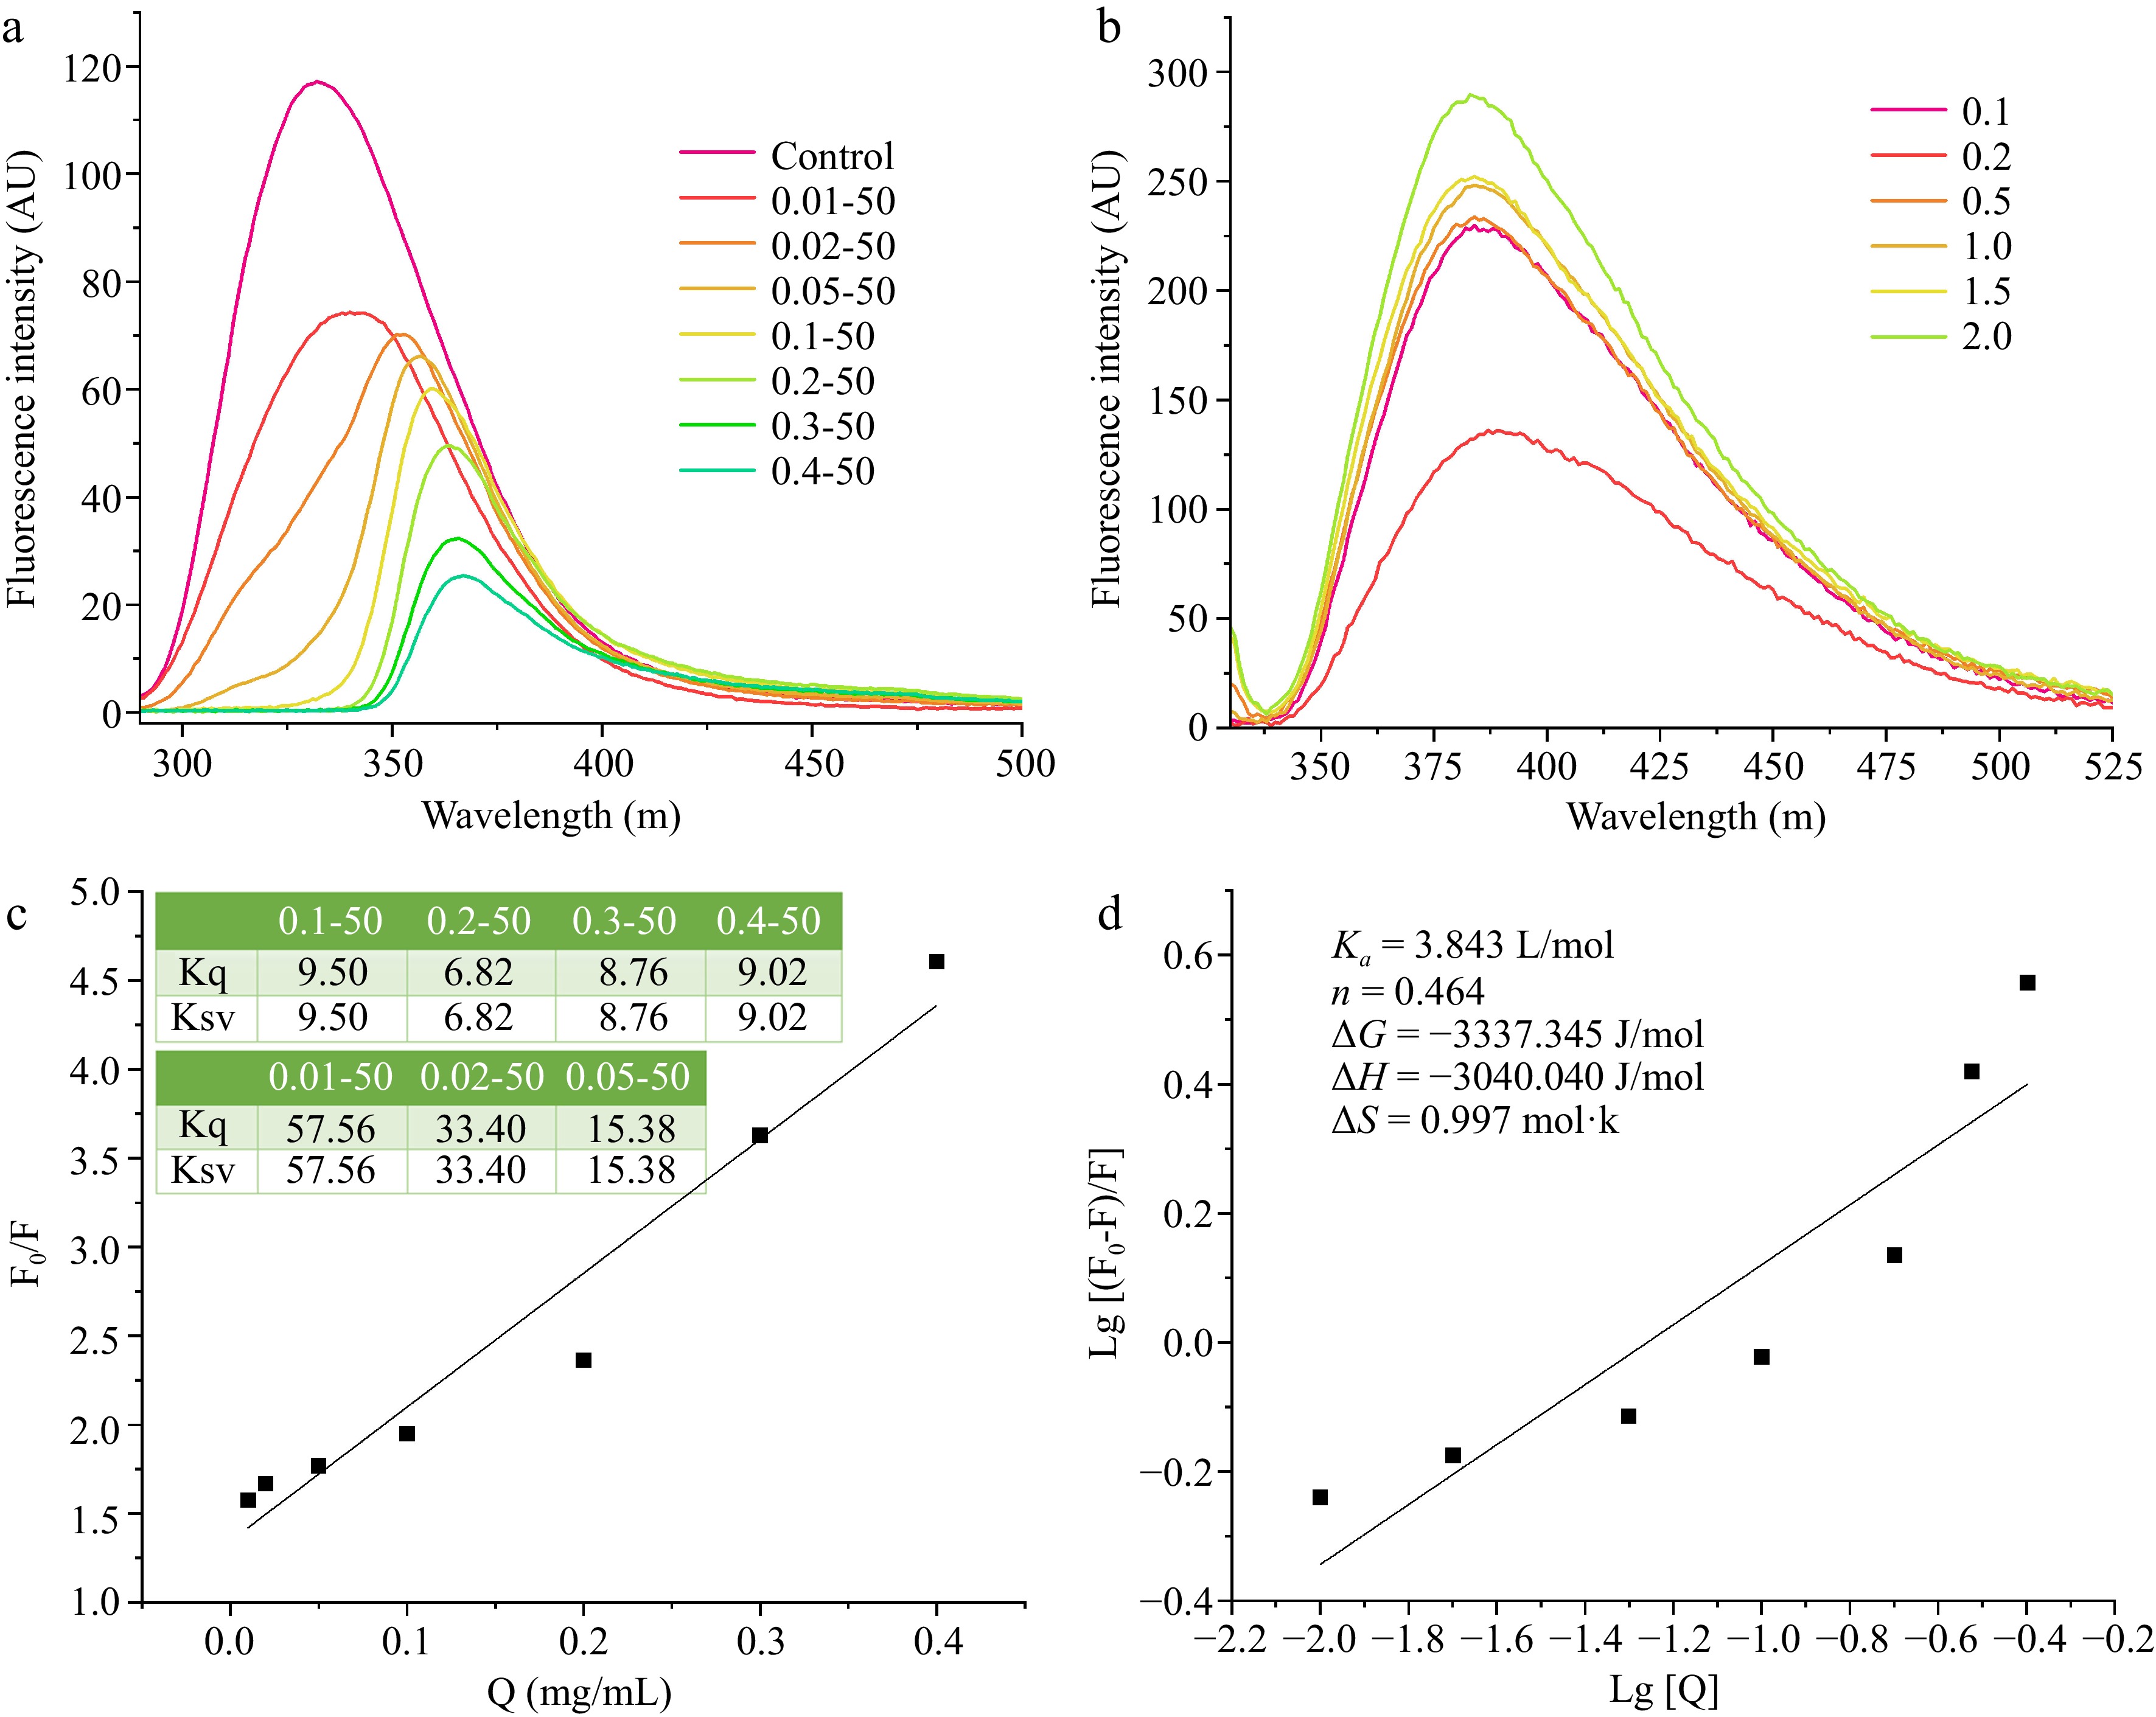
Figure 3.
The intrinsic fluorescence of EWP with adding different ratios of (a) RES, and different ratios of (b) EWP. (c) The Stern-Volmer curved line of the interaction of ethanol-induced EWP with adding different proportions of RES, and (d) the double logarithmic regression curve. 0.01−50, the preceding digits are RES concentrations (mg/mL), and the following numbers are ethanol concentrations (v/v), other groups are similar. 0.1−2.0 (b) is the concentration of EWP (mg/mL).
-

Figure 4.
The (a) XRD spectra, (b) fitted patterns, (c) crystallinity, (d) TEM images, and (e) AFM images and nano height map of ethanol-induced EWP with adding different proportion of RES. The TEM magnifications for control group are 500 and 200 nm, and the for other two groups are 200 and 100 nm. The AFM magnification is 600 nm. Values are given as means ± standard deviation (n = 3). 0.01−50, the preceding digits are RES concentrations (mg/mL), and the following numbers are ethanol concentrations (v/v), other groups are similar. Different letters indicate significant differences between groups (p < 0.05).
-
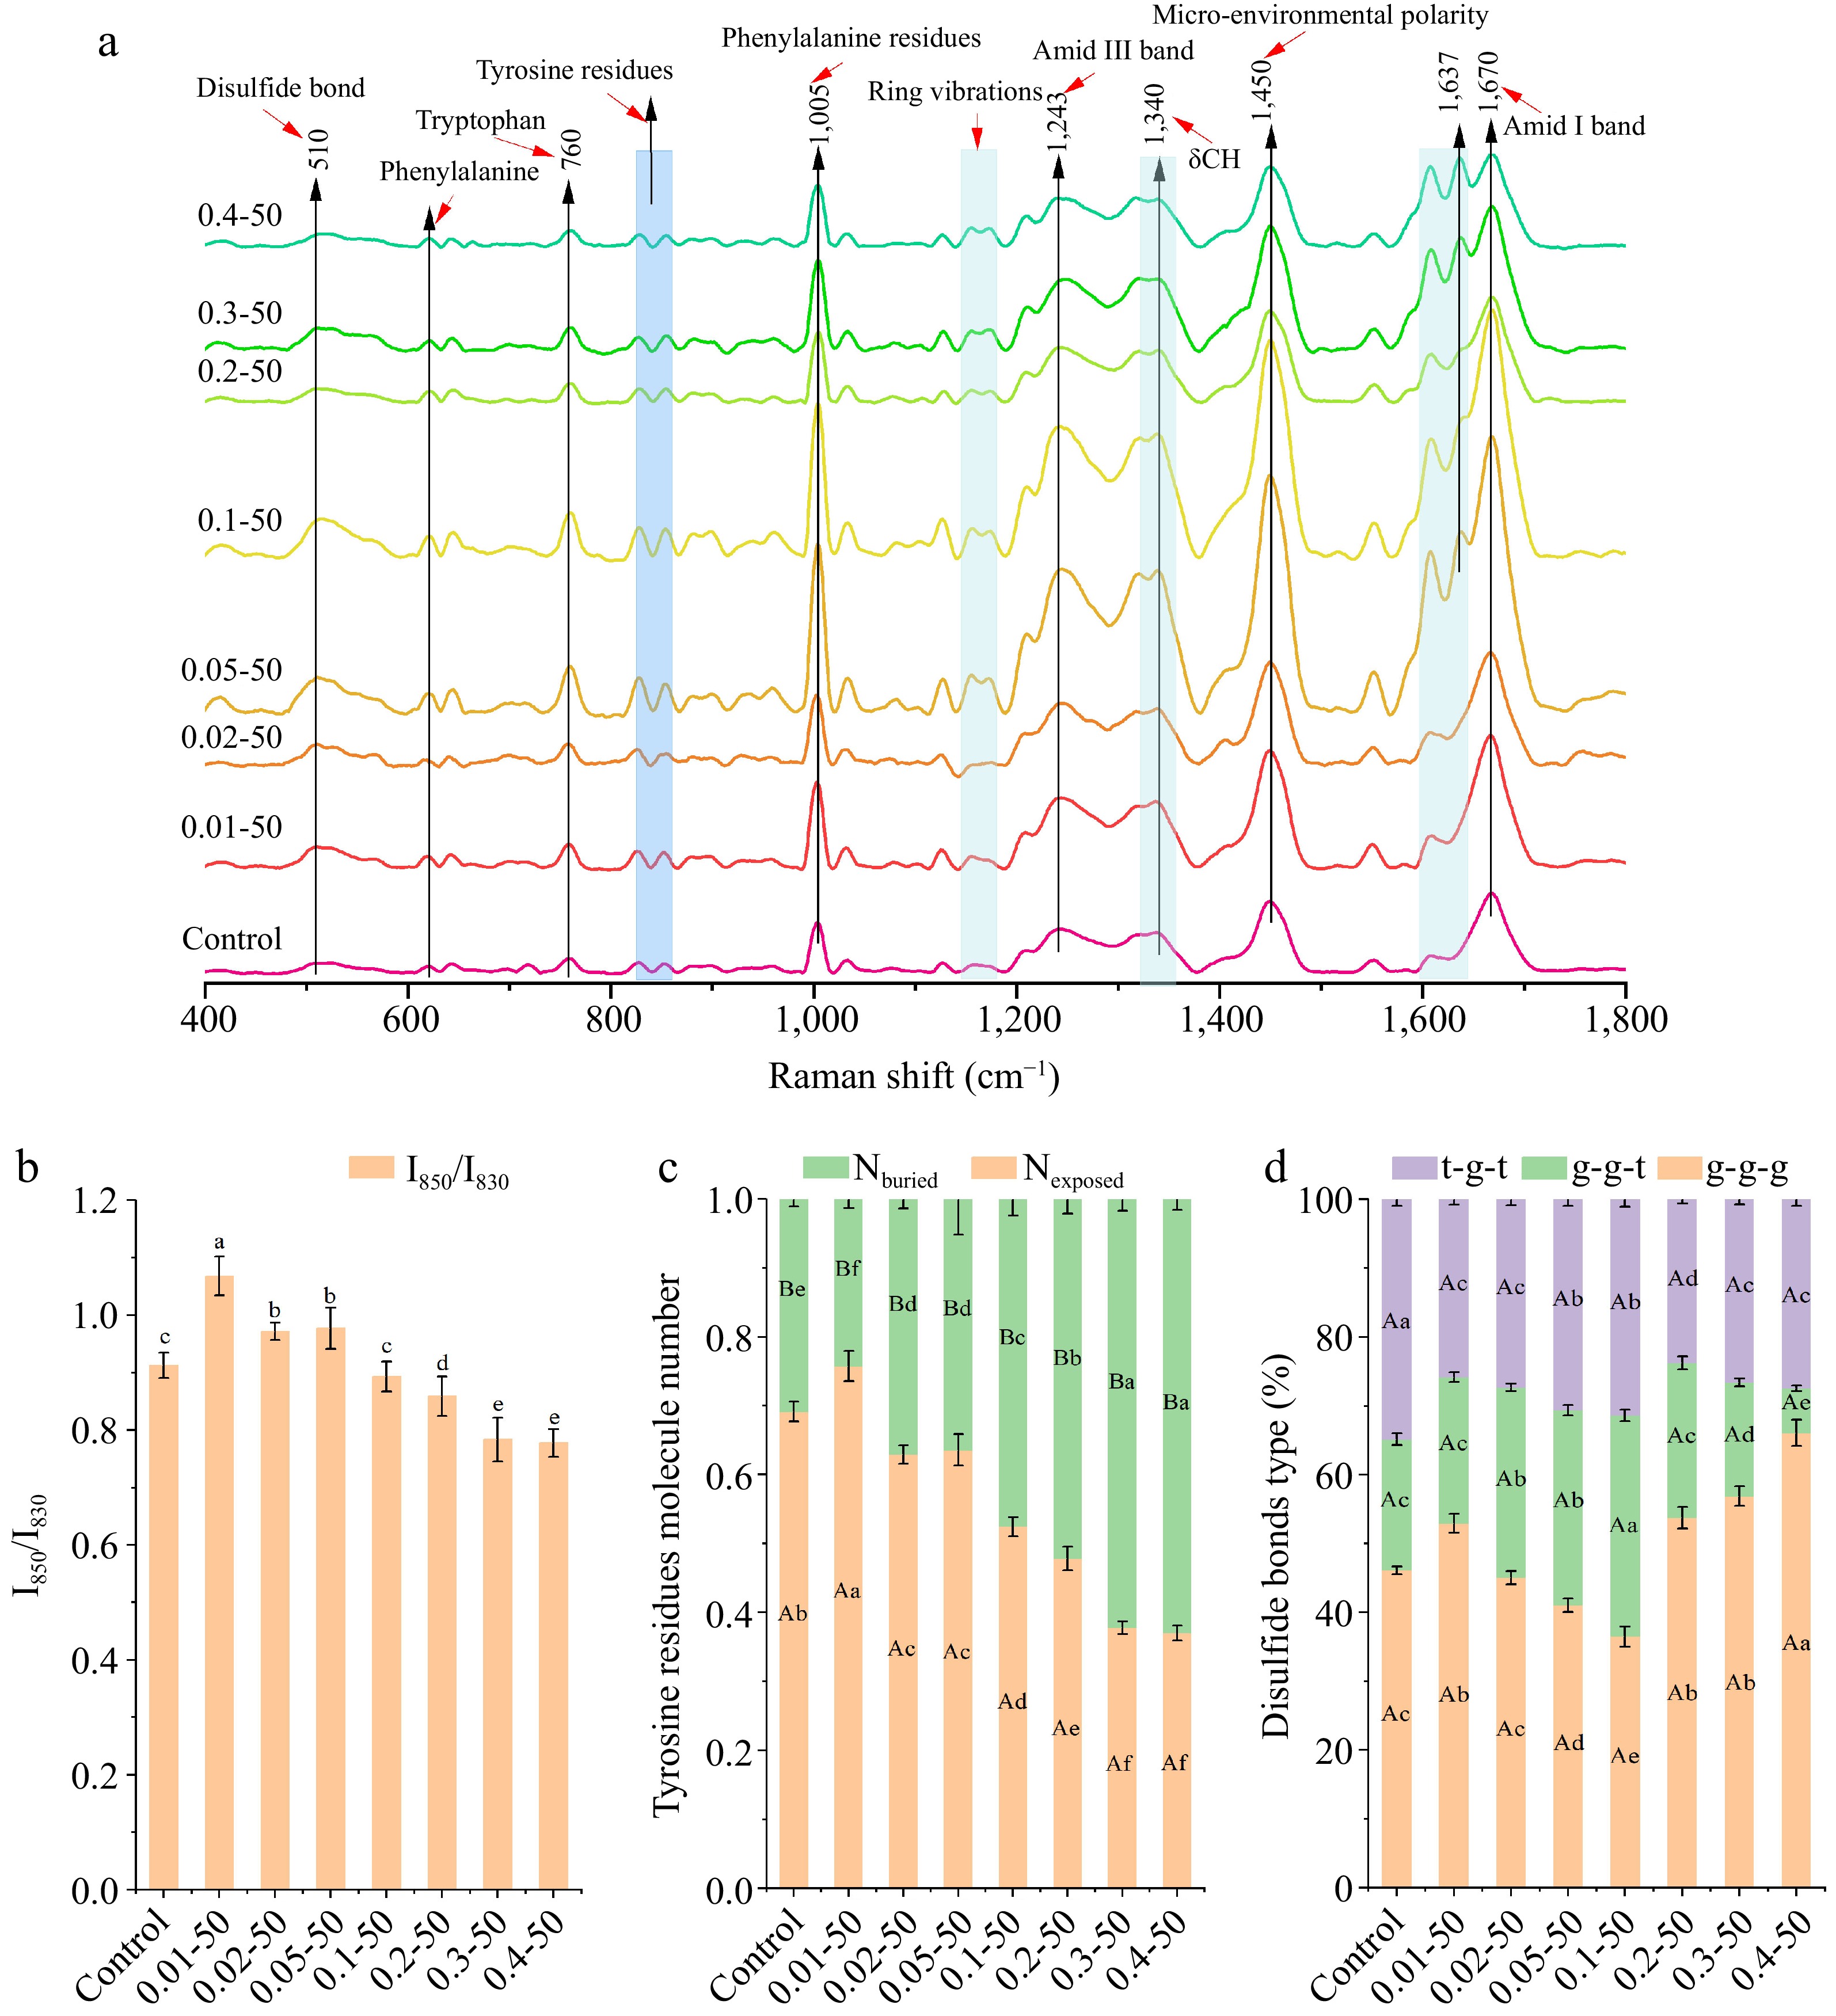
Figure 5.
The (a) Raman shift (400−1,800 cm−1), (b) Tyrosine Fermi resonance line ratio (I850/I830), (c) proportion of exposed and buried tyrosine residues, and (d) different disulfide bond mode ratios of ethanol-induced EWP with adding different proportion of RES. 0.01−50, the preceding digits are RES concentrations (mg/mL), and the following numbers are ethanol concentrations (v/v), other groups are similar. Different letters indicate significant differences between groups (p < 0.05).
-
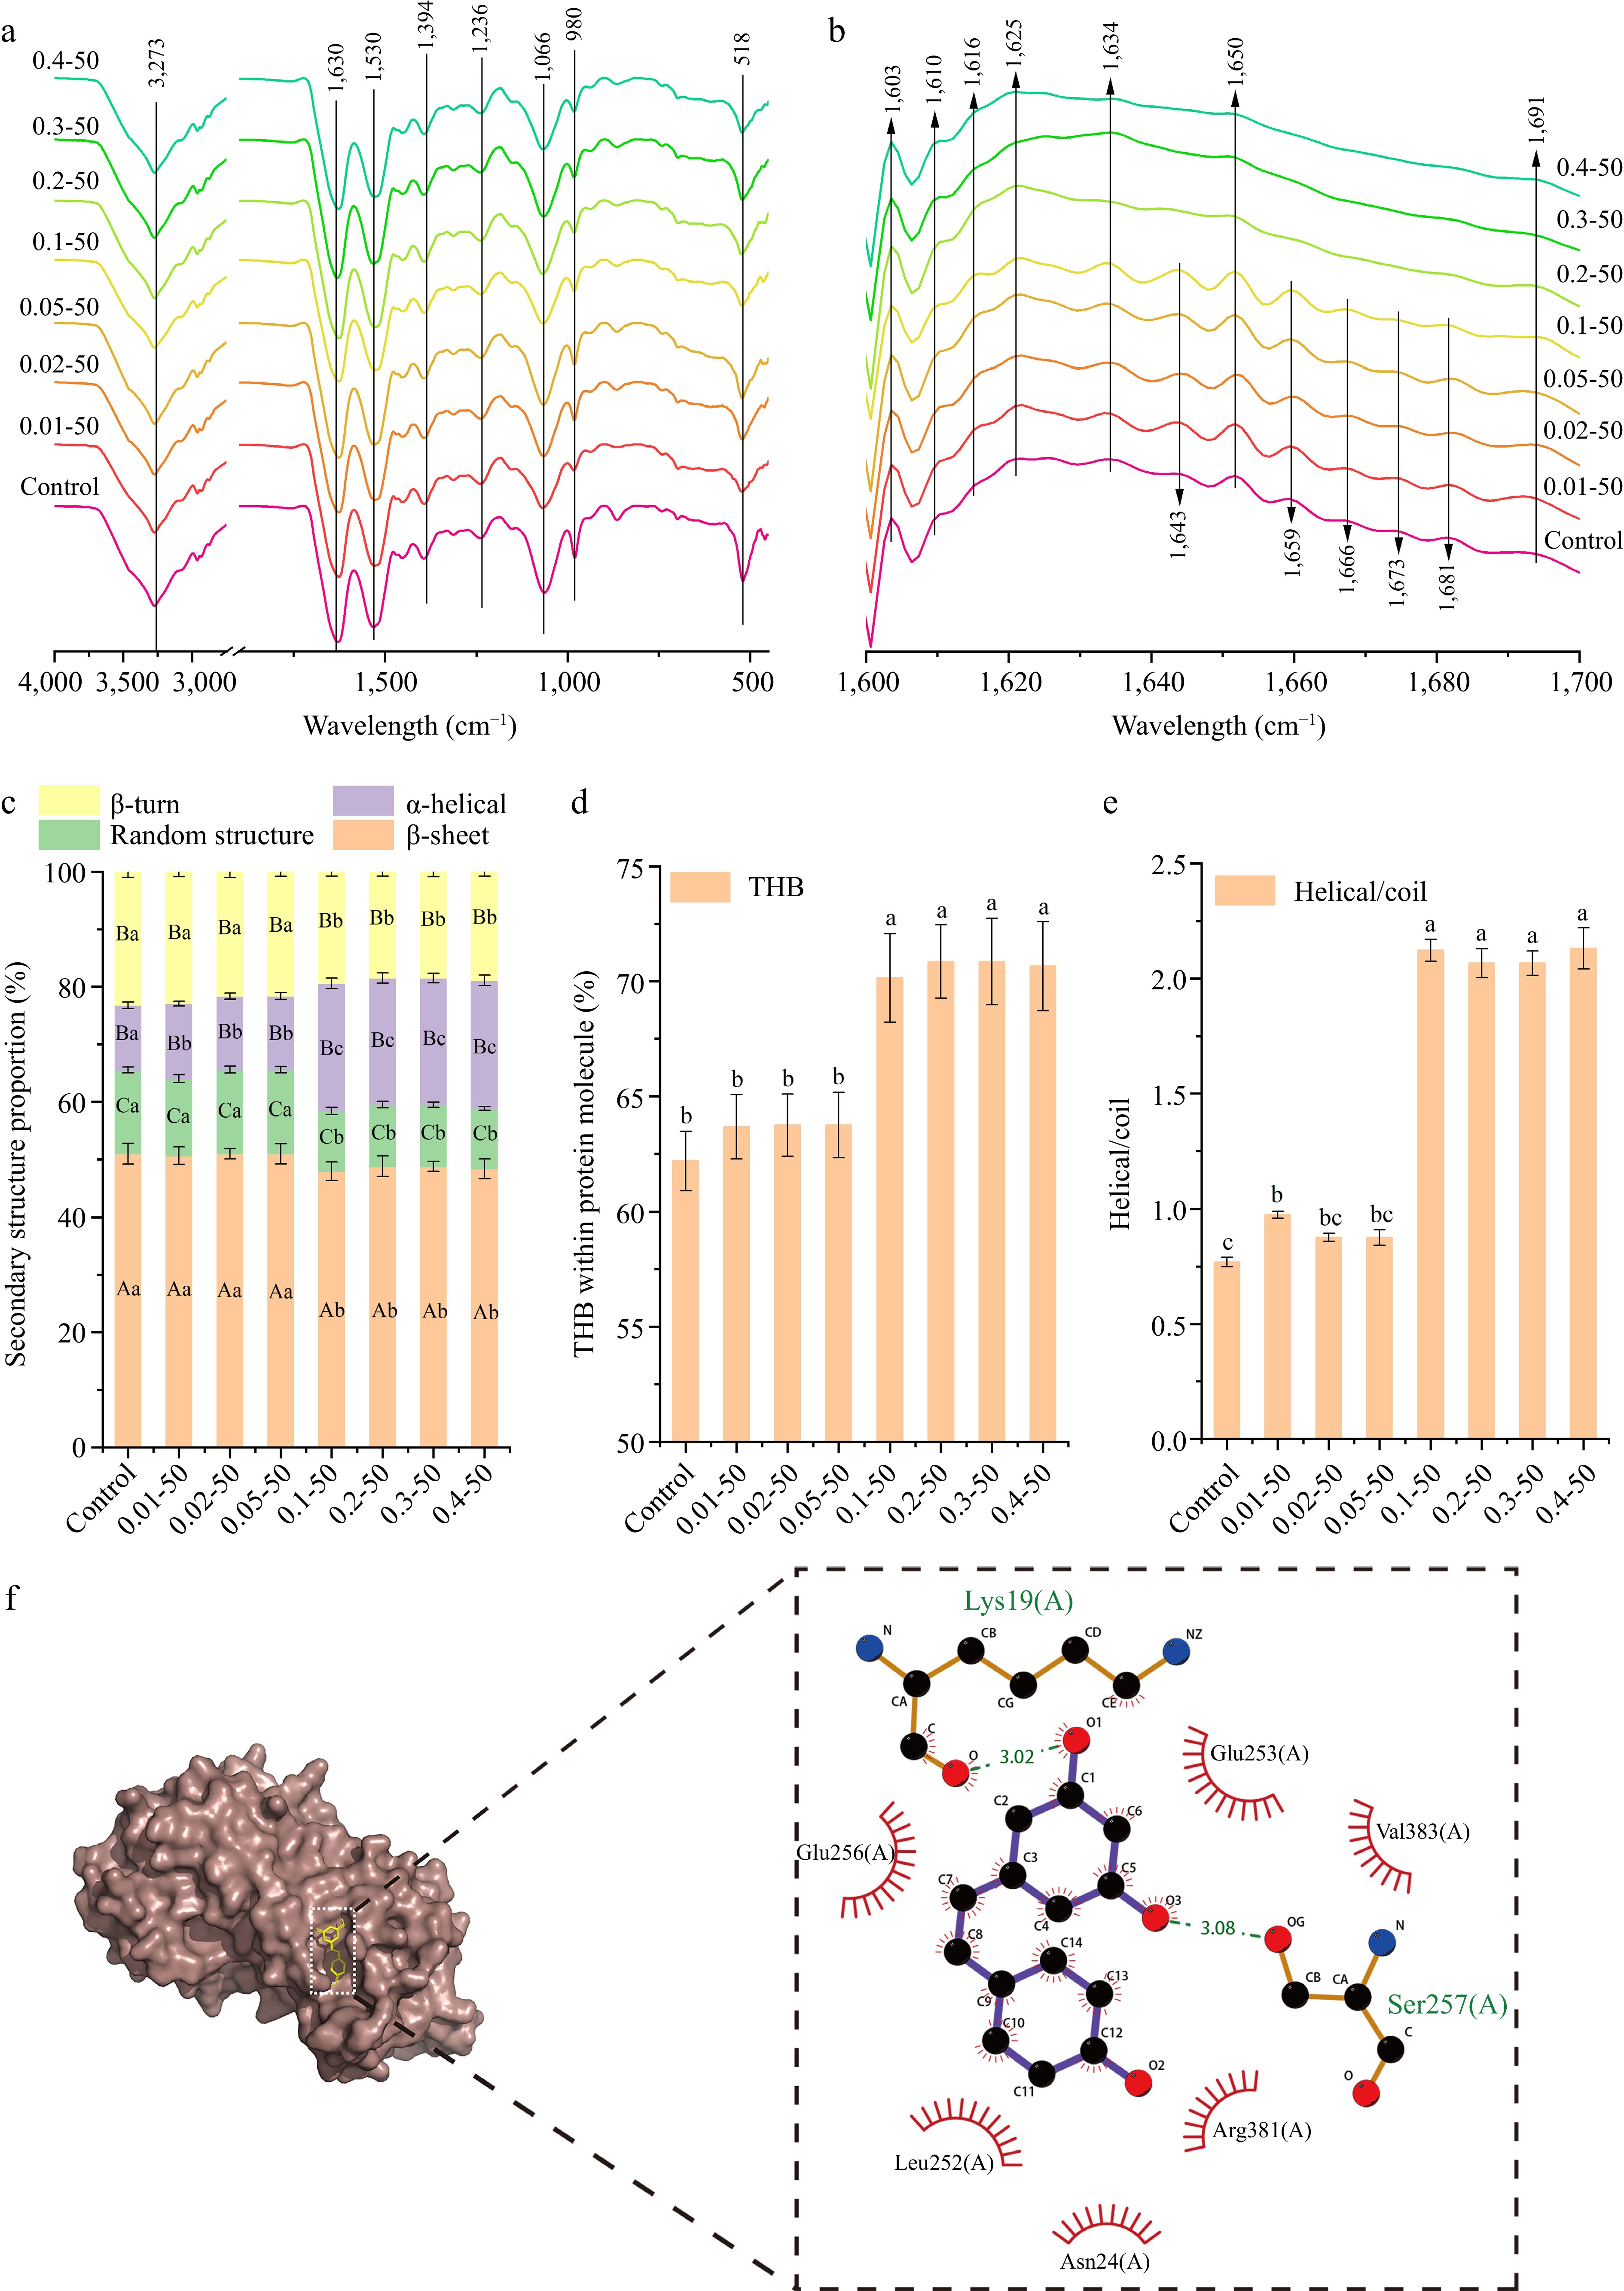
Figure 6.
The (a) FTIR spectra, (b) Fourier self-deconvolved infrared spectra, (c) secondary structure, (d) total hydrogen bonds within protein molecule (THB), (e) helical/coil ratio, and (f) the interaction forces between the amino-acid residues ( the green dashed line represents hydrogen bonding forces, red solid line represents hydrophobic force) of ethanol-induced EWP with adding different proportion of RES. 0.01−50, the preceding digits are RES concentrations (mg/mL), and the following numbers are ethanol concentrations (v/v), other groups are similar. Different letters indicate significant differences between groups (p < 0.05).
-
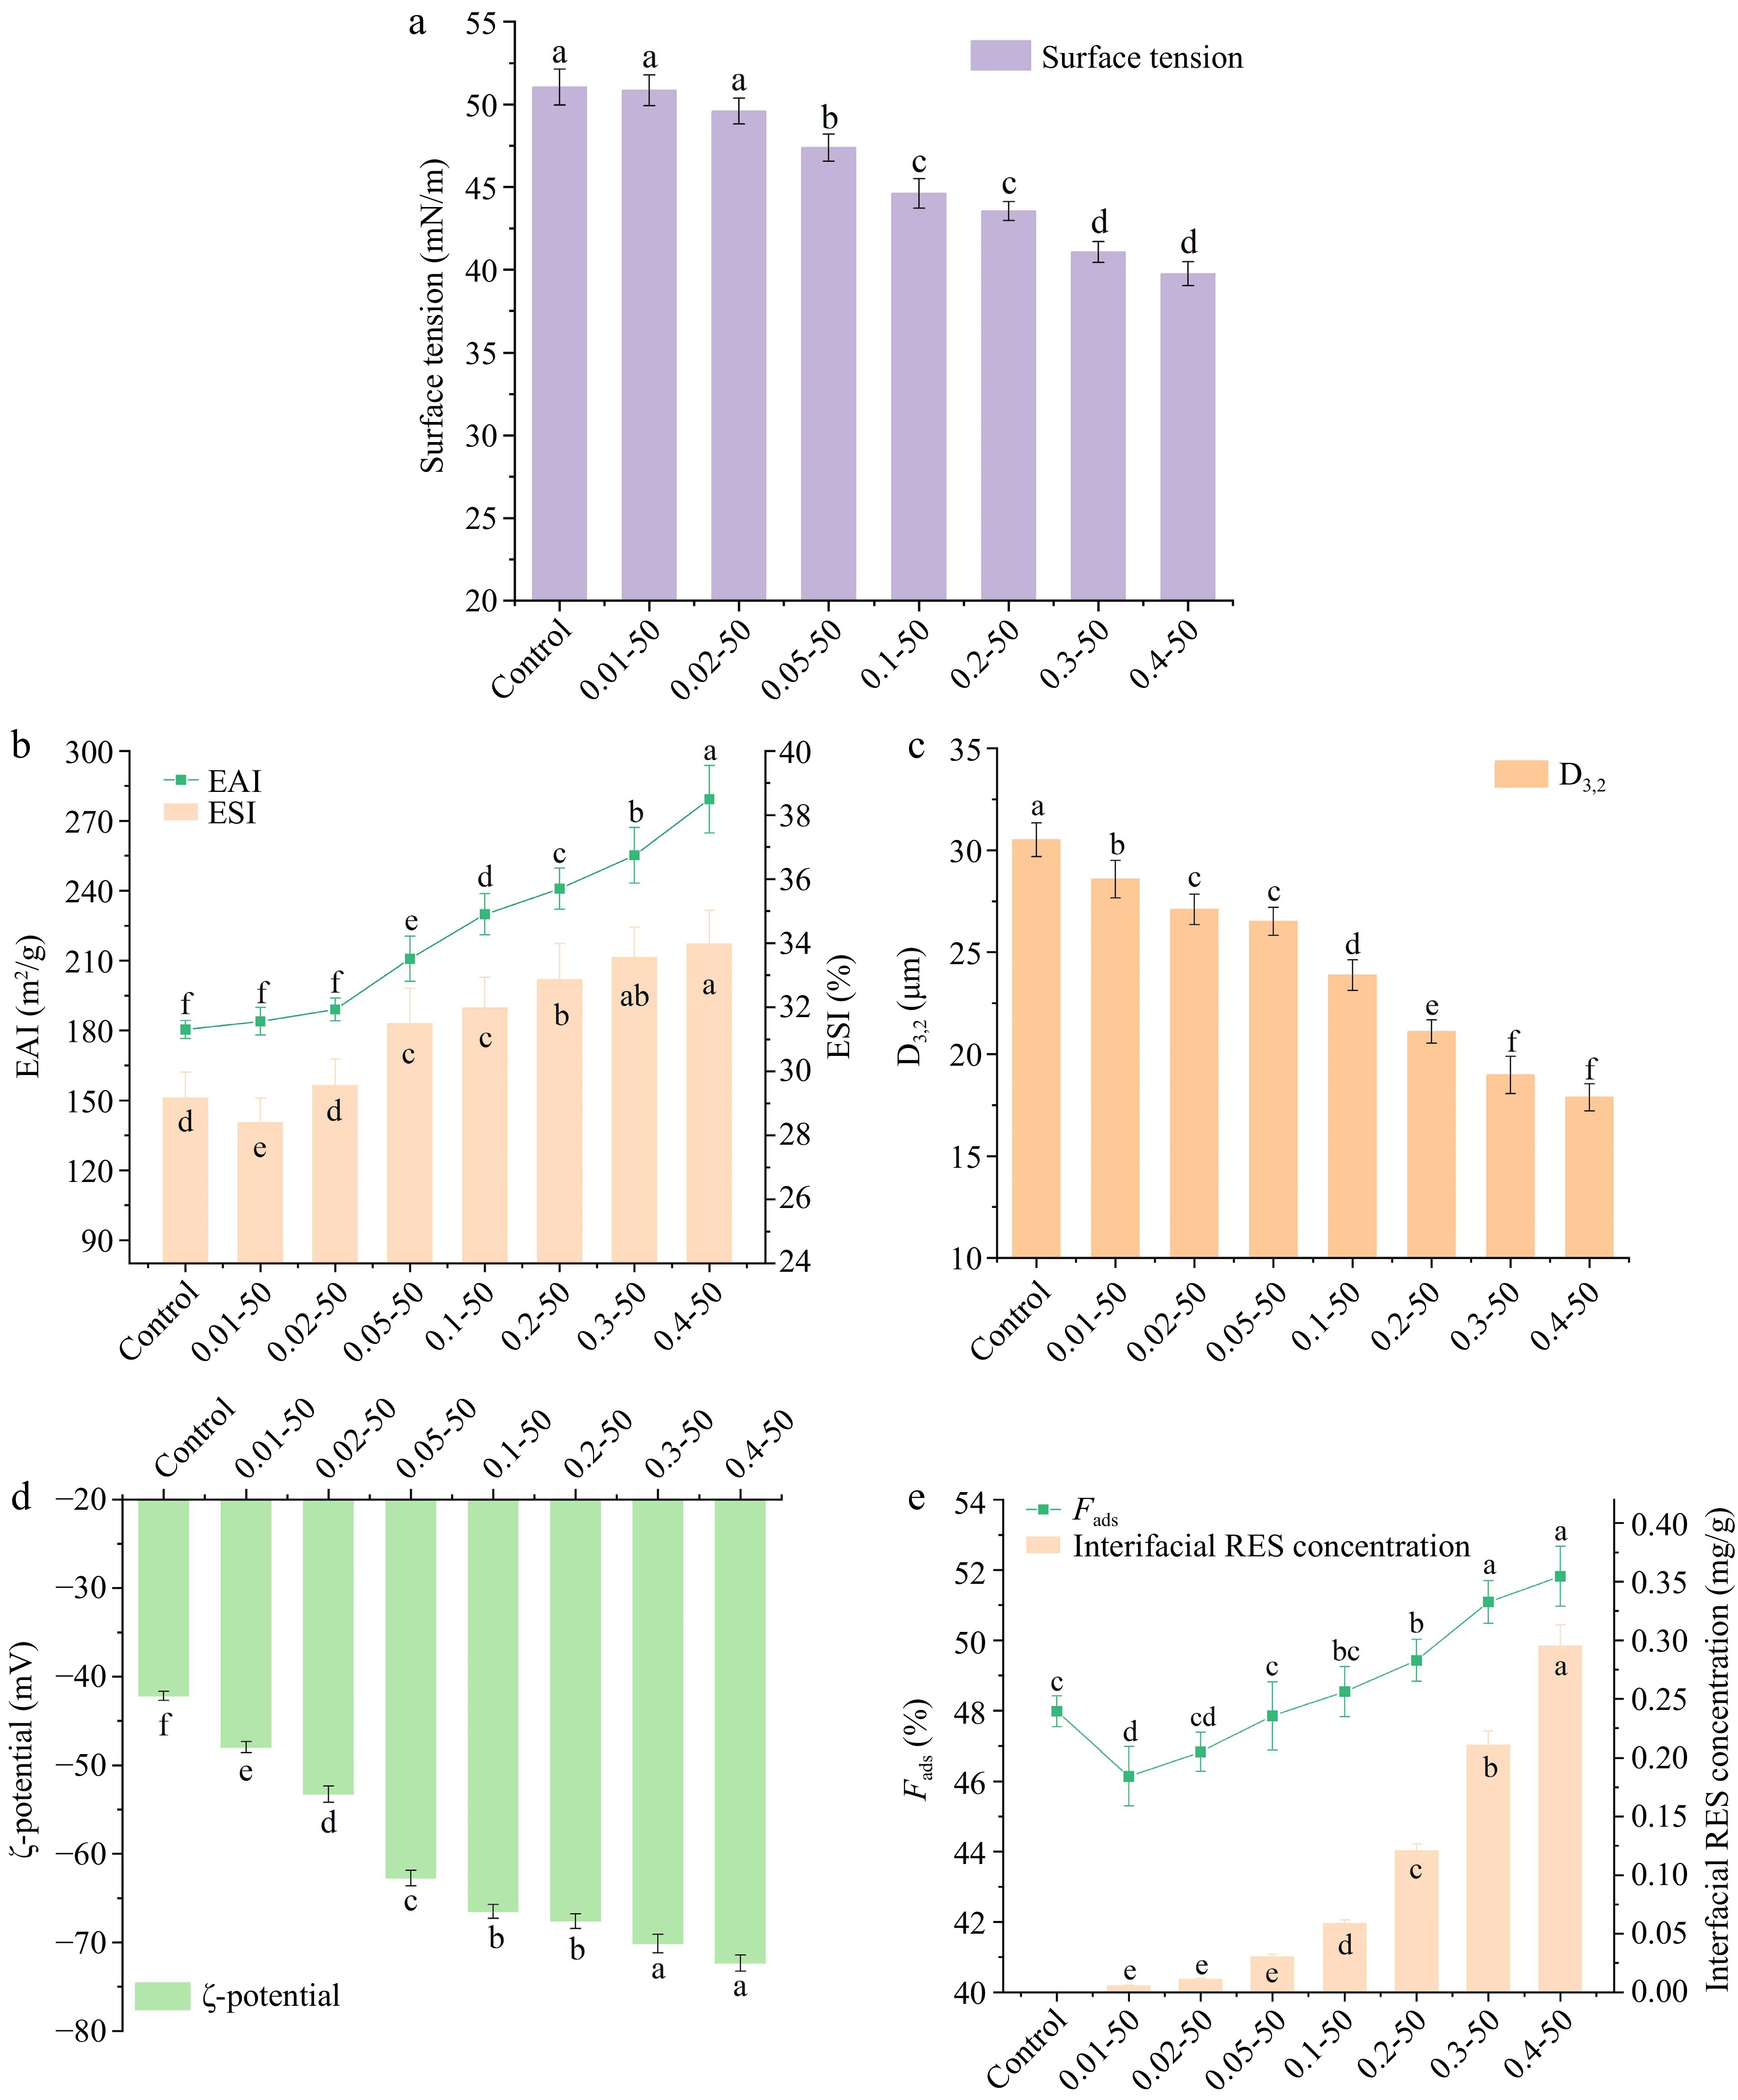
Figure 7.
The (a) surface tension, (b) emulsifying activity index (EAI) and emulsion stability index (ESI), (c) D3,2 changes, (d) zeta potential, (e) Fads and interfacial RES concentration of ethanol-induced EWP with adding different proportions of RES. Values are given as means ± standard deviation (n = 3). 0.01-50, the preceding digits are RES concentrations (mg/mL), and the following numbers are ethanol concentrations (v/v), other groups are similar. Different letters indicate significant differences between groups. * means significant difference (p < 0.05).
-
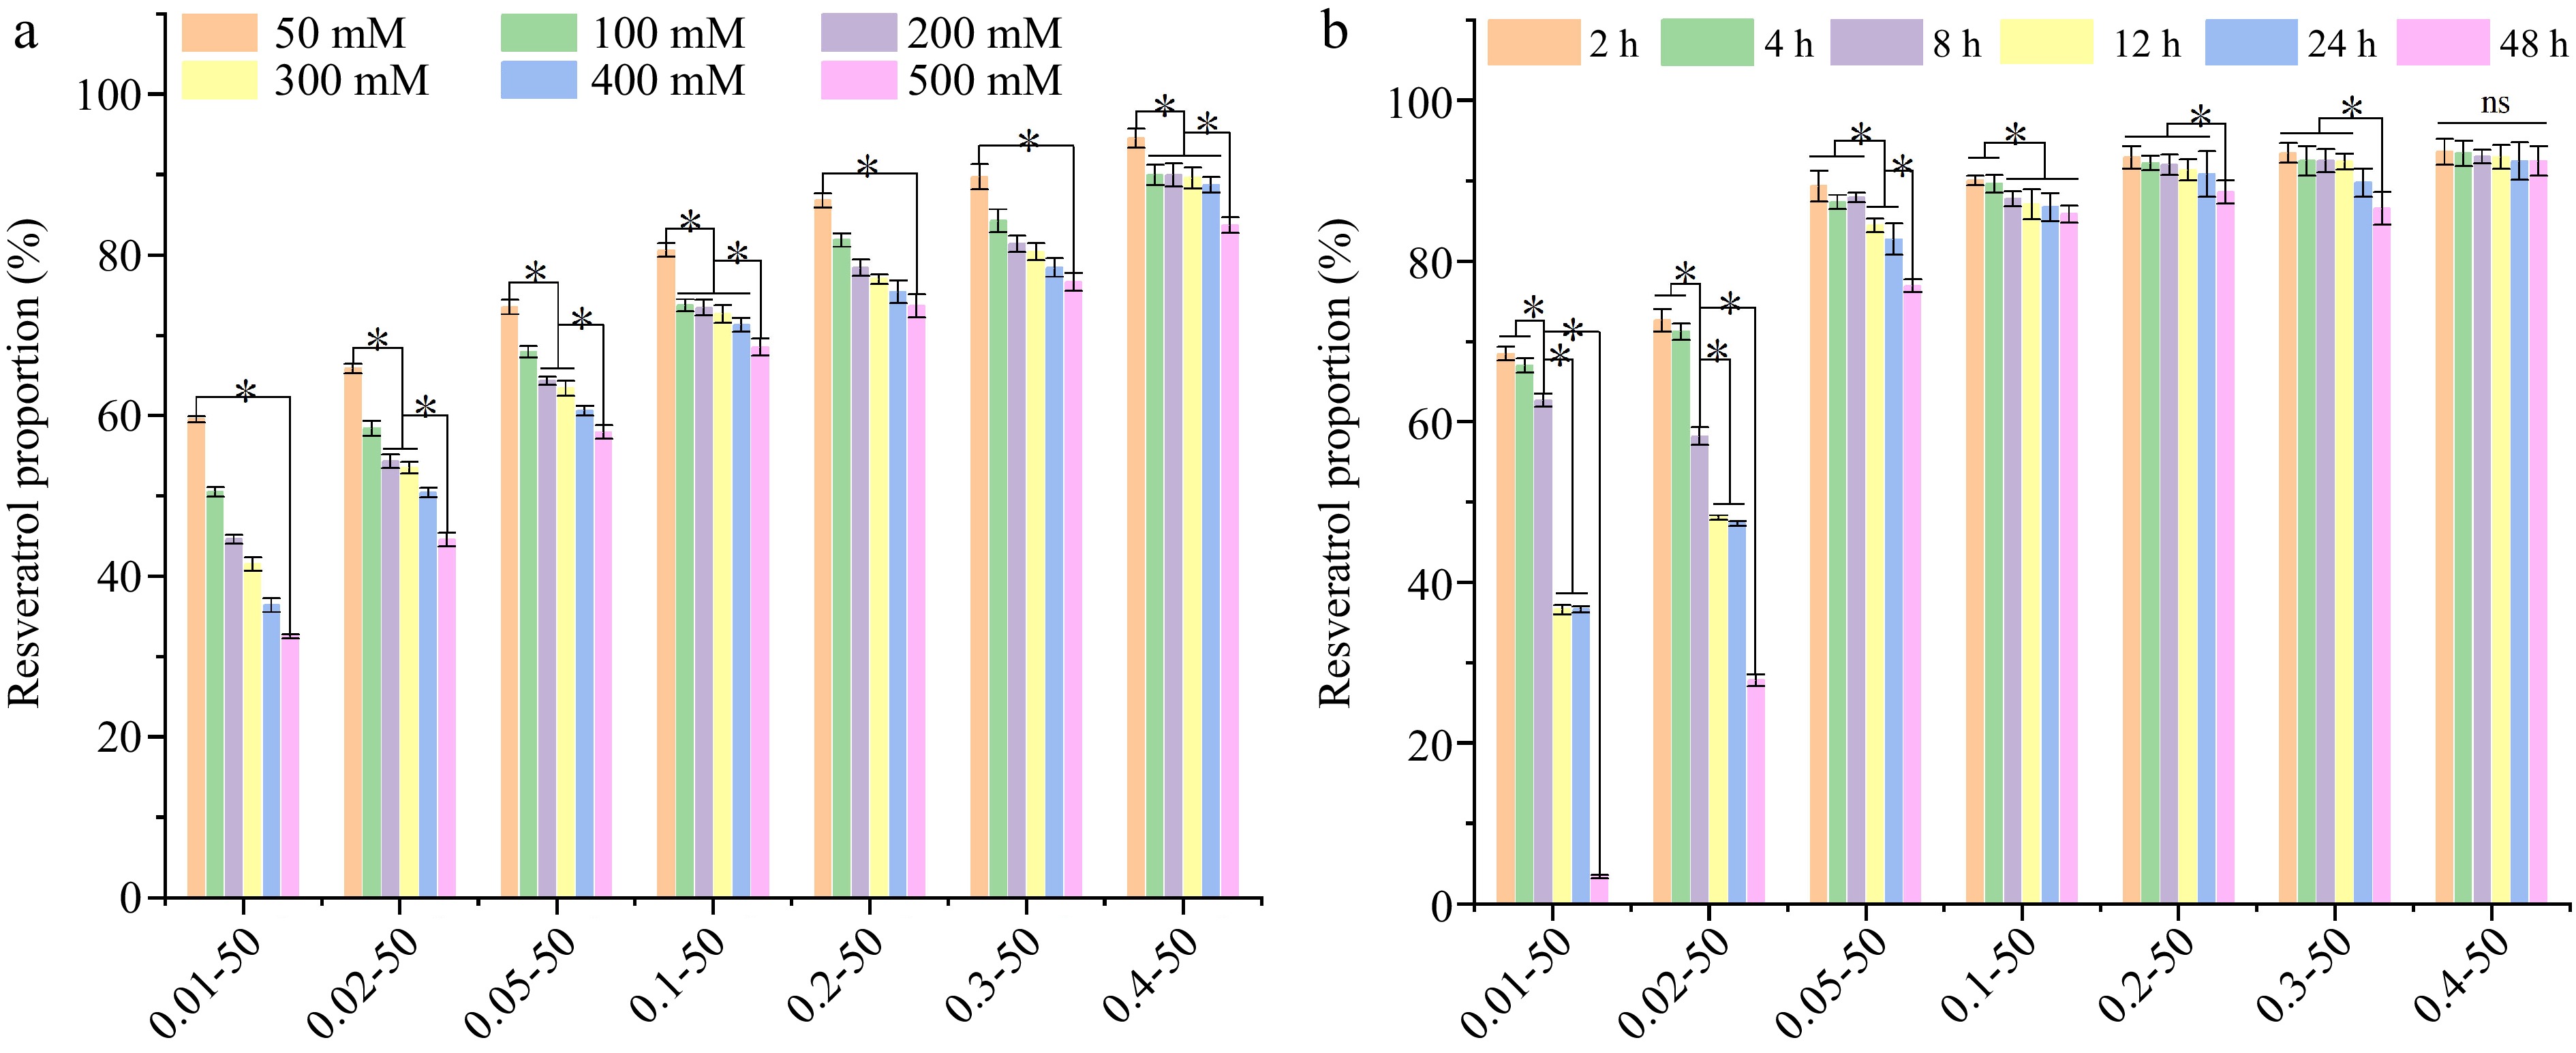
Figure 8.
The (a) ionic stability, and (b) storage stability of ethanol-induced EWP with adding different proportions of RES. 0.01−50, the preceding digits are RES concentrations (mg/mL), and the following numbers are ethanol concentrations (v/v), other groups are similar. Different letters indicate significant differences between groups. * Indicates significant difference (p < 0.05).
Figures
(8)
Tables
(0)