-
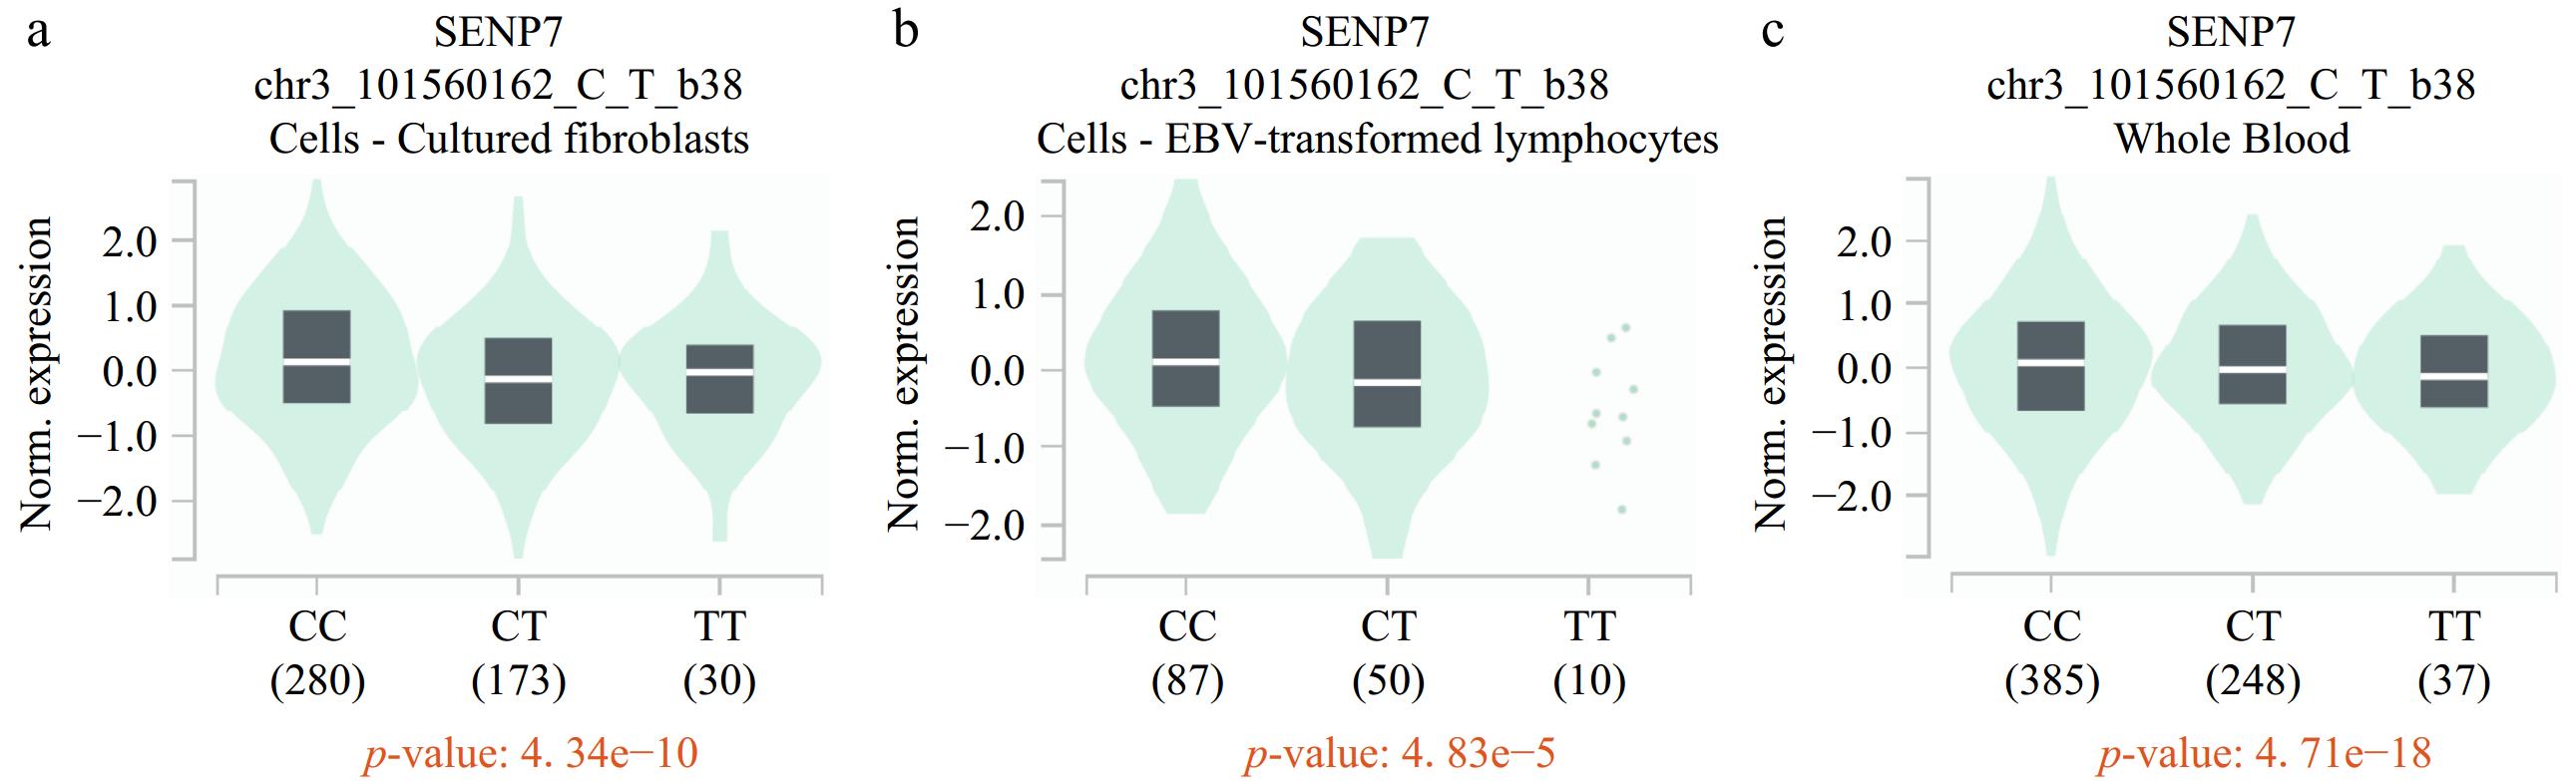
Figure 1.
eQTL analysis of rs7641261 in the GTEx database revealed a negative correlation with SENP expression. The rs7641261 variant shows significant eQTL effects, where the presence of the T allele is associated with (a) reduced SENP expression levels in cultured fibroblasts, (b) EBV-transformed lymphocytes, and (c) whole blood.
-
Genotype Cases (N = 398) Controls (N = 1198) Pa Crude OR (95% CI) P Adjusted OR (95% CI)b Pb rs7641261 C > T
(HWE = 0.425)CC 225 (56.53) 674 (56.26) 1.00 1.00 CT 143 (35.93) 456 (38.06) 0.94 (0.74−1.20) 0.611 0.94 (0.74−1.19) 0.604 TT 30 (7.54) 68 (5.68) 1.32 (0.84−2.08) 0.230 1.31 (0.83−2.07) 0.246 Additive 0. 653 1.04 (0.87−1.26) 0.653 1.04 (0.87−1.25) 0.676 Dominant 173 (43.47) 524 (43.74) 0.924 0.99 (0.79−1.24) 0.924 0.99 (0.79−1.24) 0.908 Recessive 368 (92.46) 1130 (94.32) 0.180 1.36 (0.87−2.12) 0.182 1.34 (0.86−2.10) 0.195 rs2303476 T > C
(HWE = 0.797)TT 245 (61.56) 740 (61.77) 1.00 1.00 TC 134 (33.67) 405 (33.81) 1.00 (0.78−1.27) 0.996 0.99 (0.78−1.27) 0.964 CC 19 (4.77) 53 (4.42) 1.08 (0.63−1.87) 0.774 1.09 (0.63−1.88) 0.756 Additive 0.867 1.02 (0.84−1.24) 0.867 1.02 (0.84−1.24) 0.878 Dominant 153 (38.44) 458 (38.23) 0.940 1.01 (0.80−1.27) 0.940 1.01 (0.80−1.27) 0.964 Recessive 379 (95.23) 1145 (95.58) 0.771 1.08 (0.63−1.85) 0.771 1.09 (0.64−1.87) 0.748 rs4257518 A > G
(HWE = 0.416)AA 121 (30.40) 364 (30.38) 1.00 1.00 AG 186 (46.73) 580 (48.41) 0.97 (0.74−1.26) 0.790 0.97 (0.74−1.26) 0.806 GG 91 (22.86) 254 (21.20) 1.08 (0.79−1.48) 0.642 1.07 (0.78−1.47) 0.667 Additive 0.691 1.03 (0.88−1.21) 0.691 1.03 (0.88−1.21) 0.714 Dominant 277 (69.60) 834 (69.62) 0.995 1.00 (0.78−1.28) 0.995 1.00 (0.78−1.28) 0.996 Recessive 307 (77.14) 944 (78.80) 0.485 1.10 (0.83−1.45) 0.485 1.09 (0.83−1.44) 0.519 rs3762735 C > G
(HWE = 0.489)CC 304 (76.38) 903 (75.38) 1.00 1.00 CG 85 (21.36) 271 (22.62) 0.93 (0.71−1.23) 0.616 0.93 (0.70−1.23) 0.602 GG 9 (2.26) 24 (2.00) 1.11 (0.51−2.42) 0.786 1.11 (0.51−2.41) 0.800 Additive 0.790 0.97 (0.77−1.23) 0.791 0.97 (0.76−1.22) 0.771 Dominant 94 (23.62) 295 (24.62) 0.685 0.95 (0.73−1.24) 0.685 0.94 (0.72−1.23) 0.669 Recessive 389 (97.74) 1174 (98.00) 0.754 1.13 (0.52−2.46) 0.754 1.12 (0.52−2.44) 0.767 Risk genotypesc 0 295 (74.12) 919 (76.71) 1.00 1.00 1−4 103 (25.88) 279 (23.29) 0.294 1.15 (0.89−1.49) 0.294 1.14 (0.88−1.48) 0.324 OR, odds ratio; CI, confidence interval; HWE, Hardy-Weinberg equilibrium. a χ2 test for genotype distributions between Wilms tumor patients and cancer-free controls. b Adjusted for age and sex. c Risk genotypes were rs7641261 TT, rs2303476 CC, rs4257518 GG, and rs3762735 GG. Table 1.
Association between TRMT10C gene polymorphisms and Wilms tumor risk.
-
Variables rs7641261 (cases/controls) AOR (95% CI)a Pa Risk genotypes (cases/controls) AOR (95% CI)a Pa CC/CT TT 0 1−4 Age (month) ≤ 18 127/438 9/27 1.18 (0.54−2.58) 0.679 103/363 33/102 1.17 (0.74−1.83) 0.503 > 18 241/692 21/41 1.47 (0.85−2.54) 0.169 192/556 70/170 1.13 (0.82−1.56) 0.465 Sex Females 176/484 10/37 0.75 (0.36−1.53) 0.423 136/386 50/135 1.05 (0.72−1.54) 0.788 Males 192/646 20/31 2.15 (1.20−3.86) 0.011 159/533 53/144 1.24 (0.86−1.77) 0.253 Clinical stages I 126/1130 11/68 1.39 (0.72−2.71) 0.331 93/919 44/279 1.53 (1.04−2.25) 0.030 II 97/1130 14/68 2.35 (1.27−4.34) 0.006 76/919 35/279 1.50 (0.98−2.29) 0.059 III 88/1130 3/68 0.58 (0.18−1.89) 0.366 79/919 12/279 0.51 (0.27−0.95) 0.033 IV 41/1130 2/68 0.80 (0.19−3.38) 0.759 35/919 8/279 0.75 (0.34−1.63) 0.462 I + II 223/1130 25/68 1.81 (1.12−2.93) 0.016 169/919 79/279 1.52 (1.13−2.05) 0.006 III + IV 129/1130 5/68 0.65 (0.26−1.65) 0.364 114/919 20/279 0.58 (0.35−0.95) 0.031 AOR, adjusted odds ratio; CI, confidence interval. a Adjusted for age and sex, omitting the corresponding stratification factor. Values were in bold if the p values less than 0.05 or the 95% CI excluding 1.00. Table 2.
Stratification analysis of TRMT10C protective genotypes and Wilms tumor risk.
Figures
(1)
Tables
(2)