-
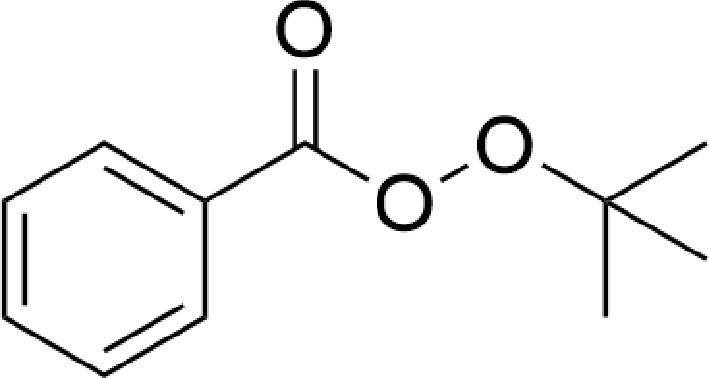
Figure 1.
The chemical structure of TBPB.
-
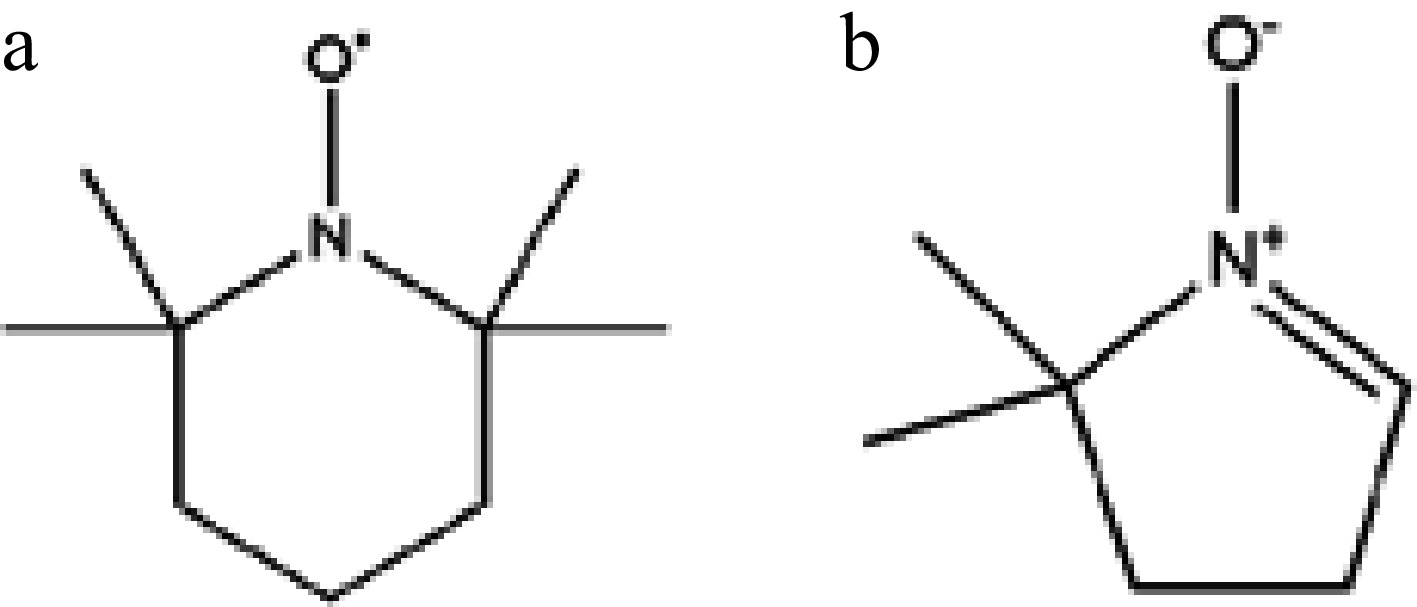
Figure 2.
The chemical structures of (a) TEMPO, and (b) DMPO.
-
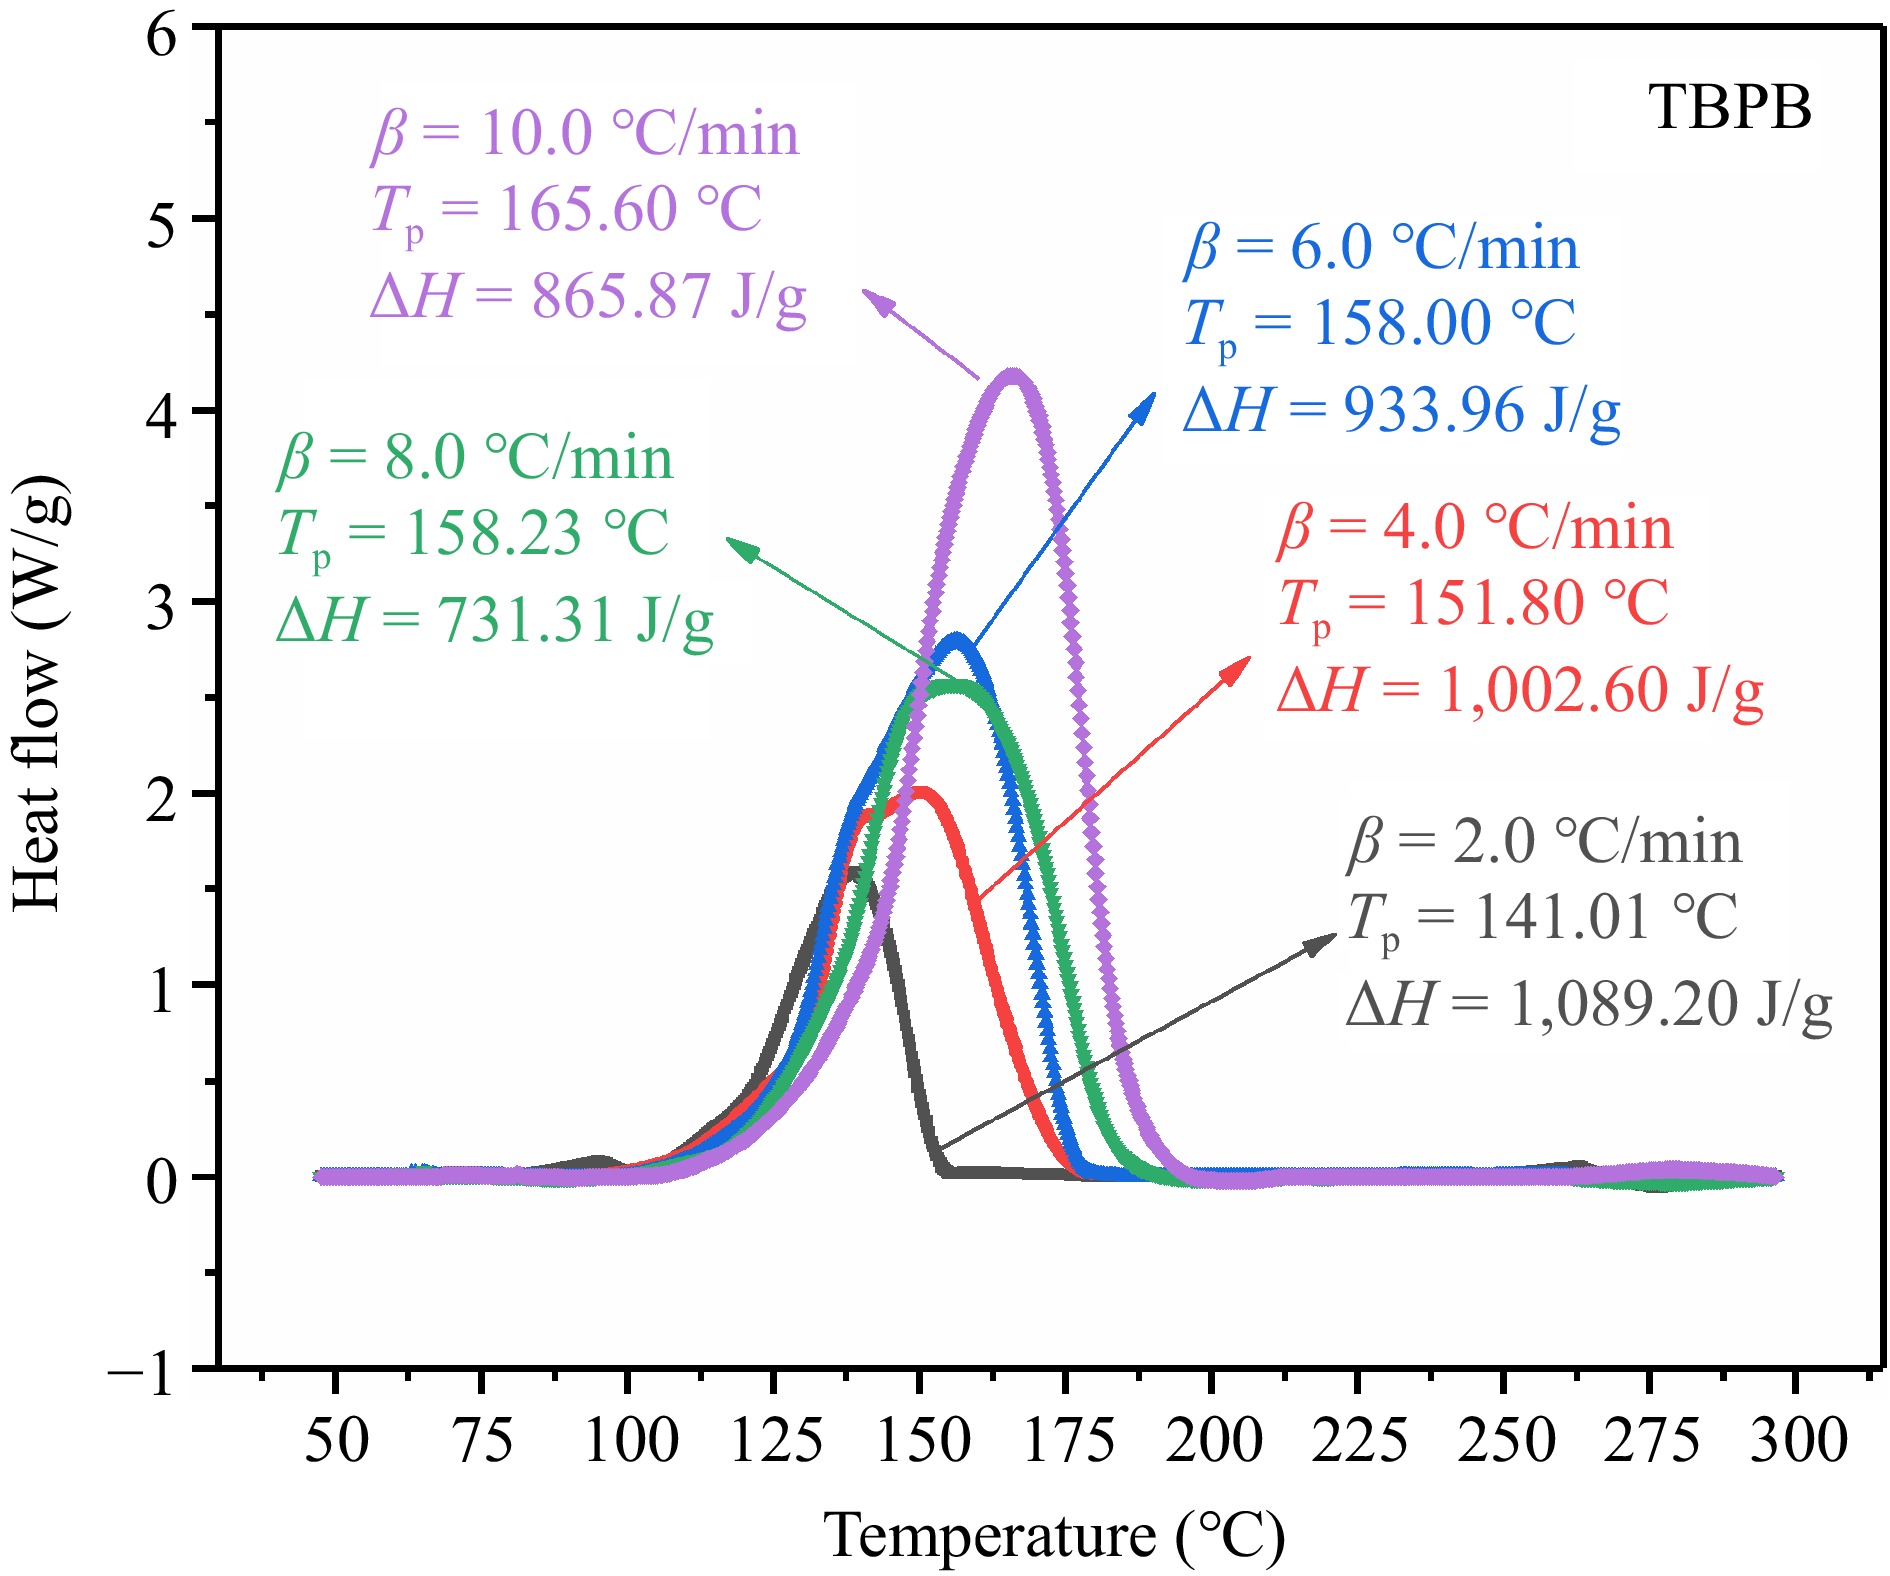
Figure 3.
Exothermic DSC curves of TBPB at five β.
-
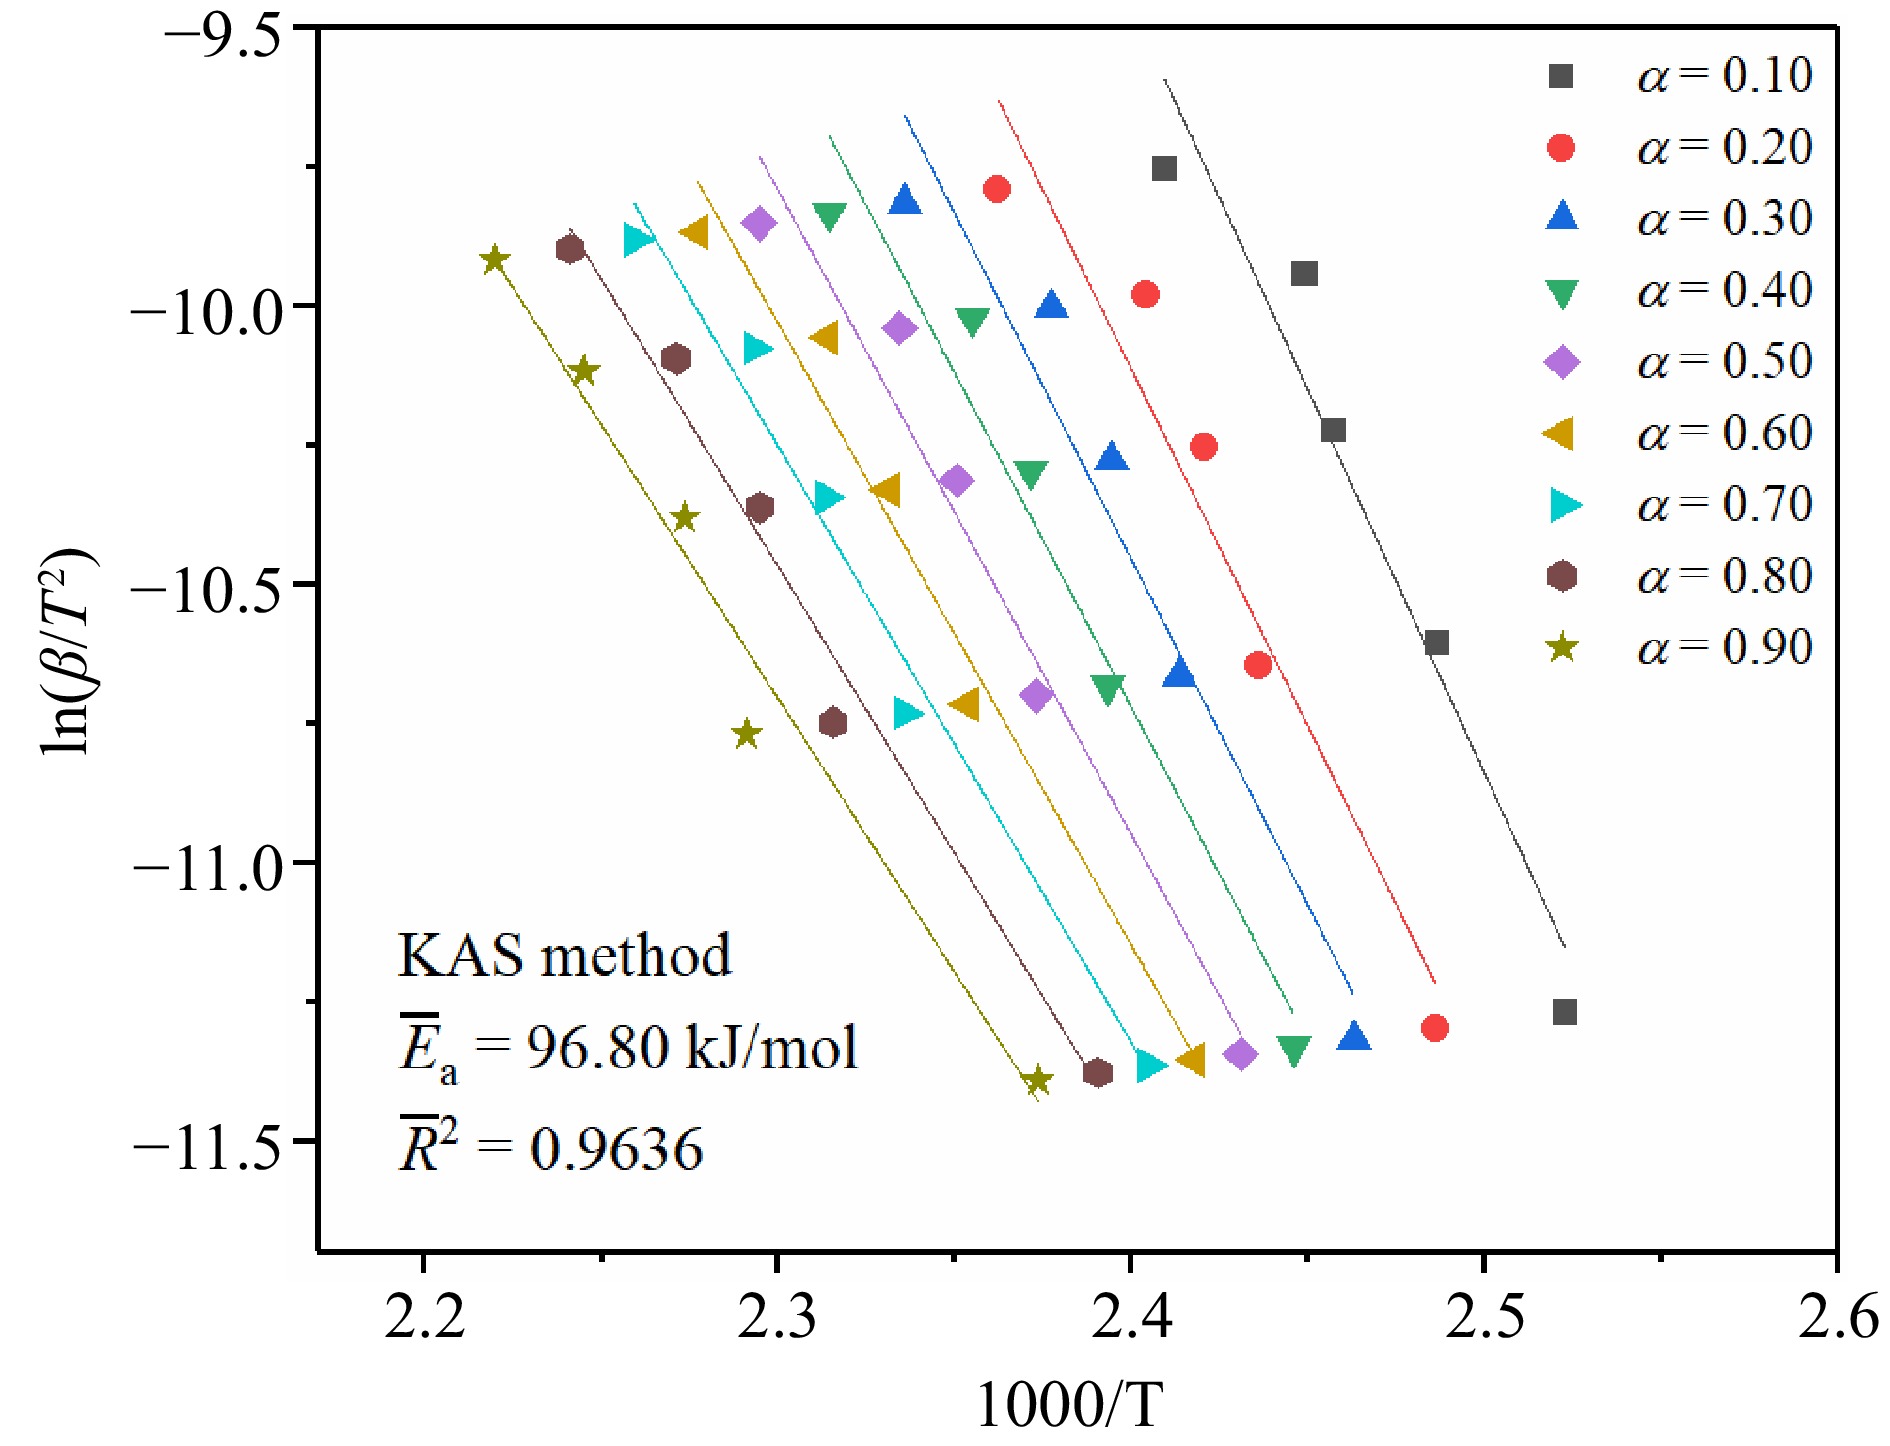
Figure 4.
The fitting results of TBPB's Ea by the KAS method.
-
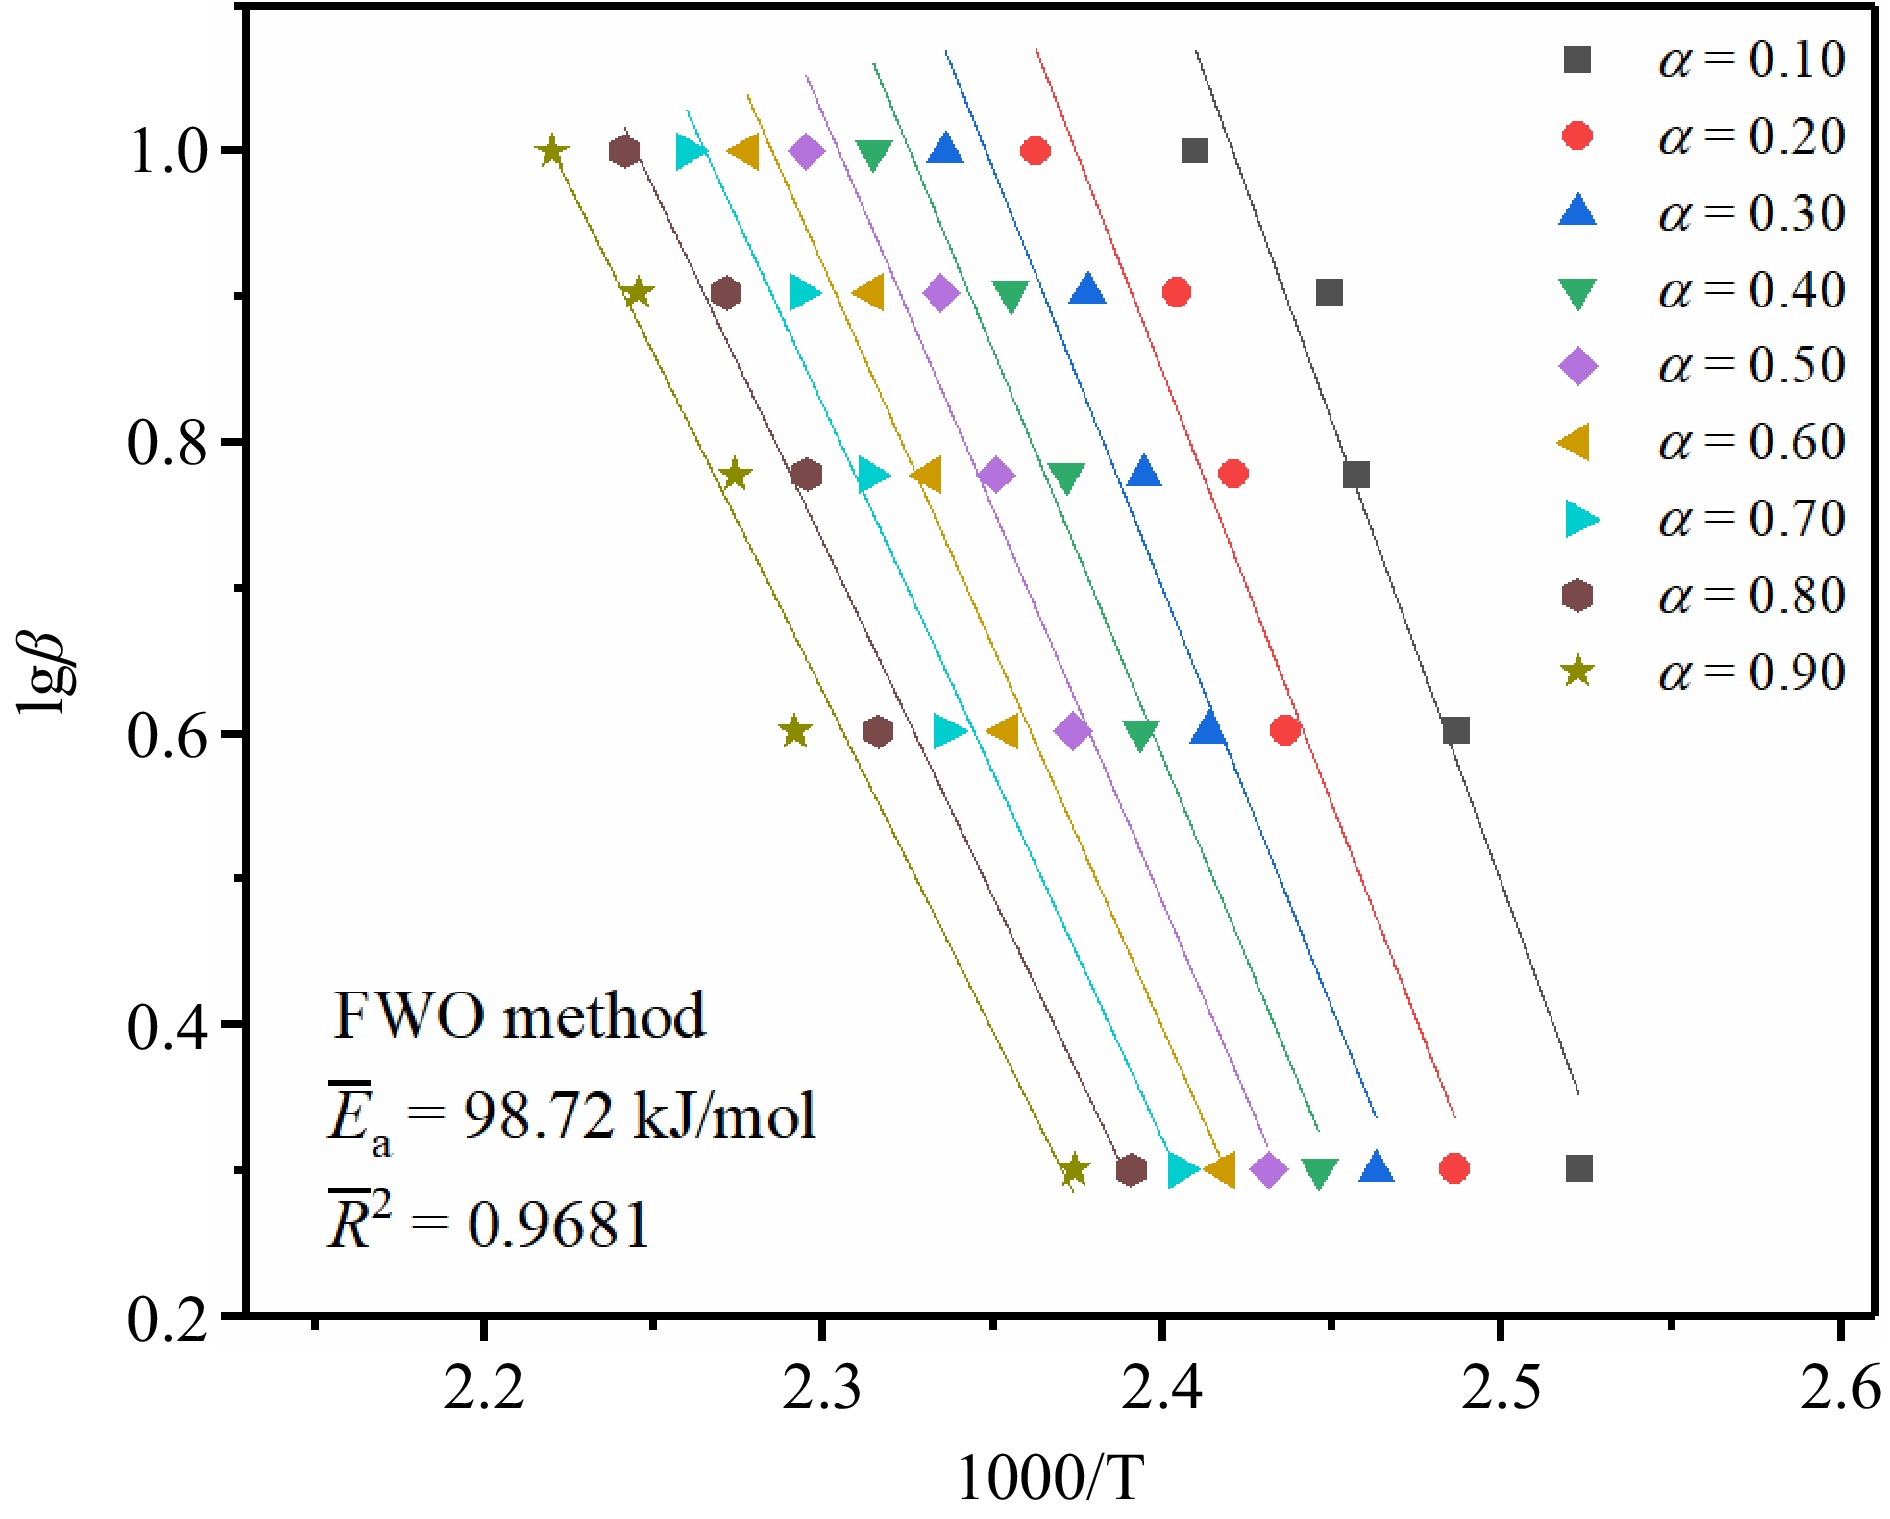
Figure 5.
The fitting results of TBPB's Ea by the FWO method.
-
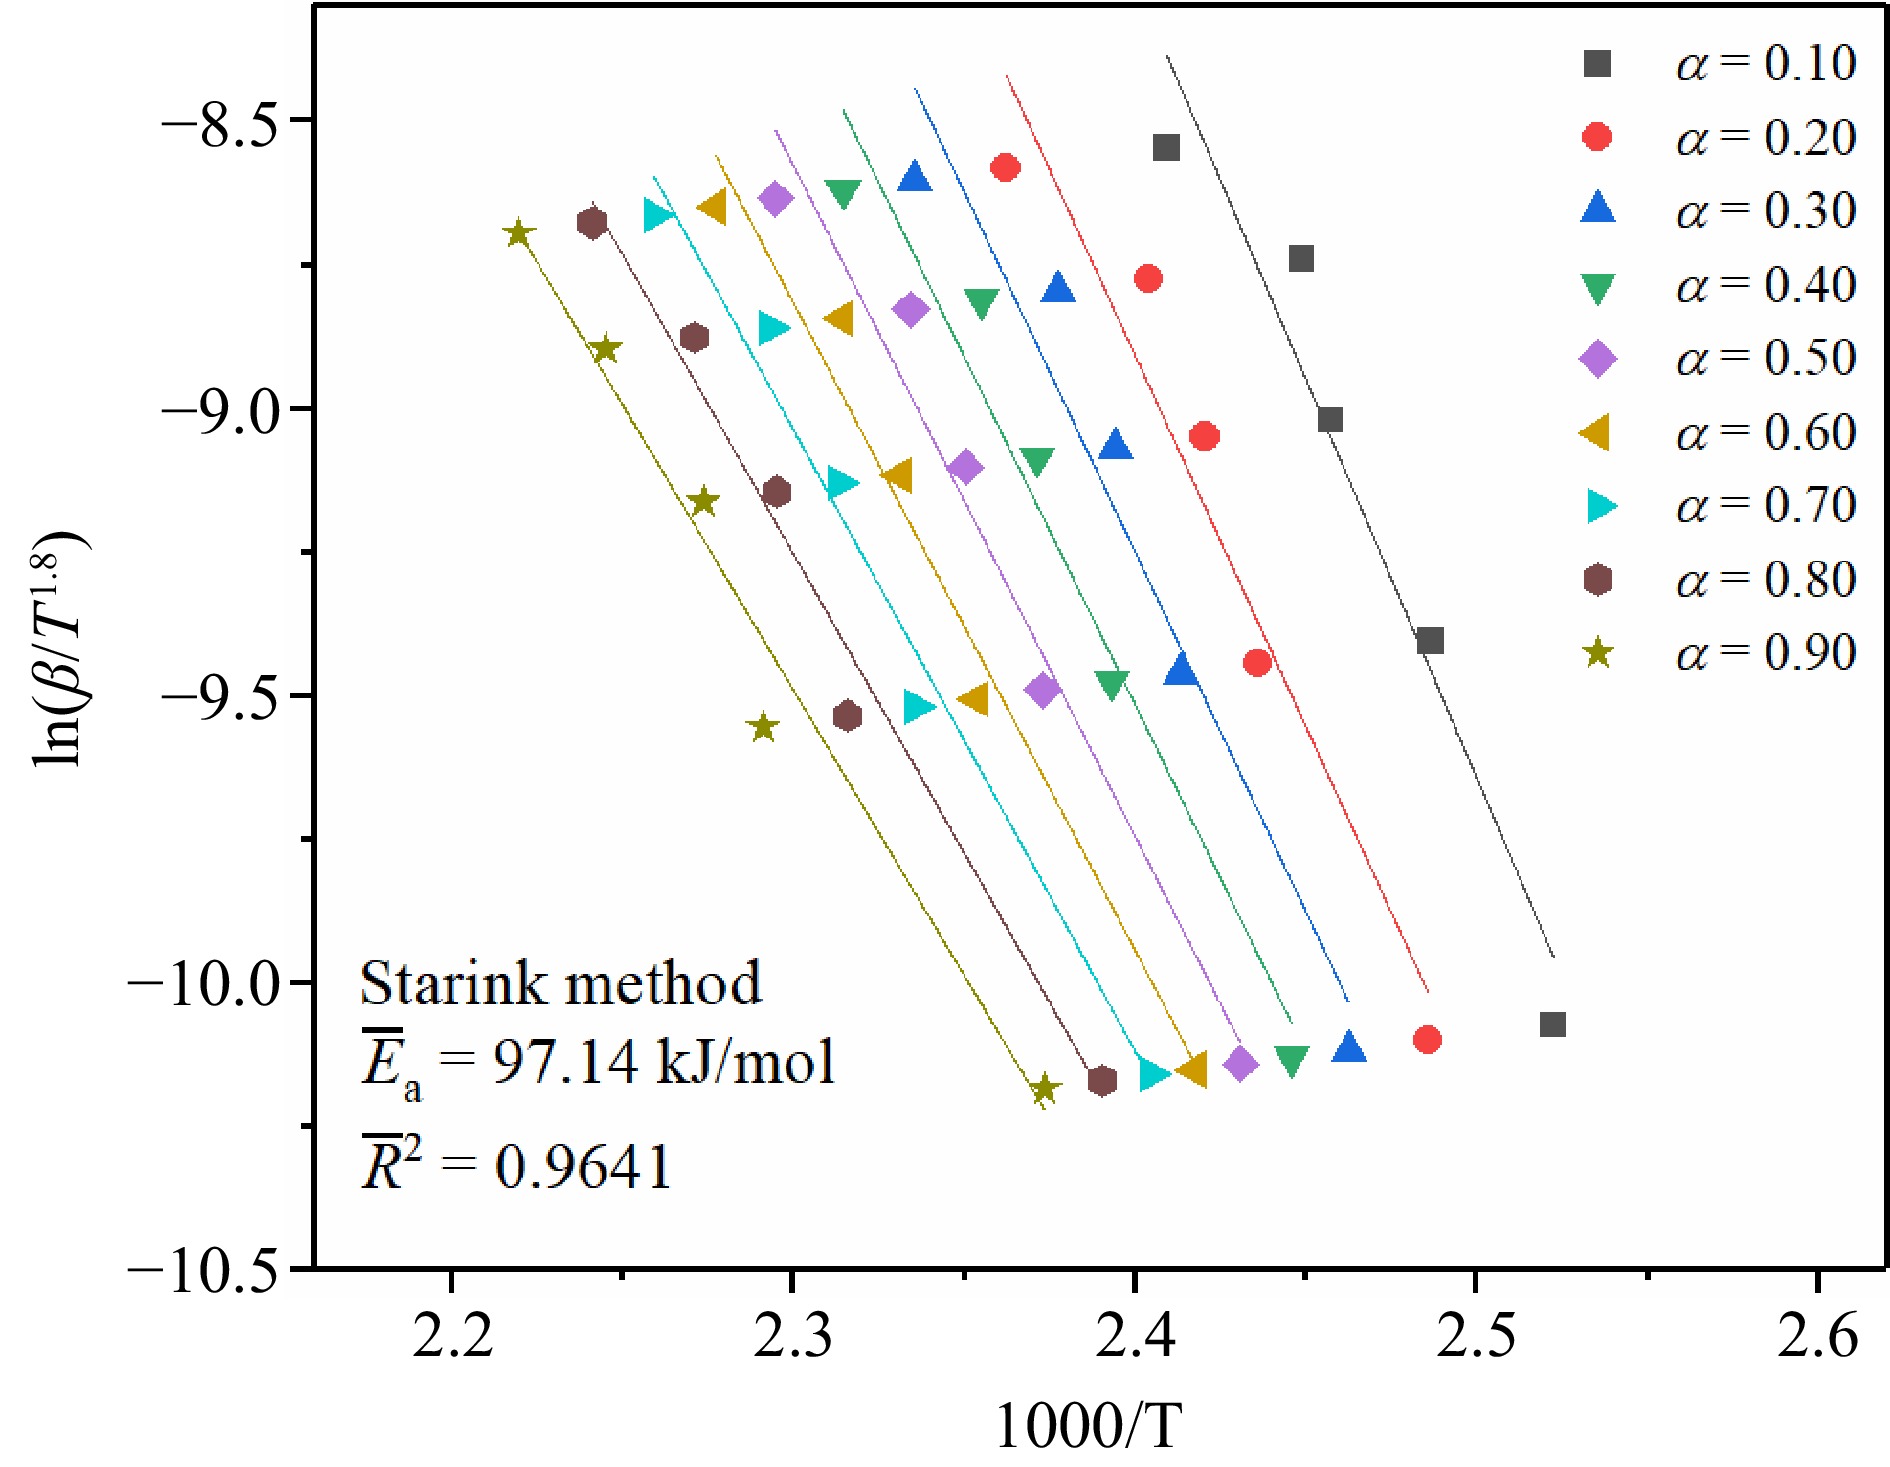
Figure 6.
The fitting results of TBPB's Ea by the Starink method.
-
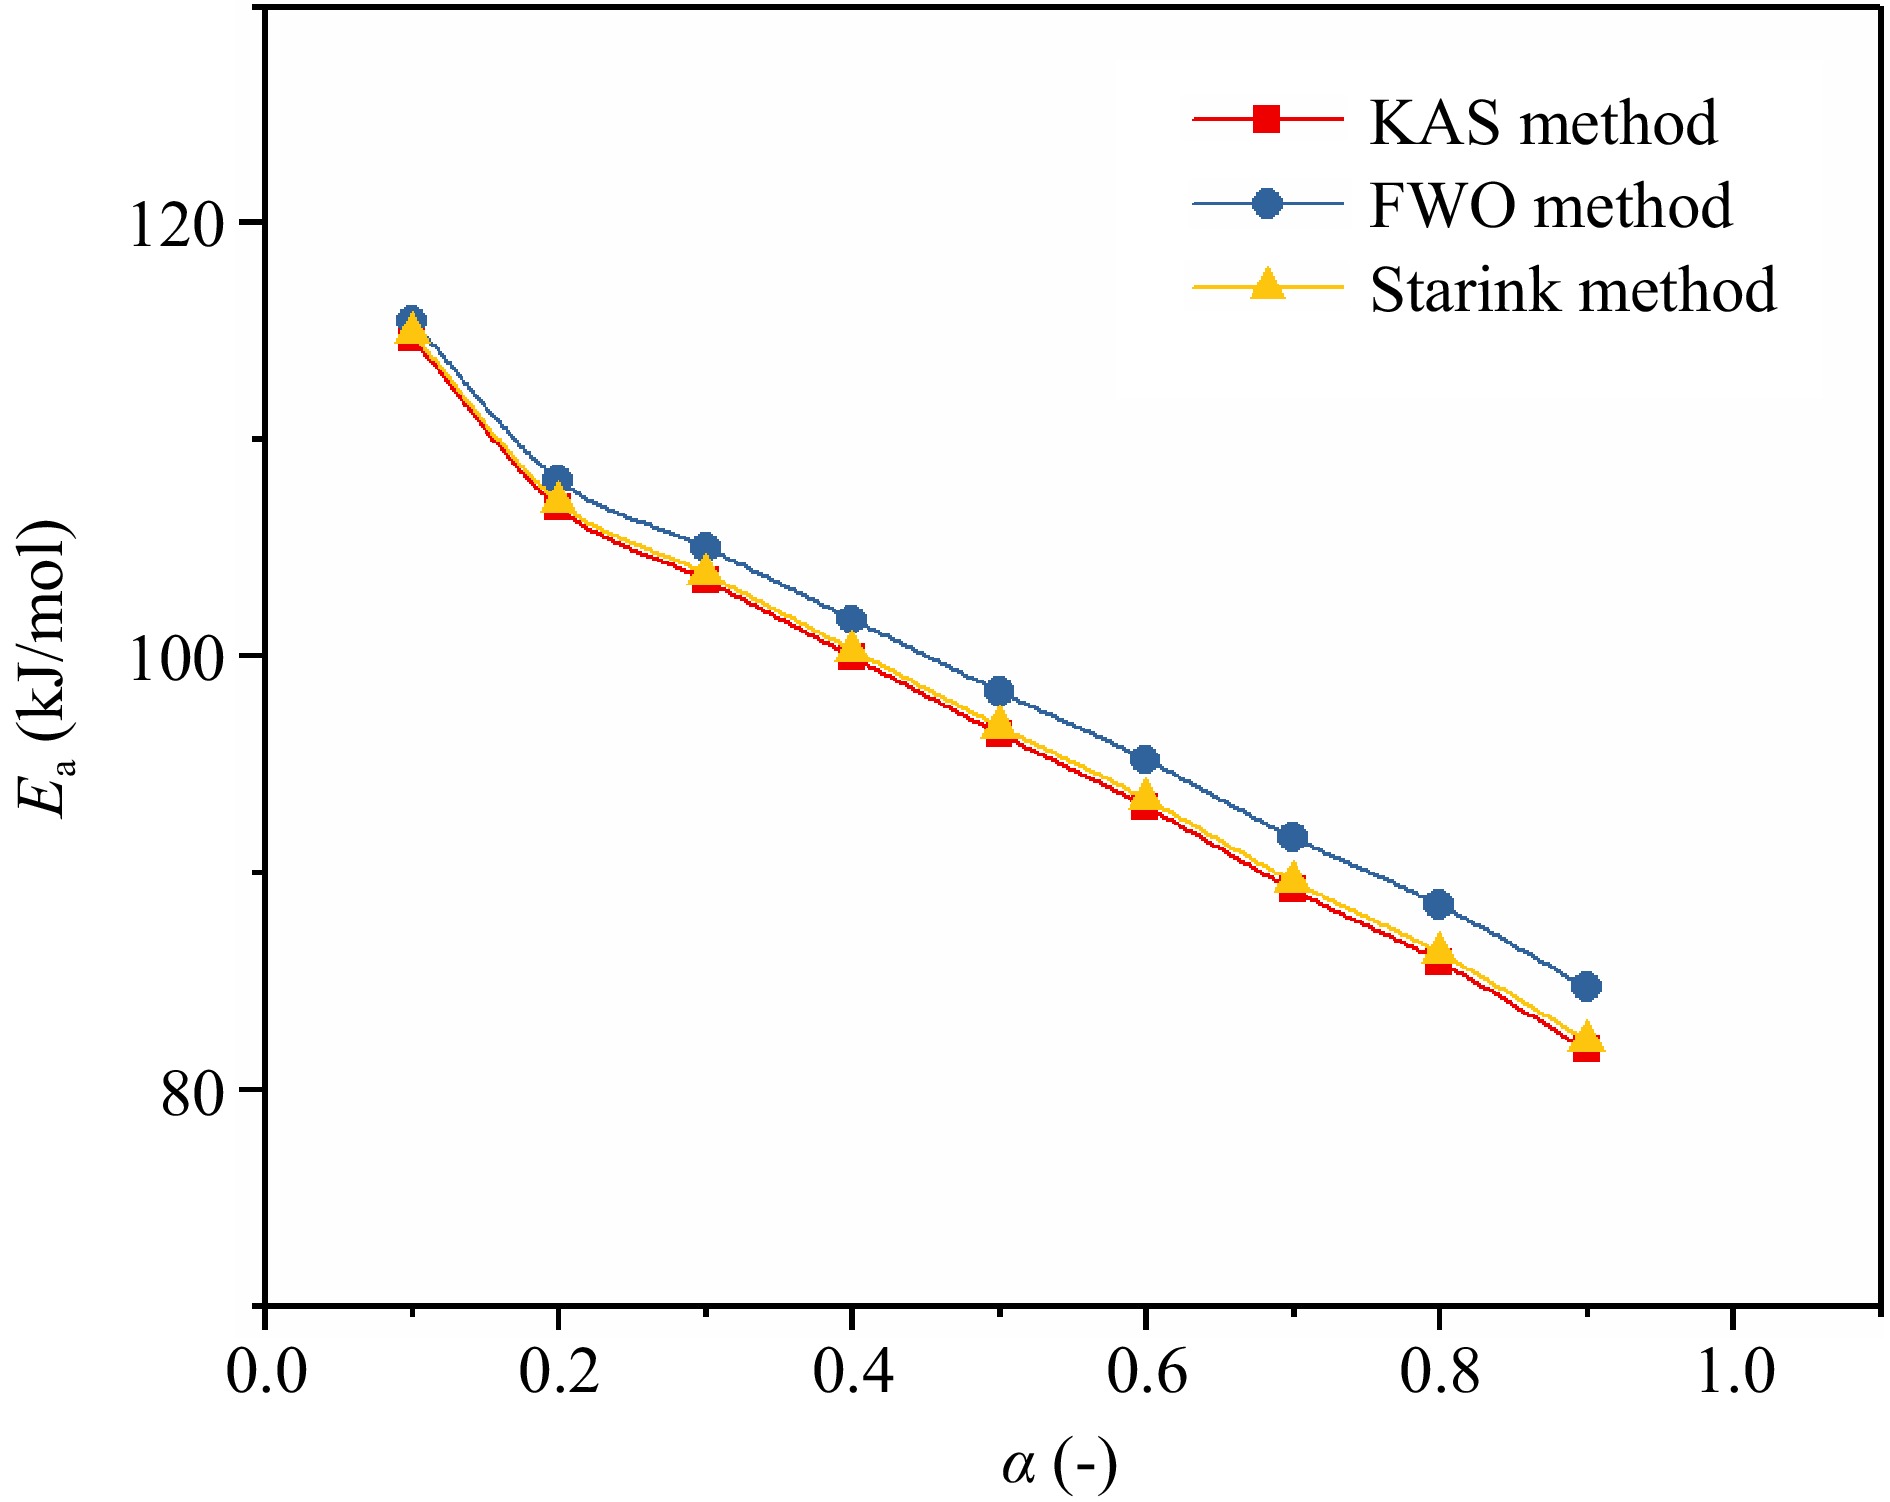
Figure 7.
Changes of TBPB's Ea under different α.
-
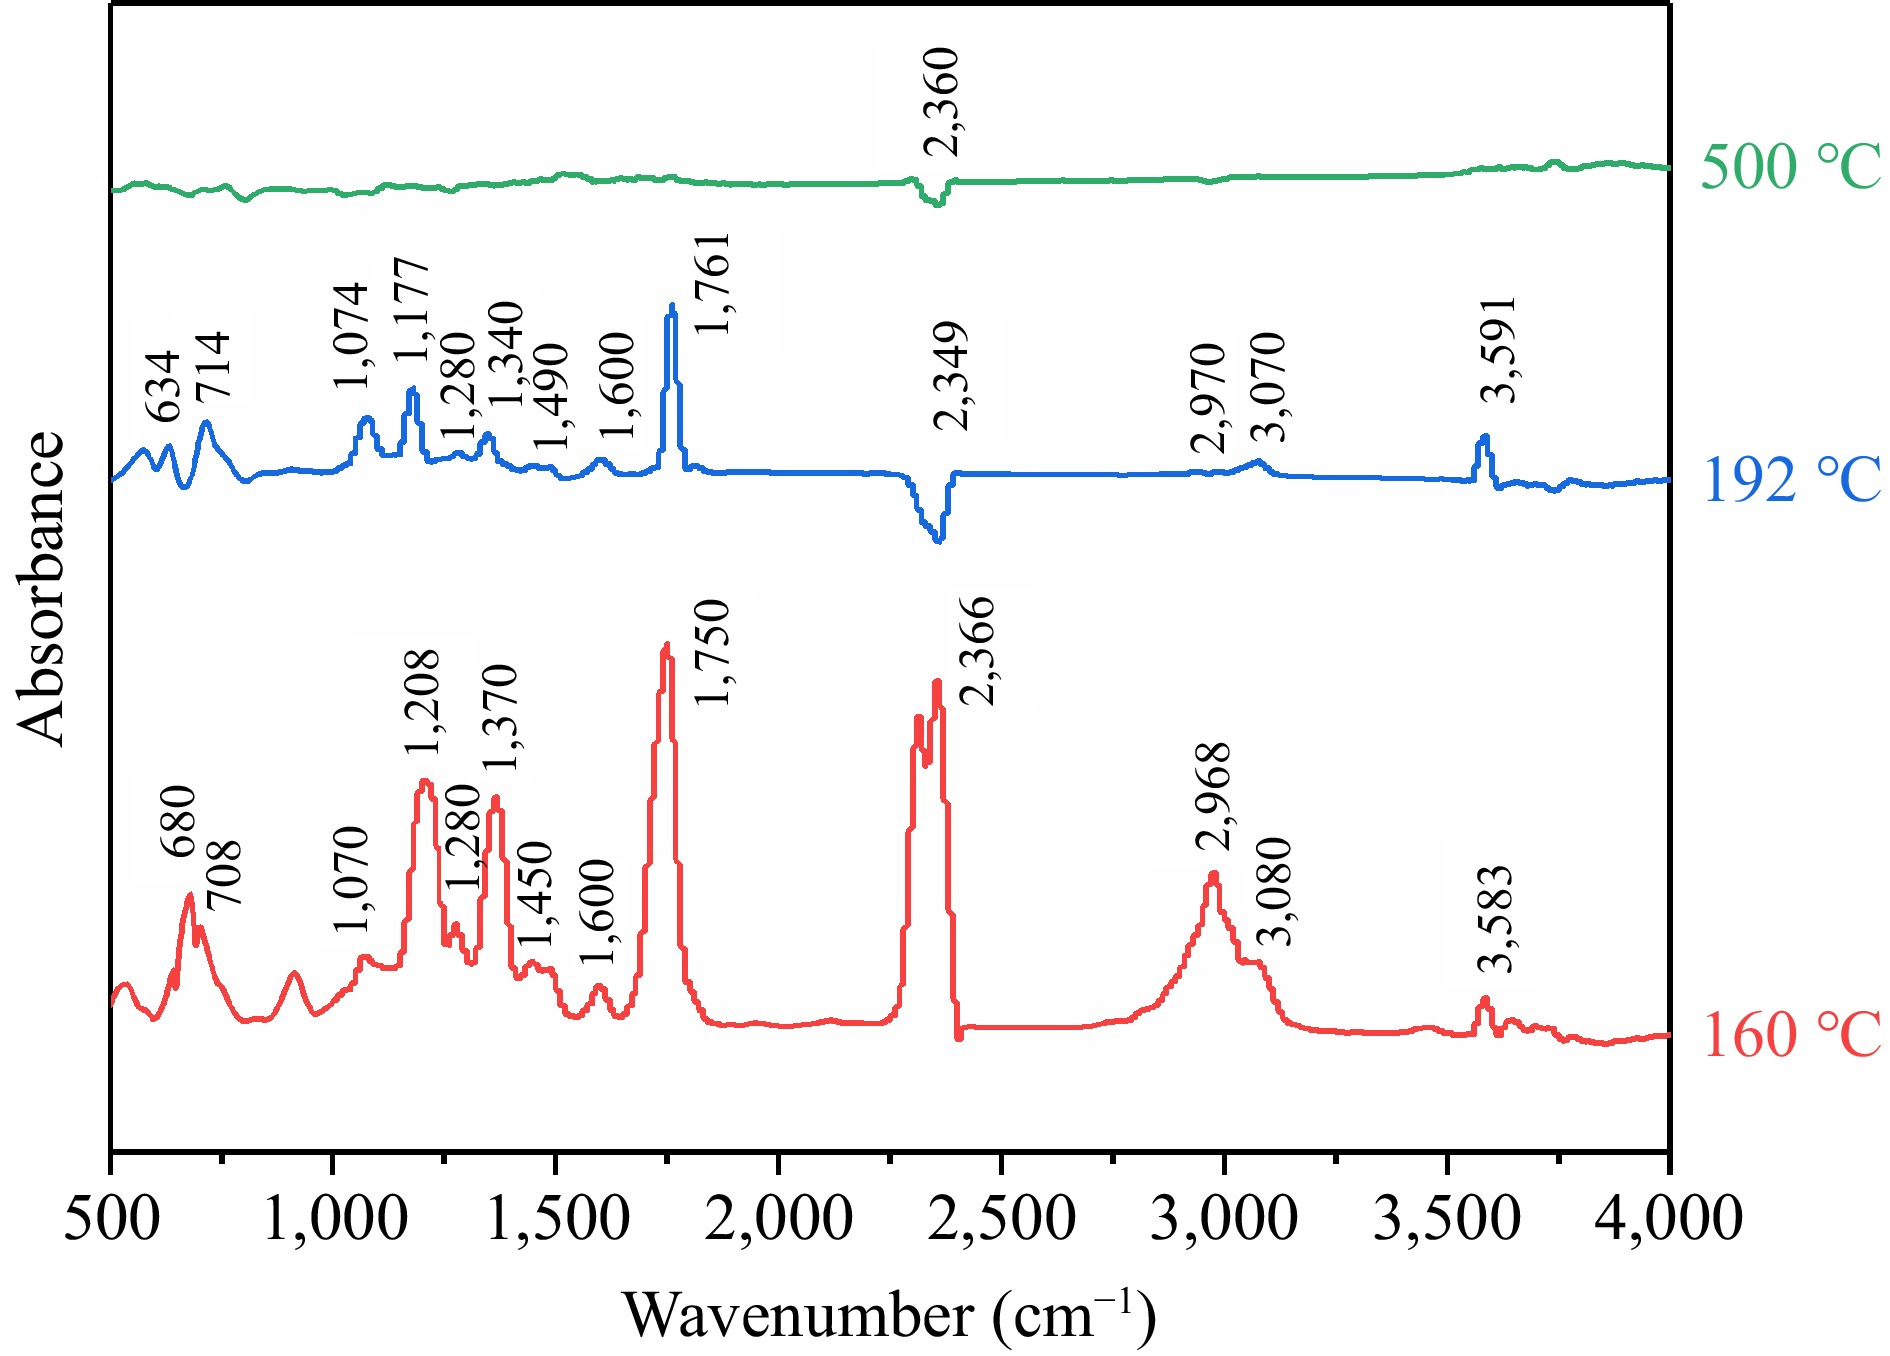
Figure 8.
The infrared spectrogram of TBPB decomposition products.
-
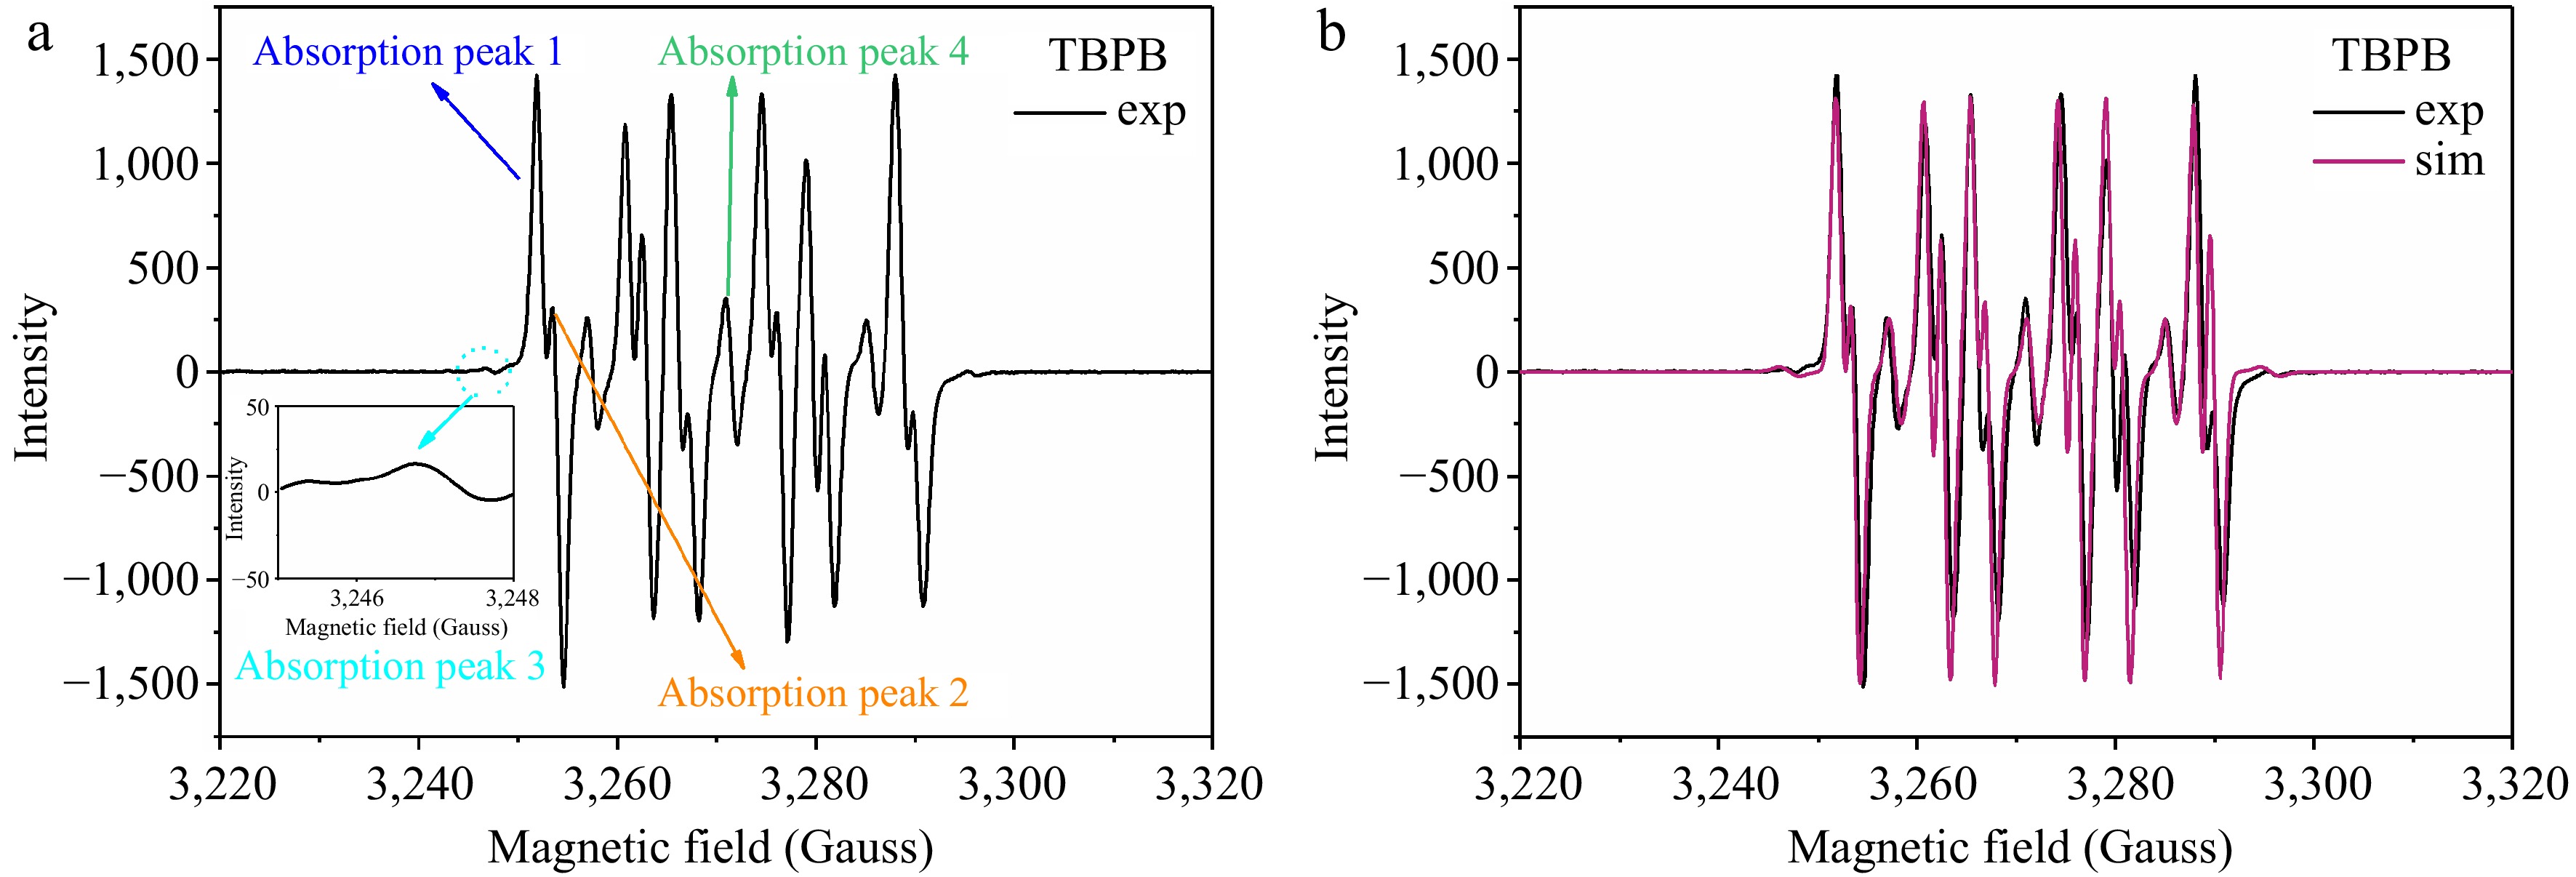
Figure 9.
EPR experimental and simulated spectra of TBPB decomposition radicals captured by DMPO.
-
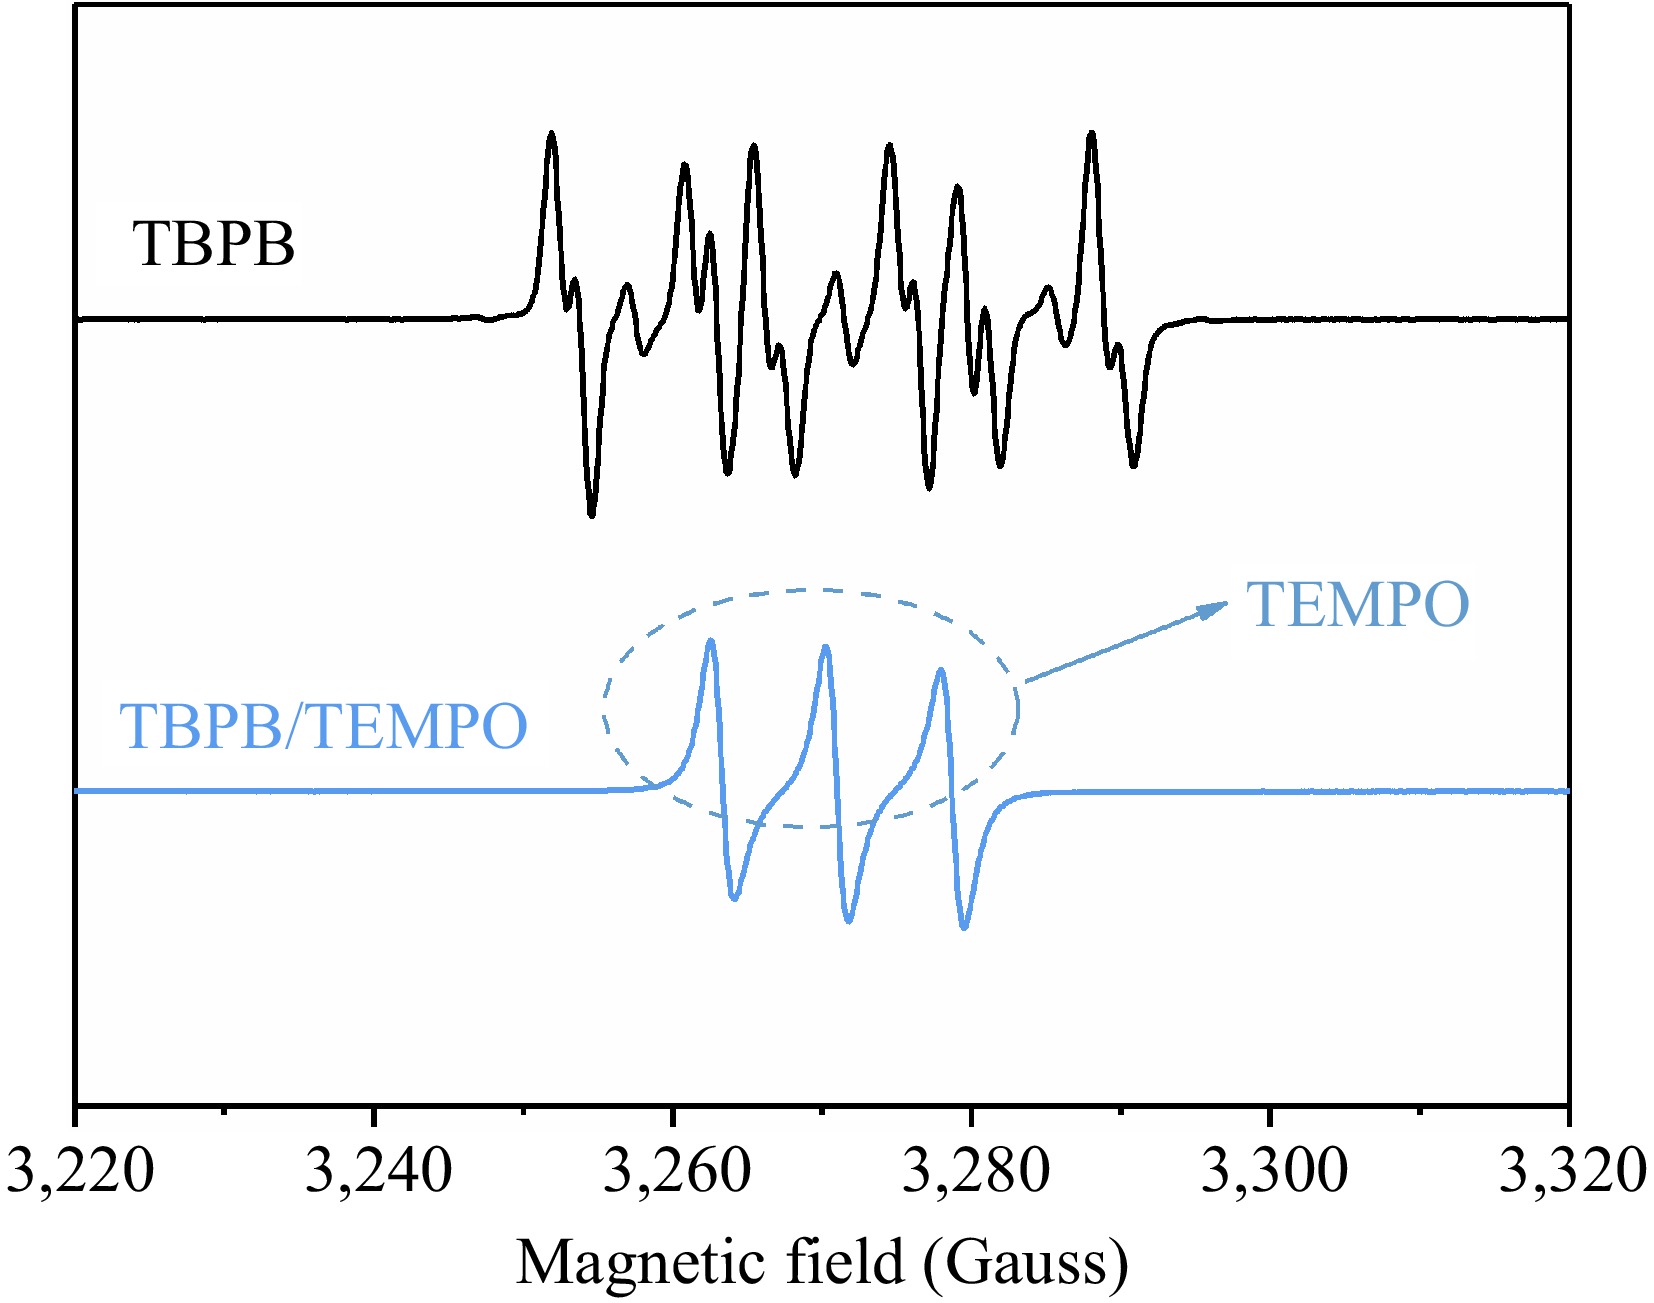
Figure 10.
Comparison of EPR spectra of TBPB before and after adding the inhibitor (TEMPO).
-
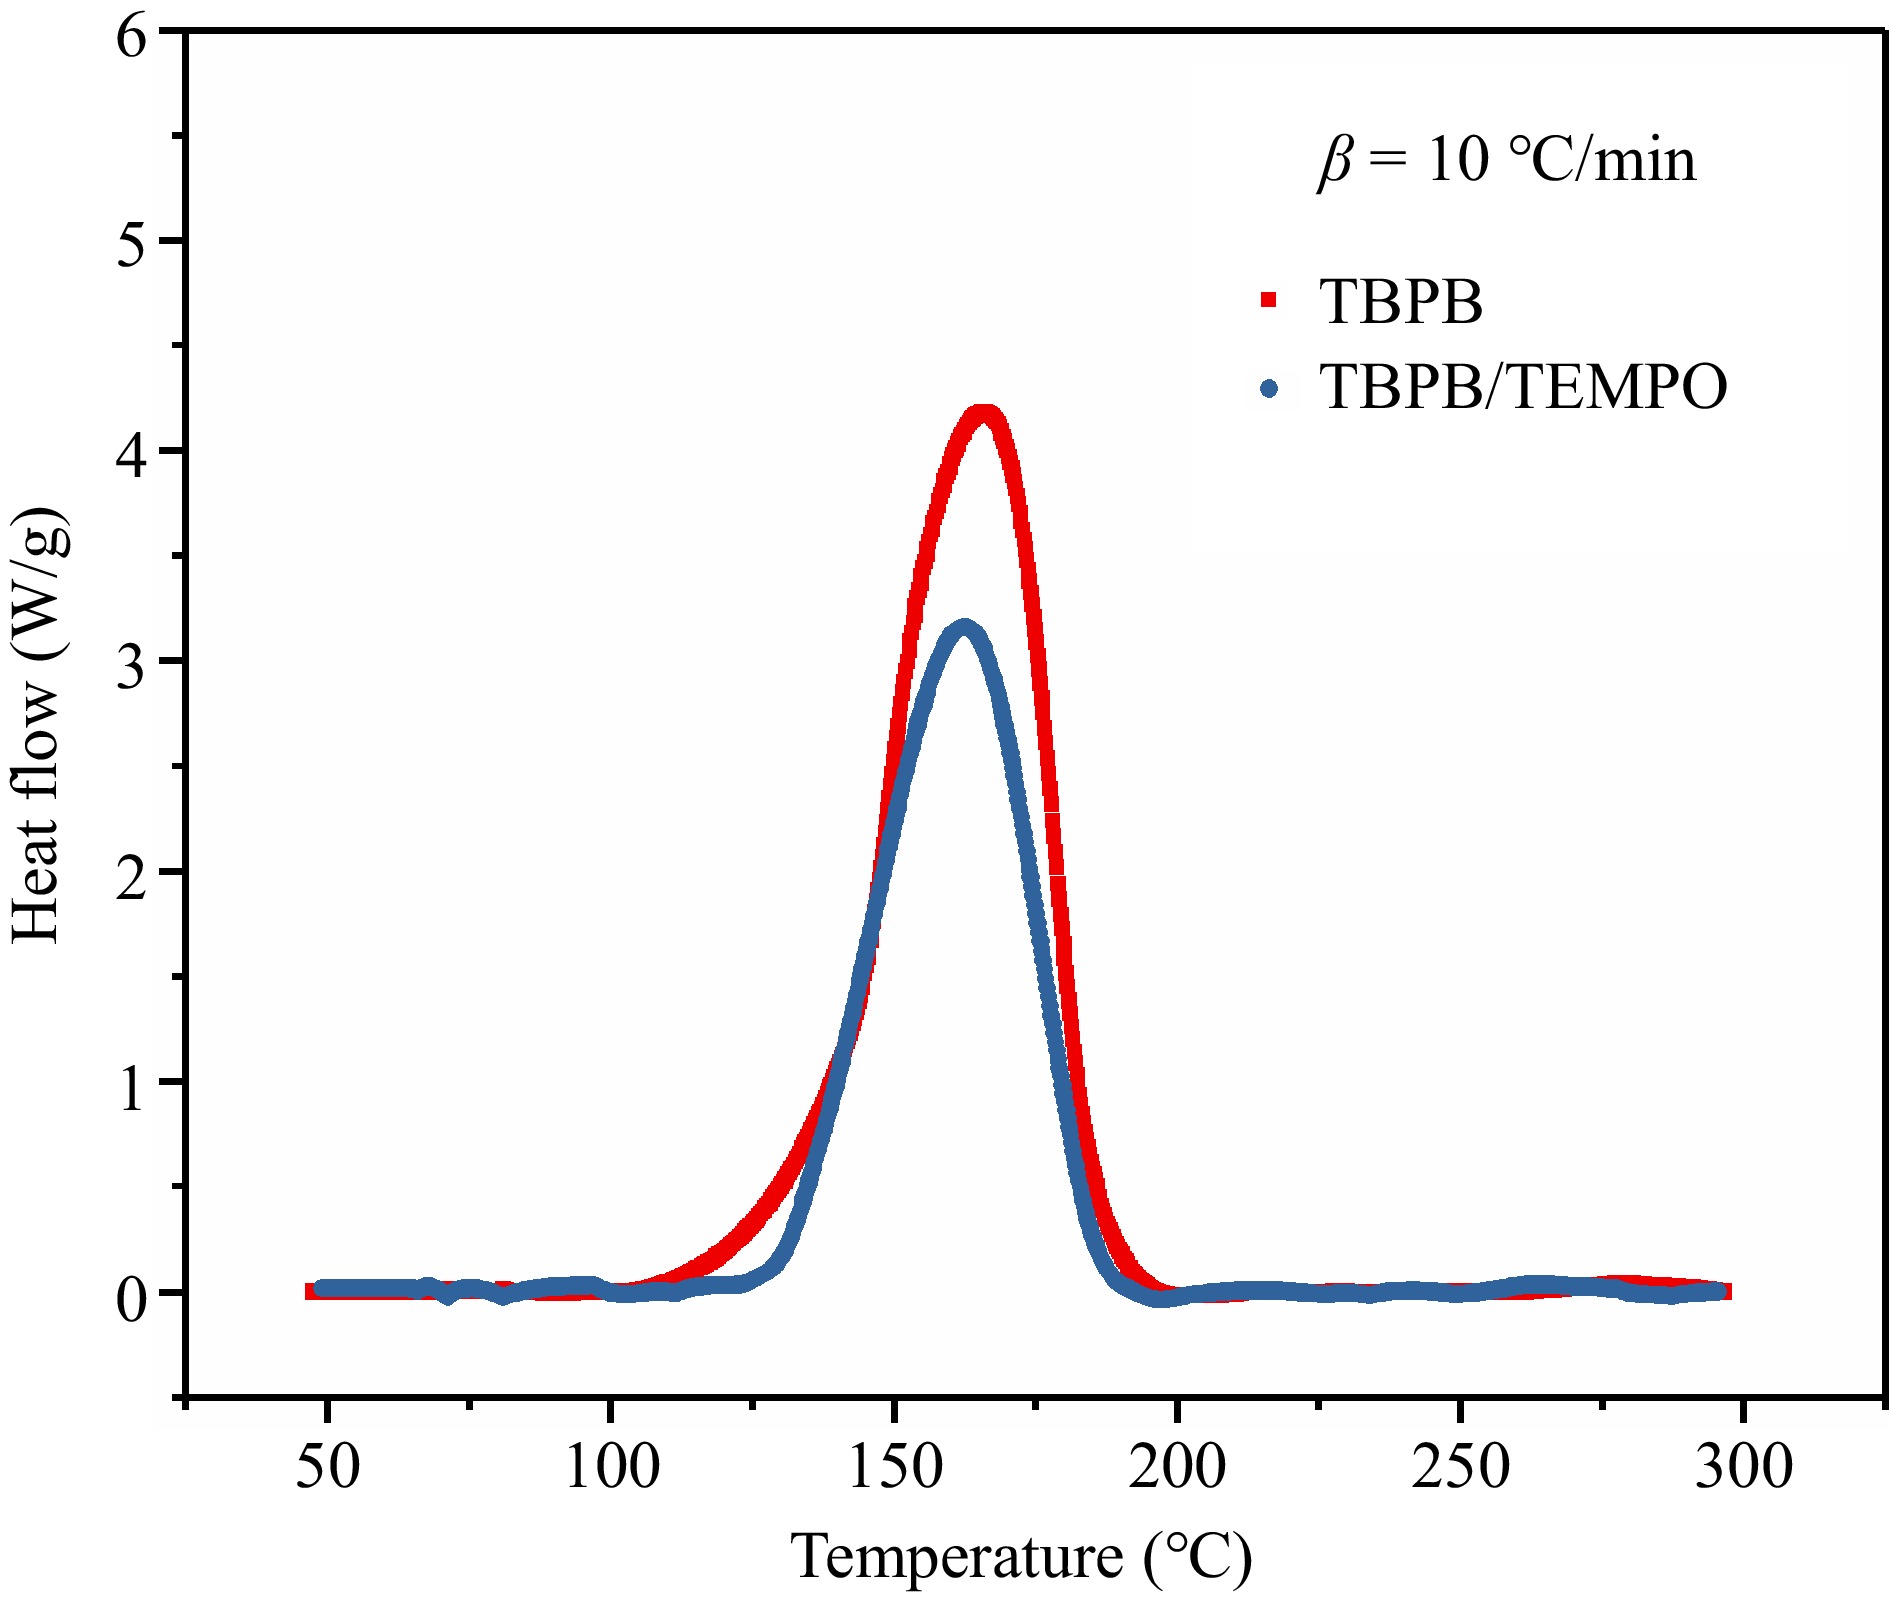
Figure 11.
Comparison of thermal decomposition behaviors before and after adding the inhibitor (TEMPO).
-
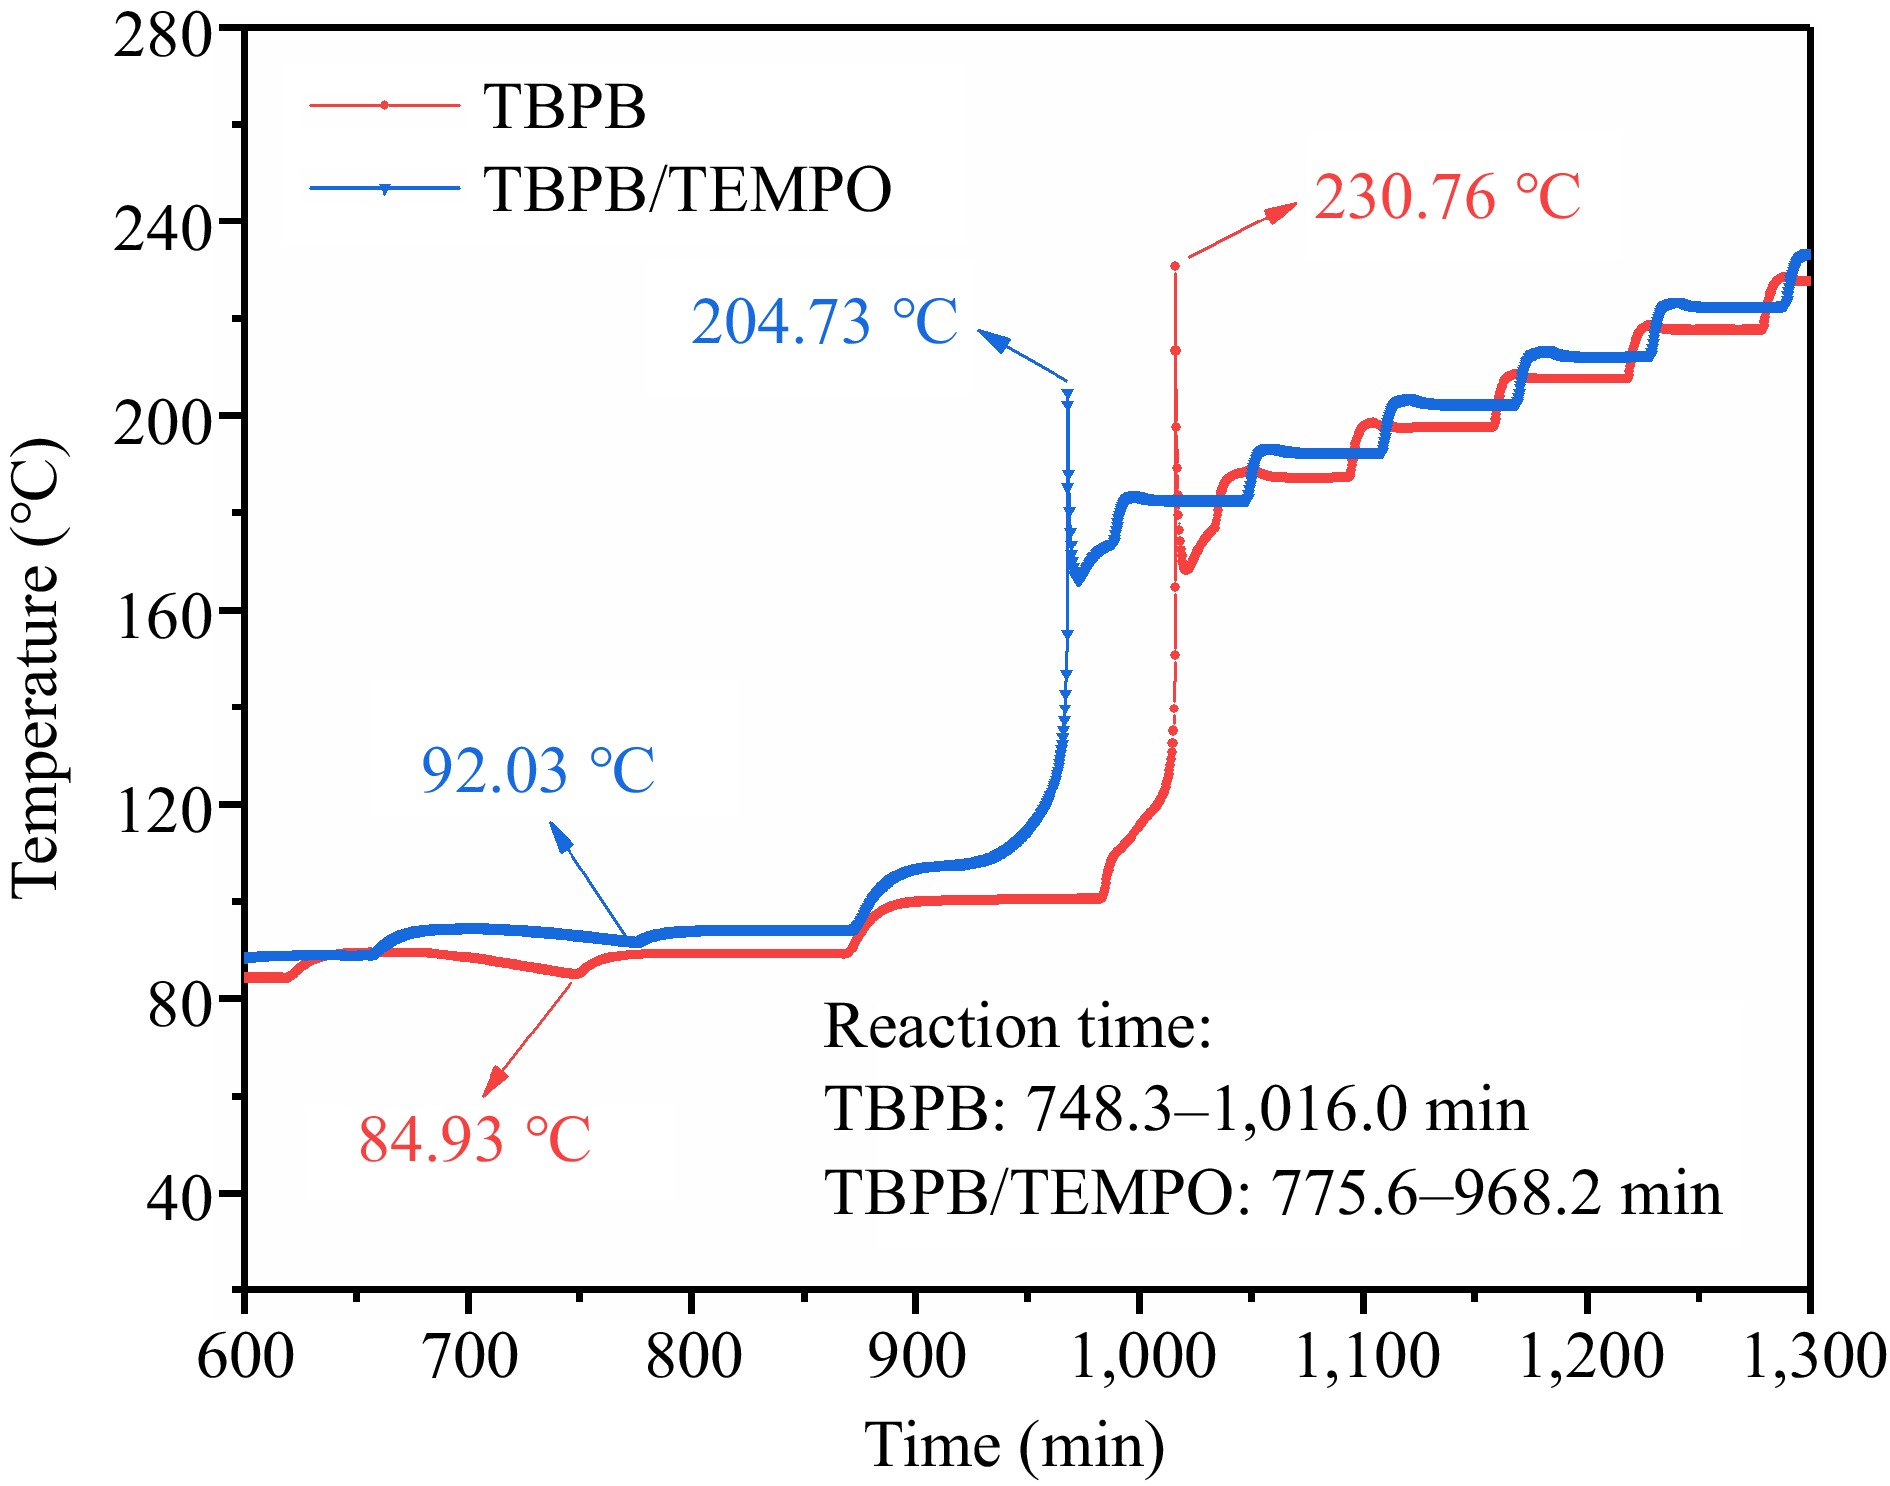
Figure 12.
Comparison of the adiabatic temperature rises before and after adding the inhibitor (TEMPO).
-
Parameters Kinetic methods Average values KAS FWO Starink $\overline E_{\rm a} $ 96.80 98.72 97.14 97.55 $\overline R^2 $ 0.9636 0.9681 0.9641 0.9653 Table 1.
Ea values of TBPB obtained through three kinetic methods.
-
Absorption
peaksFree radical attribution giso AN
(Gauss)AH
(Gauss)1 Alkoxy 1 2.0081 13.63 8.91 2 Alkoxy 2 2.0072 13.63 9.12 3 Alkyl 2.0075 14.06 20.49 4 The oxide of DMPO 2.0073 13.95 – −: Not applicable. Table 2.
Characterization parameters of the resonance absorption peaks of TBPB decomposition radicals captured by DMPO.
-
Samples To (°C) Tp (°C) ΔH (J/g) TBPB 100.93 165.60 865.87 TBPB/TEMPO 128.65 162.49 585.00 Table 3.
Comparison of the TBPB thermal decomposition parameters before and after adding inhibitor (TEMPO).
-
Samples Toad
(°C)Tfad
(°C)ΔTad
(°C)ΔTad*
(°C)Poad
(MPa)Pfad
(MPa)ΔPad
(MPa)ΔHad
(J/g)TBPB 84.93 230.76 145.83 193.17 0.20 1.81 1.61 1989.65 TBPB/TEMPO 92.03 204.73 112.70 149.25 0.28 1.46 1.18 1537.29 Table 4.
Comparison of TBPB's ARC experiment results before and after adding inhibitor (TEMPO).
Figures
(12)
Tables
(4)