-
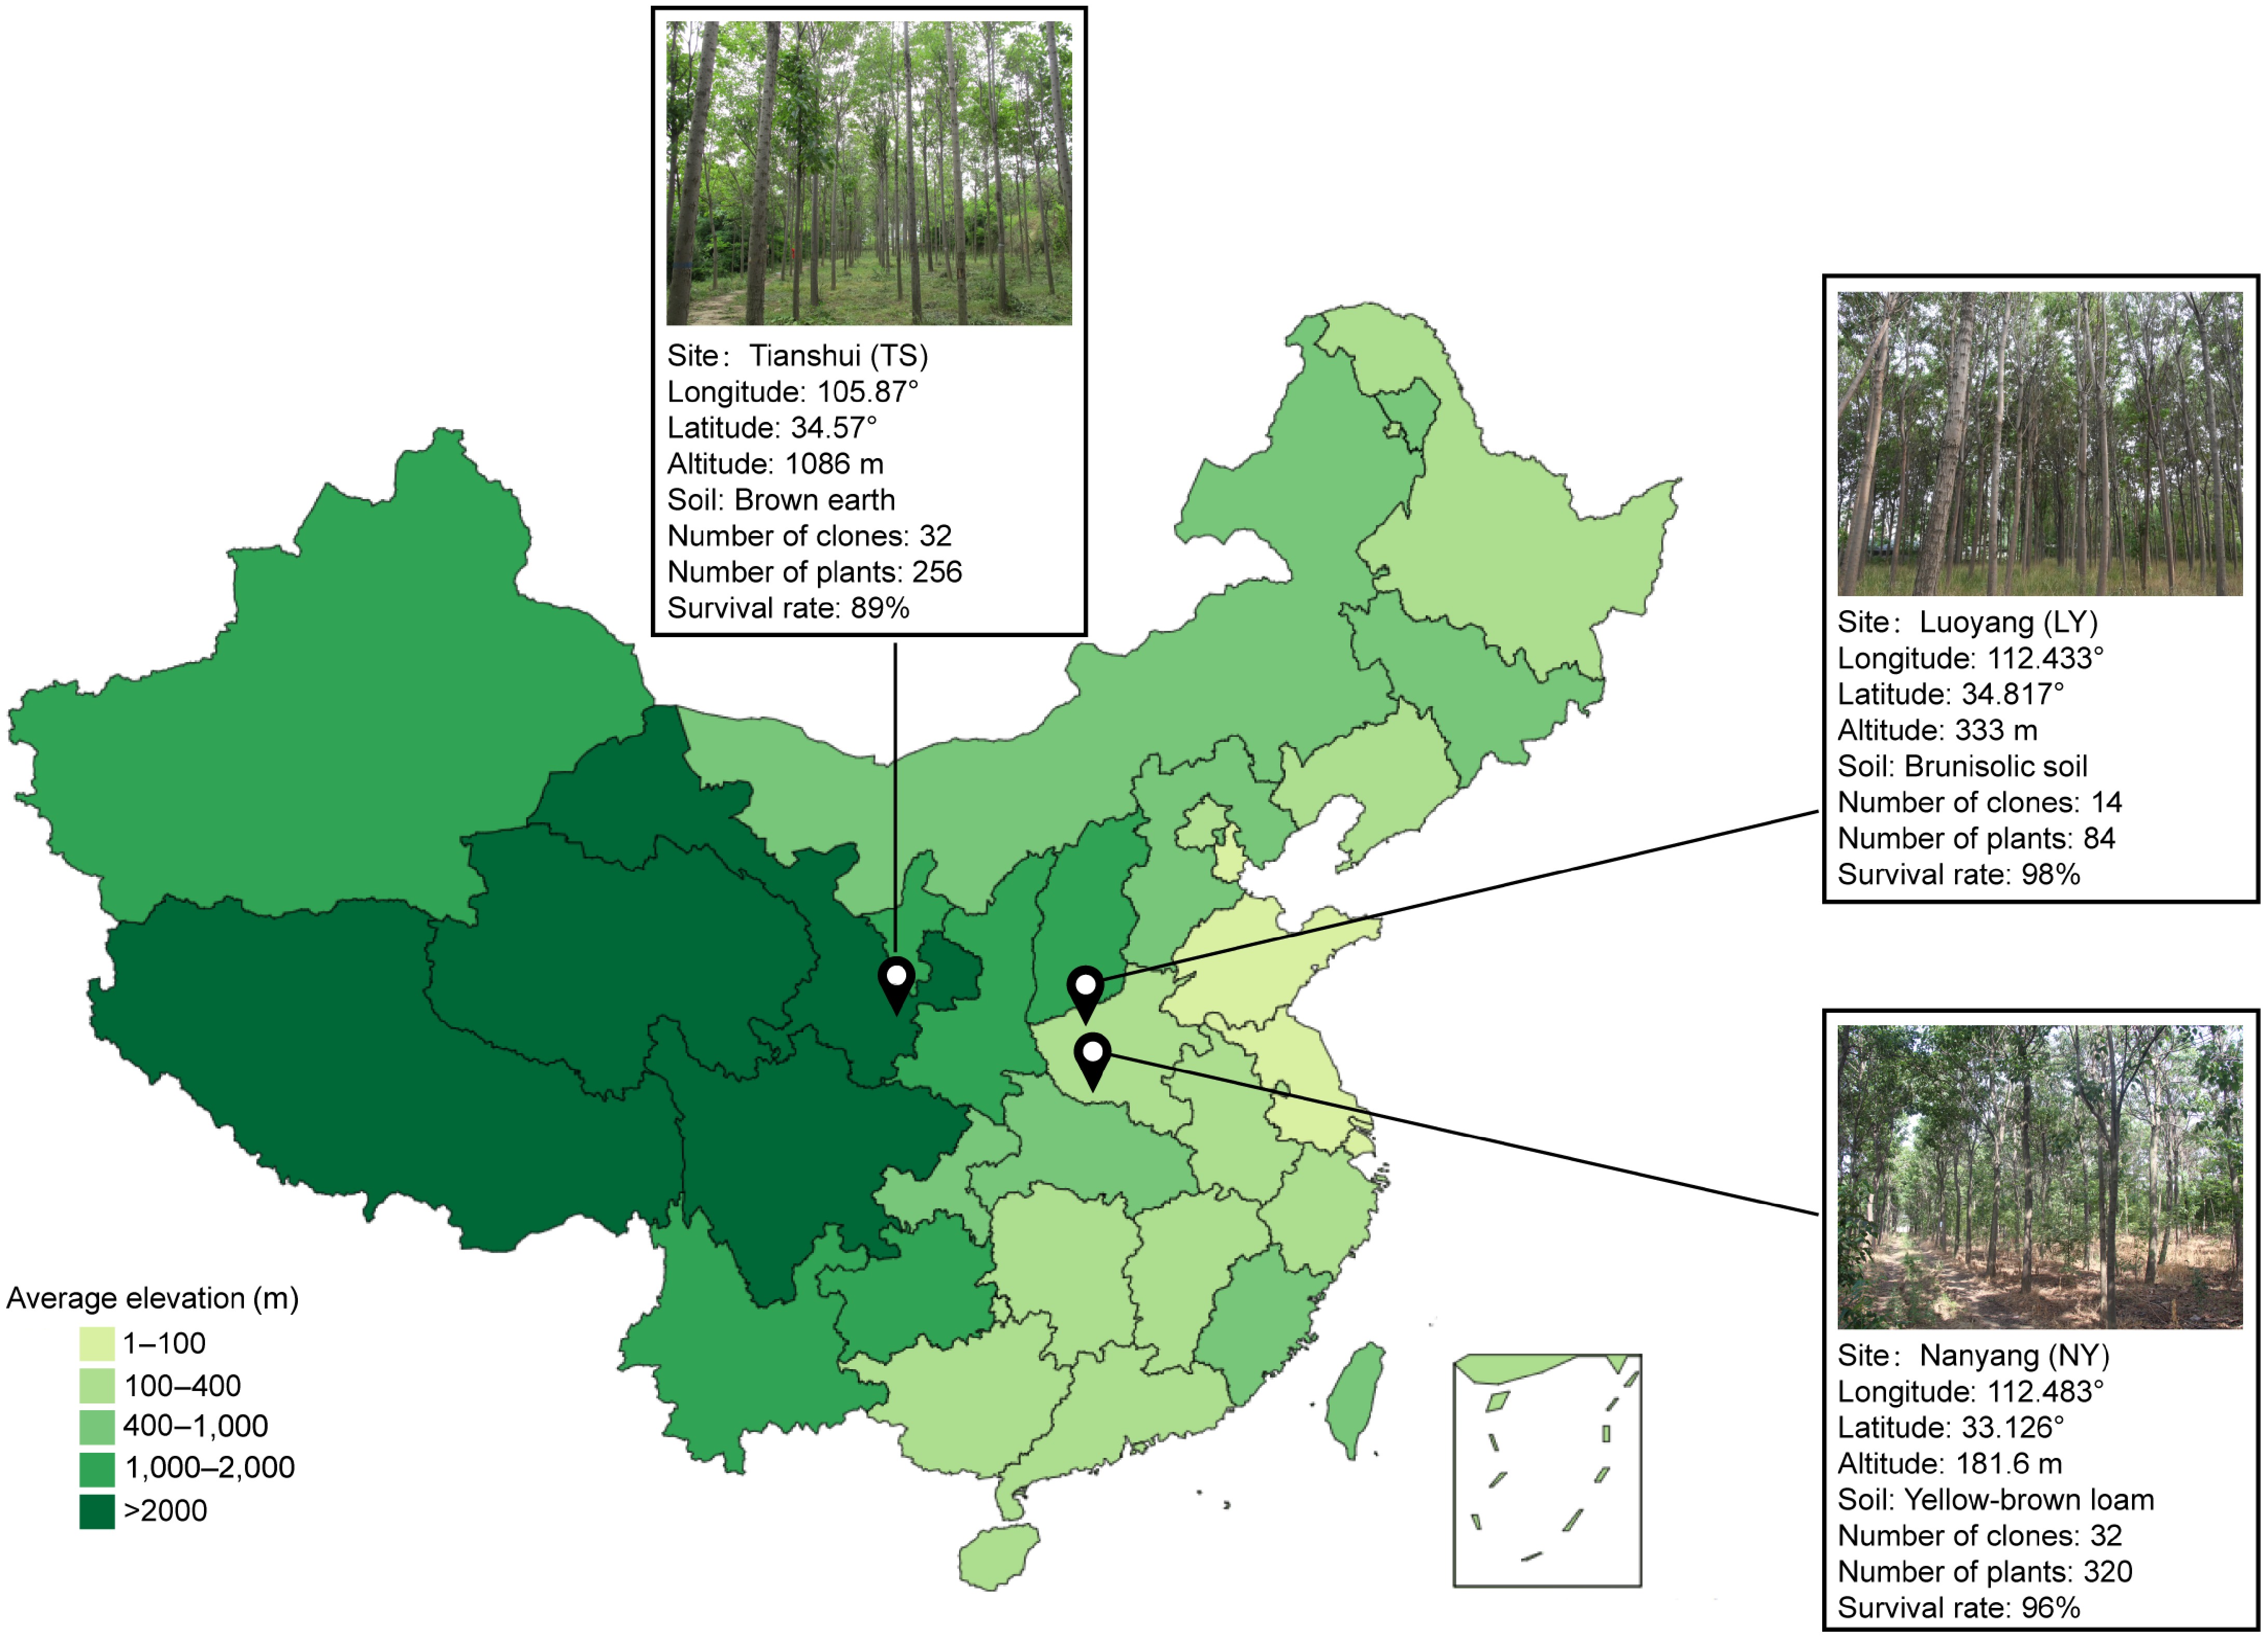
Figure 1.
The geographical location and basic information of the three test forests.
-
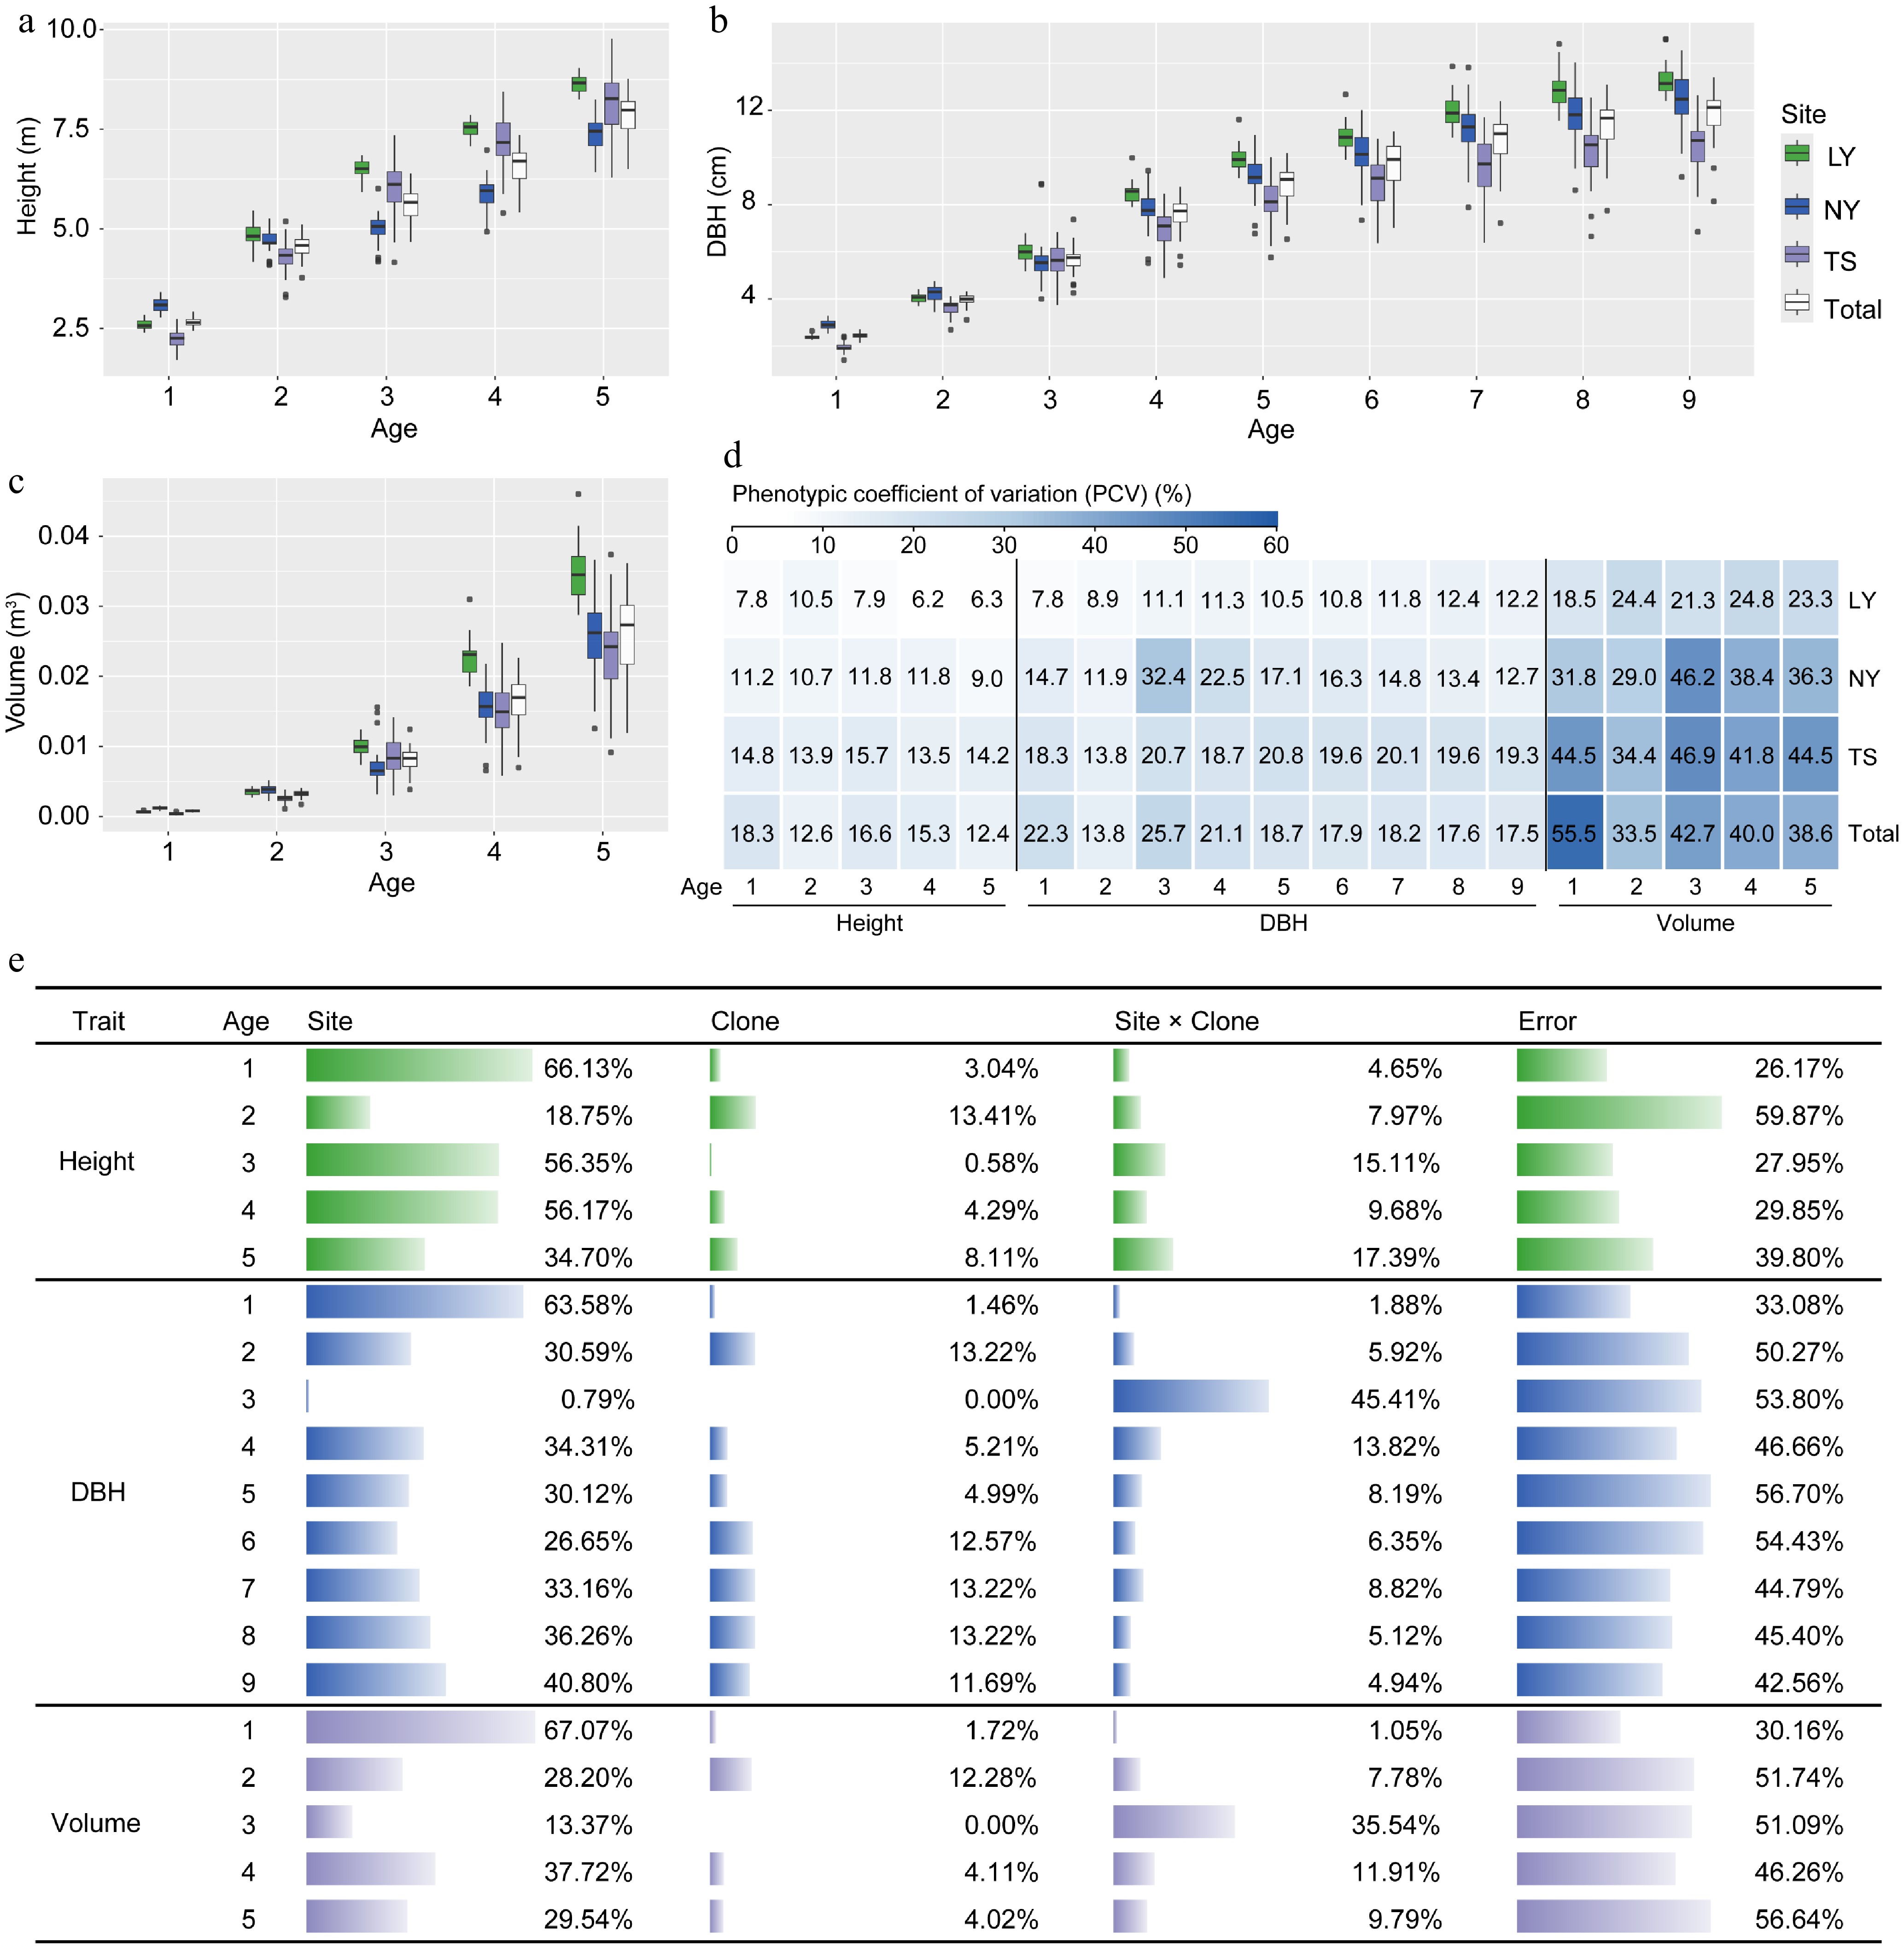
Figure 2.
Analysis of variation in growth traits of clones under different environments. (a)−(c) Comparative differences in tree height, DBH, and volume among clones in the LY, NY, TS, and across three sites. (d) Phenotypic variation coefficients of clonal growth traits. (e) Analysis of the proportion of variance components influenced by environmental (Site), genetic (Clone), and G × E (Site × Clone) effects on clonal growth traits.
-
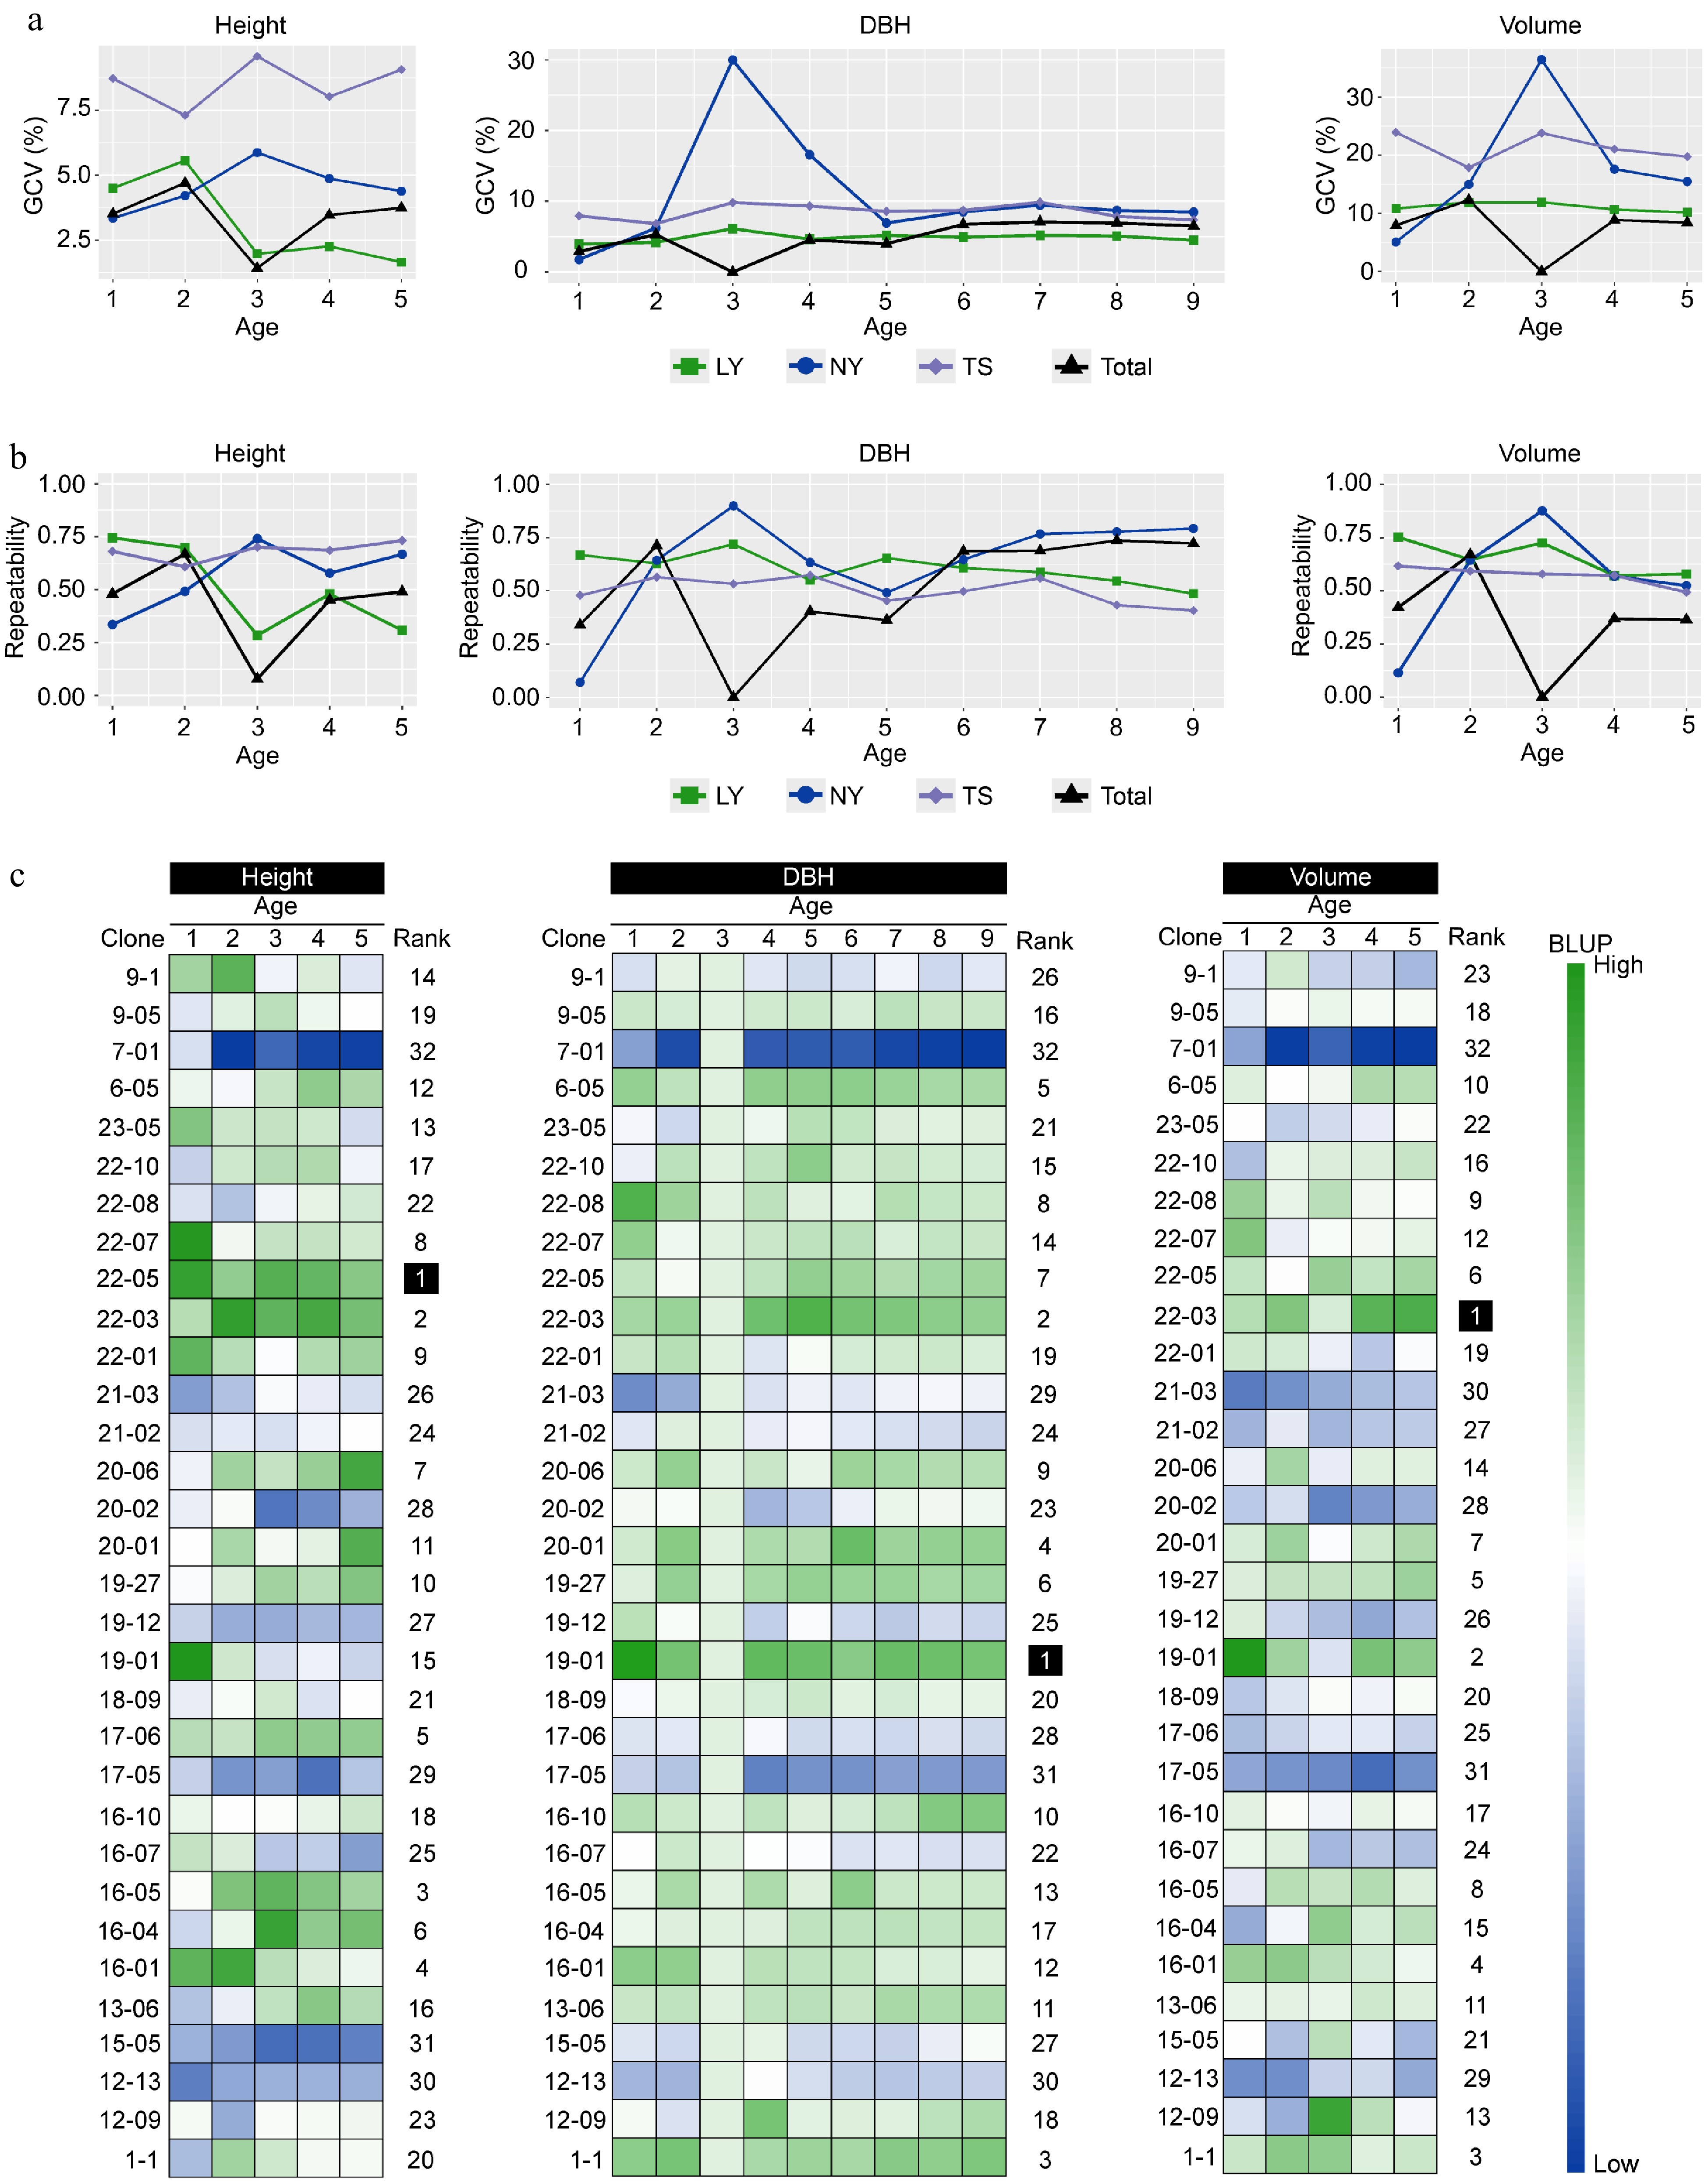
Figure 3.
The impact of genetic effects on the growth of clones. (a) The genetic variation coefficients of multi-year growth traits of clones in different regions. (b) The repeatability of multi-year growth traits of clones in different regions. (c) The BLUP values of clonal growth traits estimated by the multi-site mixed-effects model, with Rank representing the comprehensive ranking of the membership function for a single trait's multi-year BLUP values of the same clone.
-
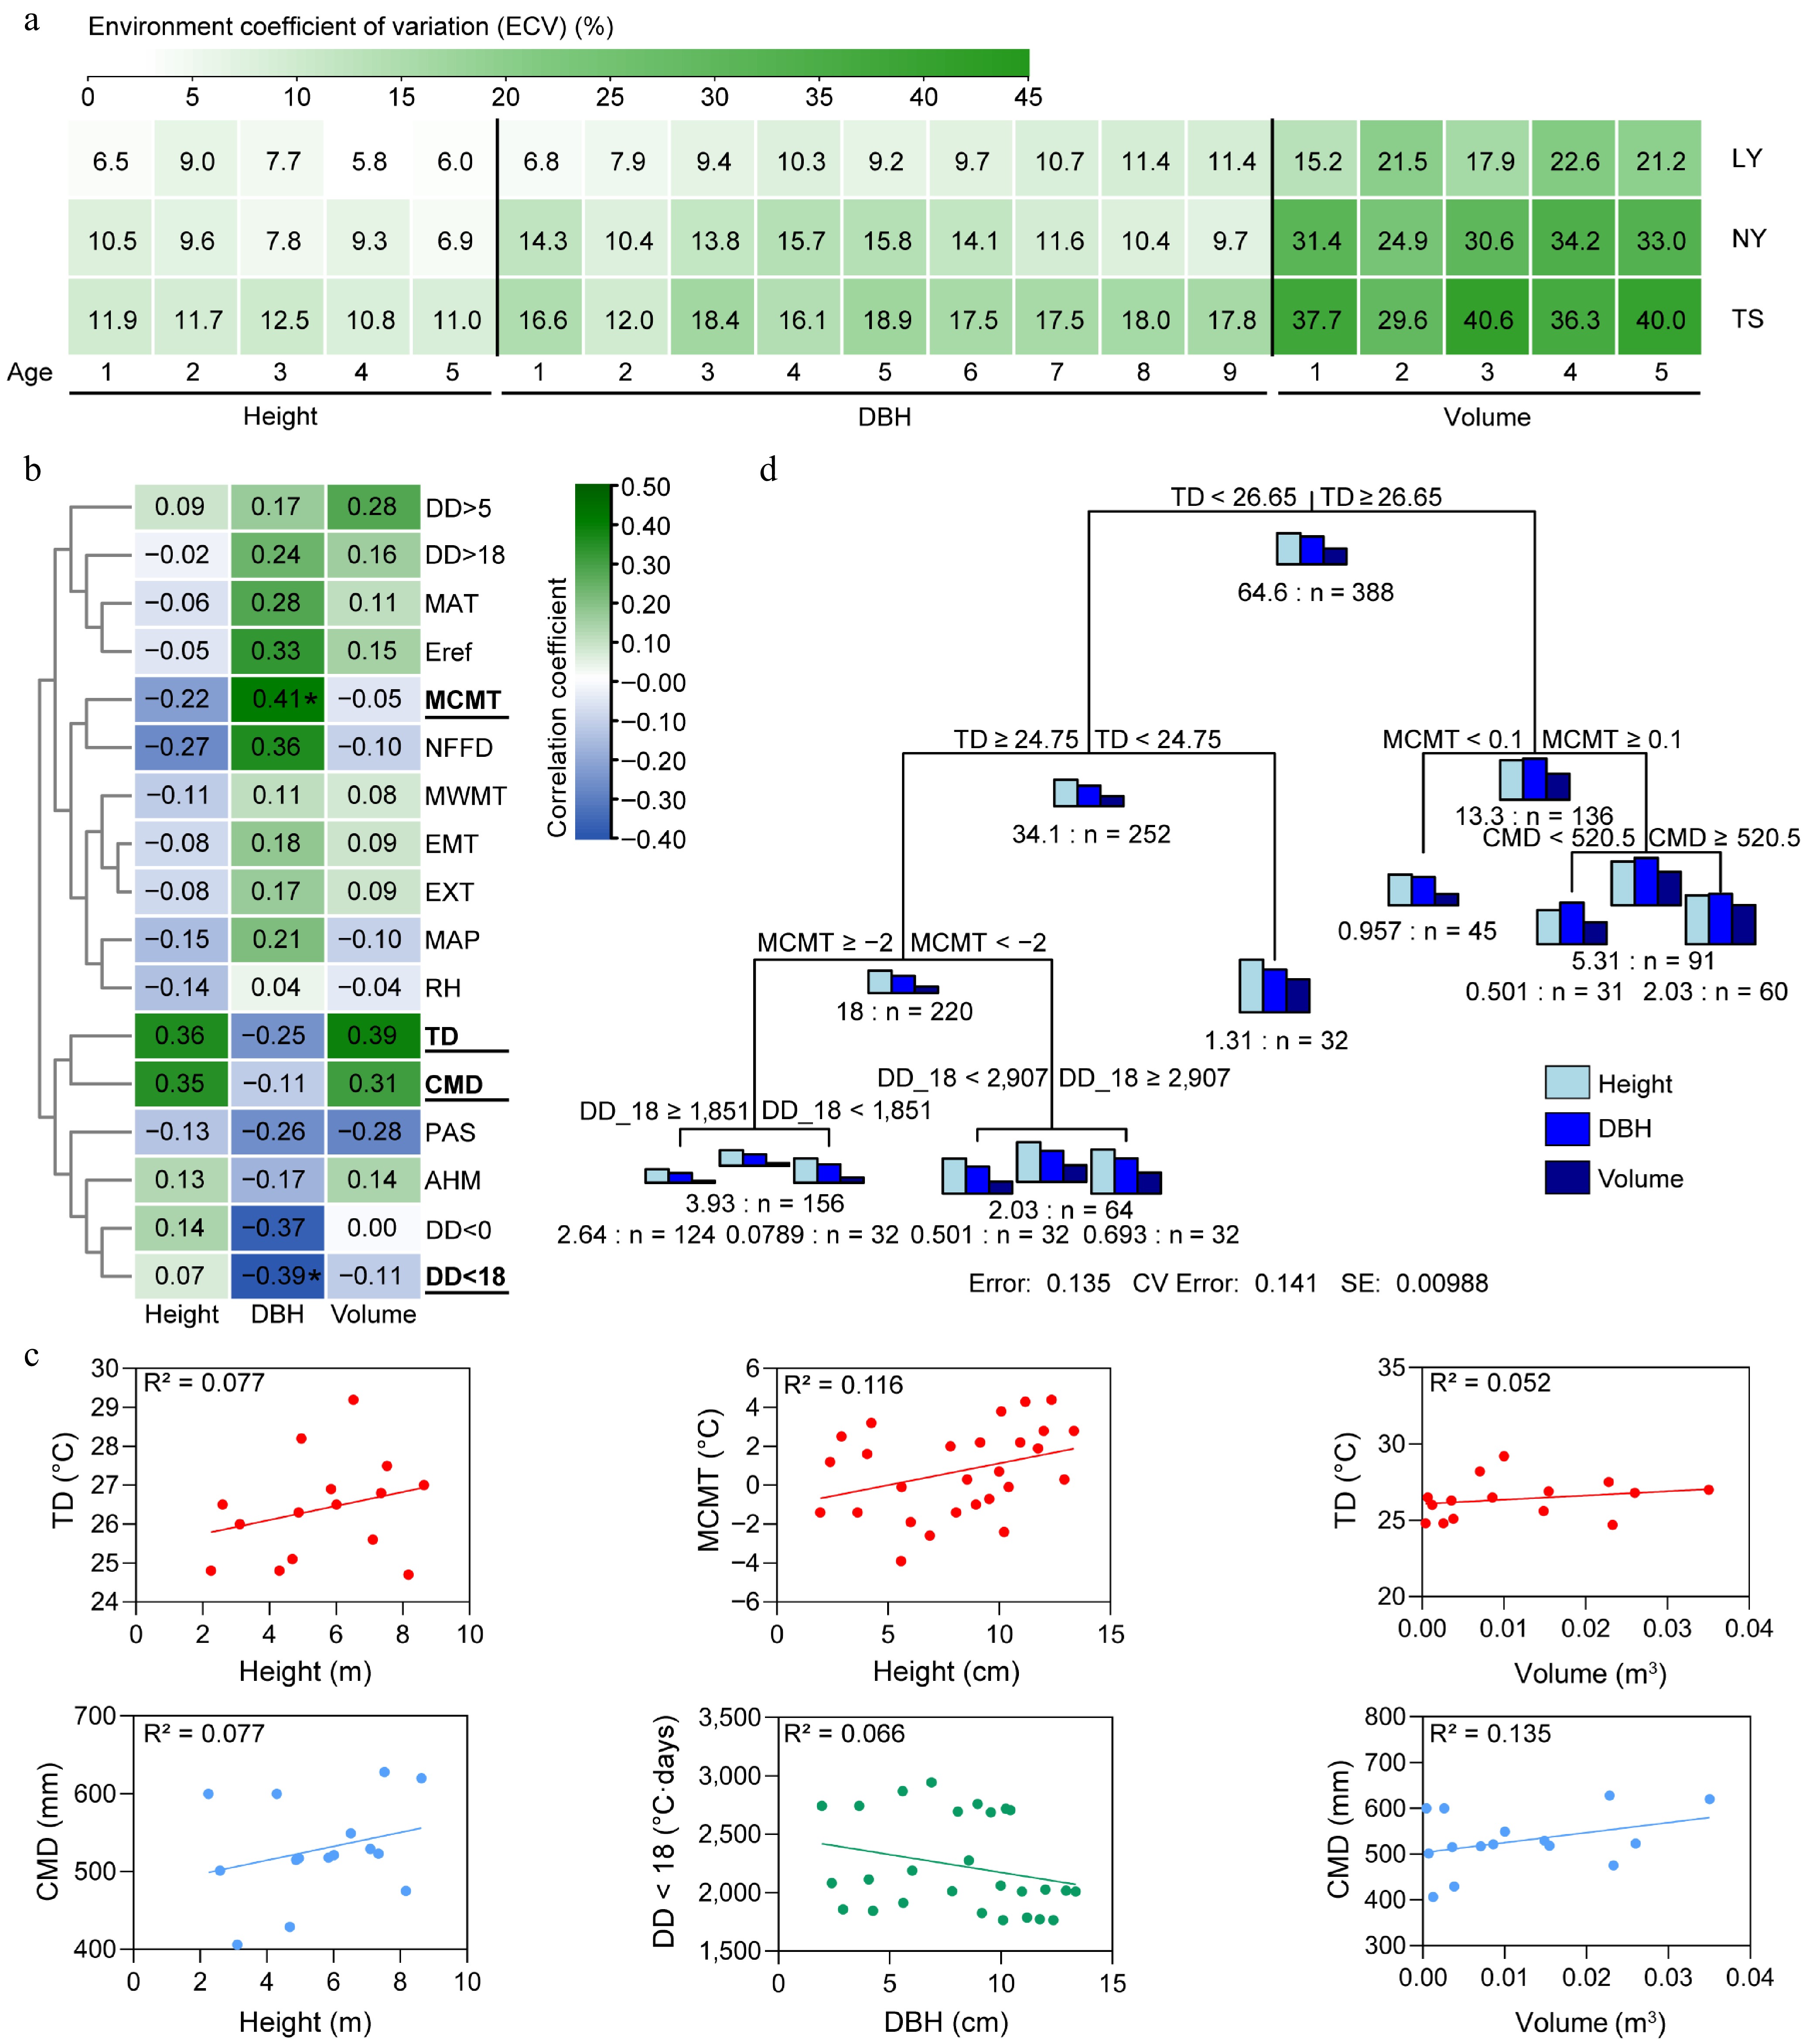
Figure 4.
The impact of environment on the growth of clones. (a) Environmental variation coefficients of clonal growth across multiple years and sites. (b) Spearman correlation coefficients between environmental factors and growth traits. (c) Linear regression analysis of height, DBH, and volume with key environmental factors. (d) Multivariate regression tree analysis (MRT) of the comprehensive impact of the environment on the tree height, DBH, and volume of clones, with the number preceding 'n' indicating the sum of squared distances for the parameter, and 'n' representing the number of individuals in the subclass. MAT: Mean annual temperature (°C); MWMT: Mean warmest month temperature (°C); MCMT: Mean coldest month temperature (°C); TD: Temperature difference between MWMT and MCMT, or continentality (°C); MAP: Mean annual precipitation (mm); AHM: Annual heat/moisture index (MAT+10)/(MAP/1,000)); DD < 0: Degree-days below 0°C, chilling degree-days; DD > 5: Degree-days above 5 °C, growing degree-days; DD < 18: Degree-days below 18 °C, heating degree-days; DD > 18 Degree-days above 18 °C, cooling degree-days; NFFD: The number of frost-free days; PAS: Precipitation as snow between August in the previous year and July in current year (mm); EMT: Extreme minimum temperature over 30 years (°C); EXT: Extreme maximum temperature over 30 years (°C); Eref: Hargreaves reference evaporation (mm); CMD: Hargreaves climatic moisture deficit (mm); RH: Relative humidity (%).
-
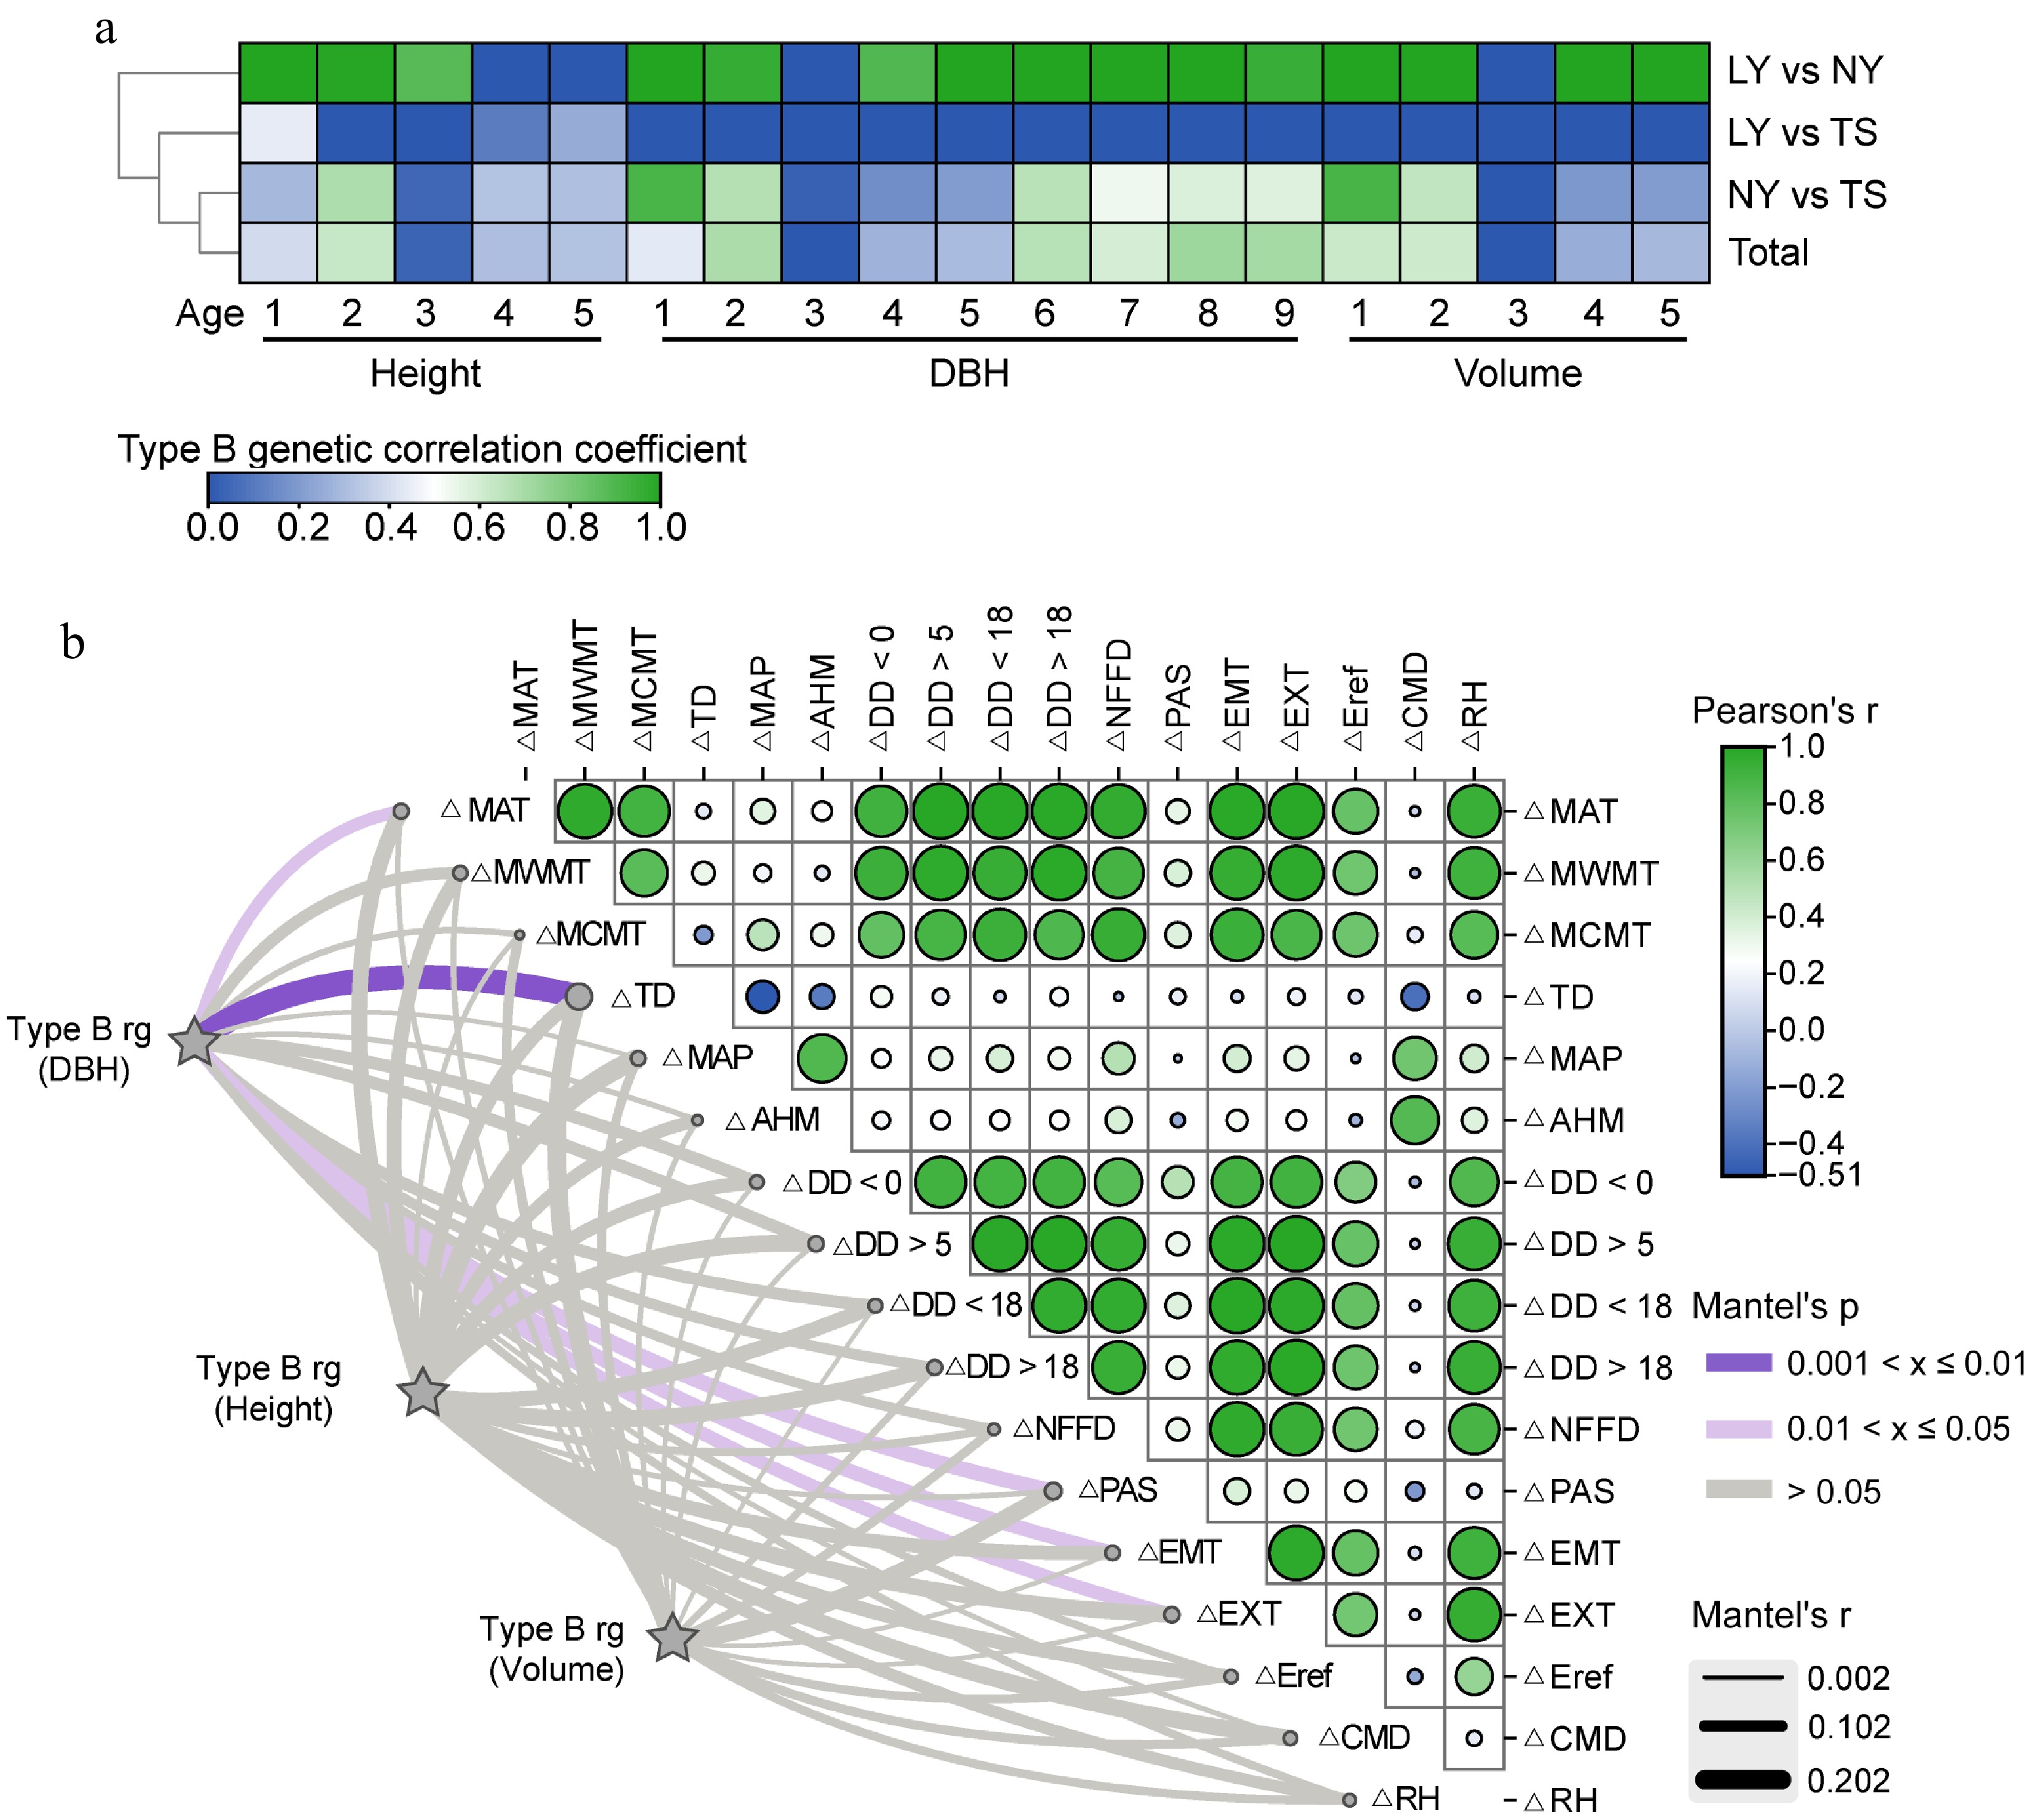
Figure 5.
Analysis of the driving effect of environmental factors on G × E of growth traits. (a) B-type genetic correlations of multi-year growth traits of clones between different sites. (b) Mantel correlation analysis between B-type genetic correlations of growth traits and changes in environmental factors, with stronger correlations indicating a stronger driving effect of environmental factors on G × E effects of growth traits.
-
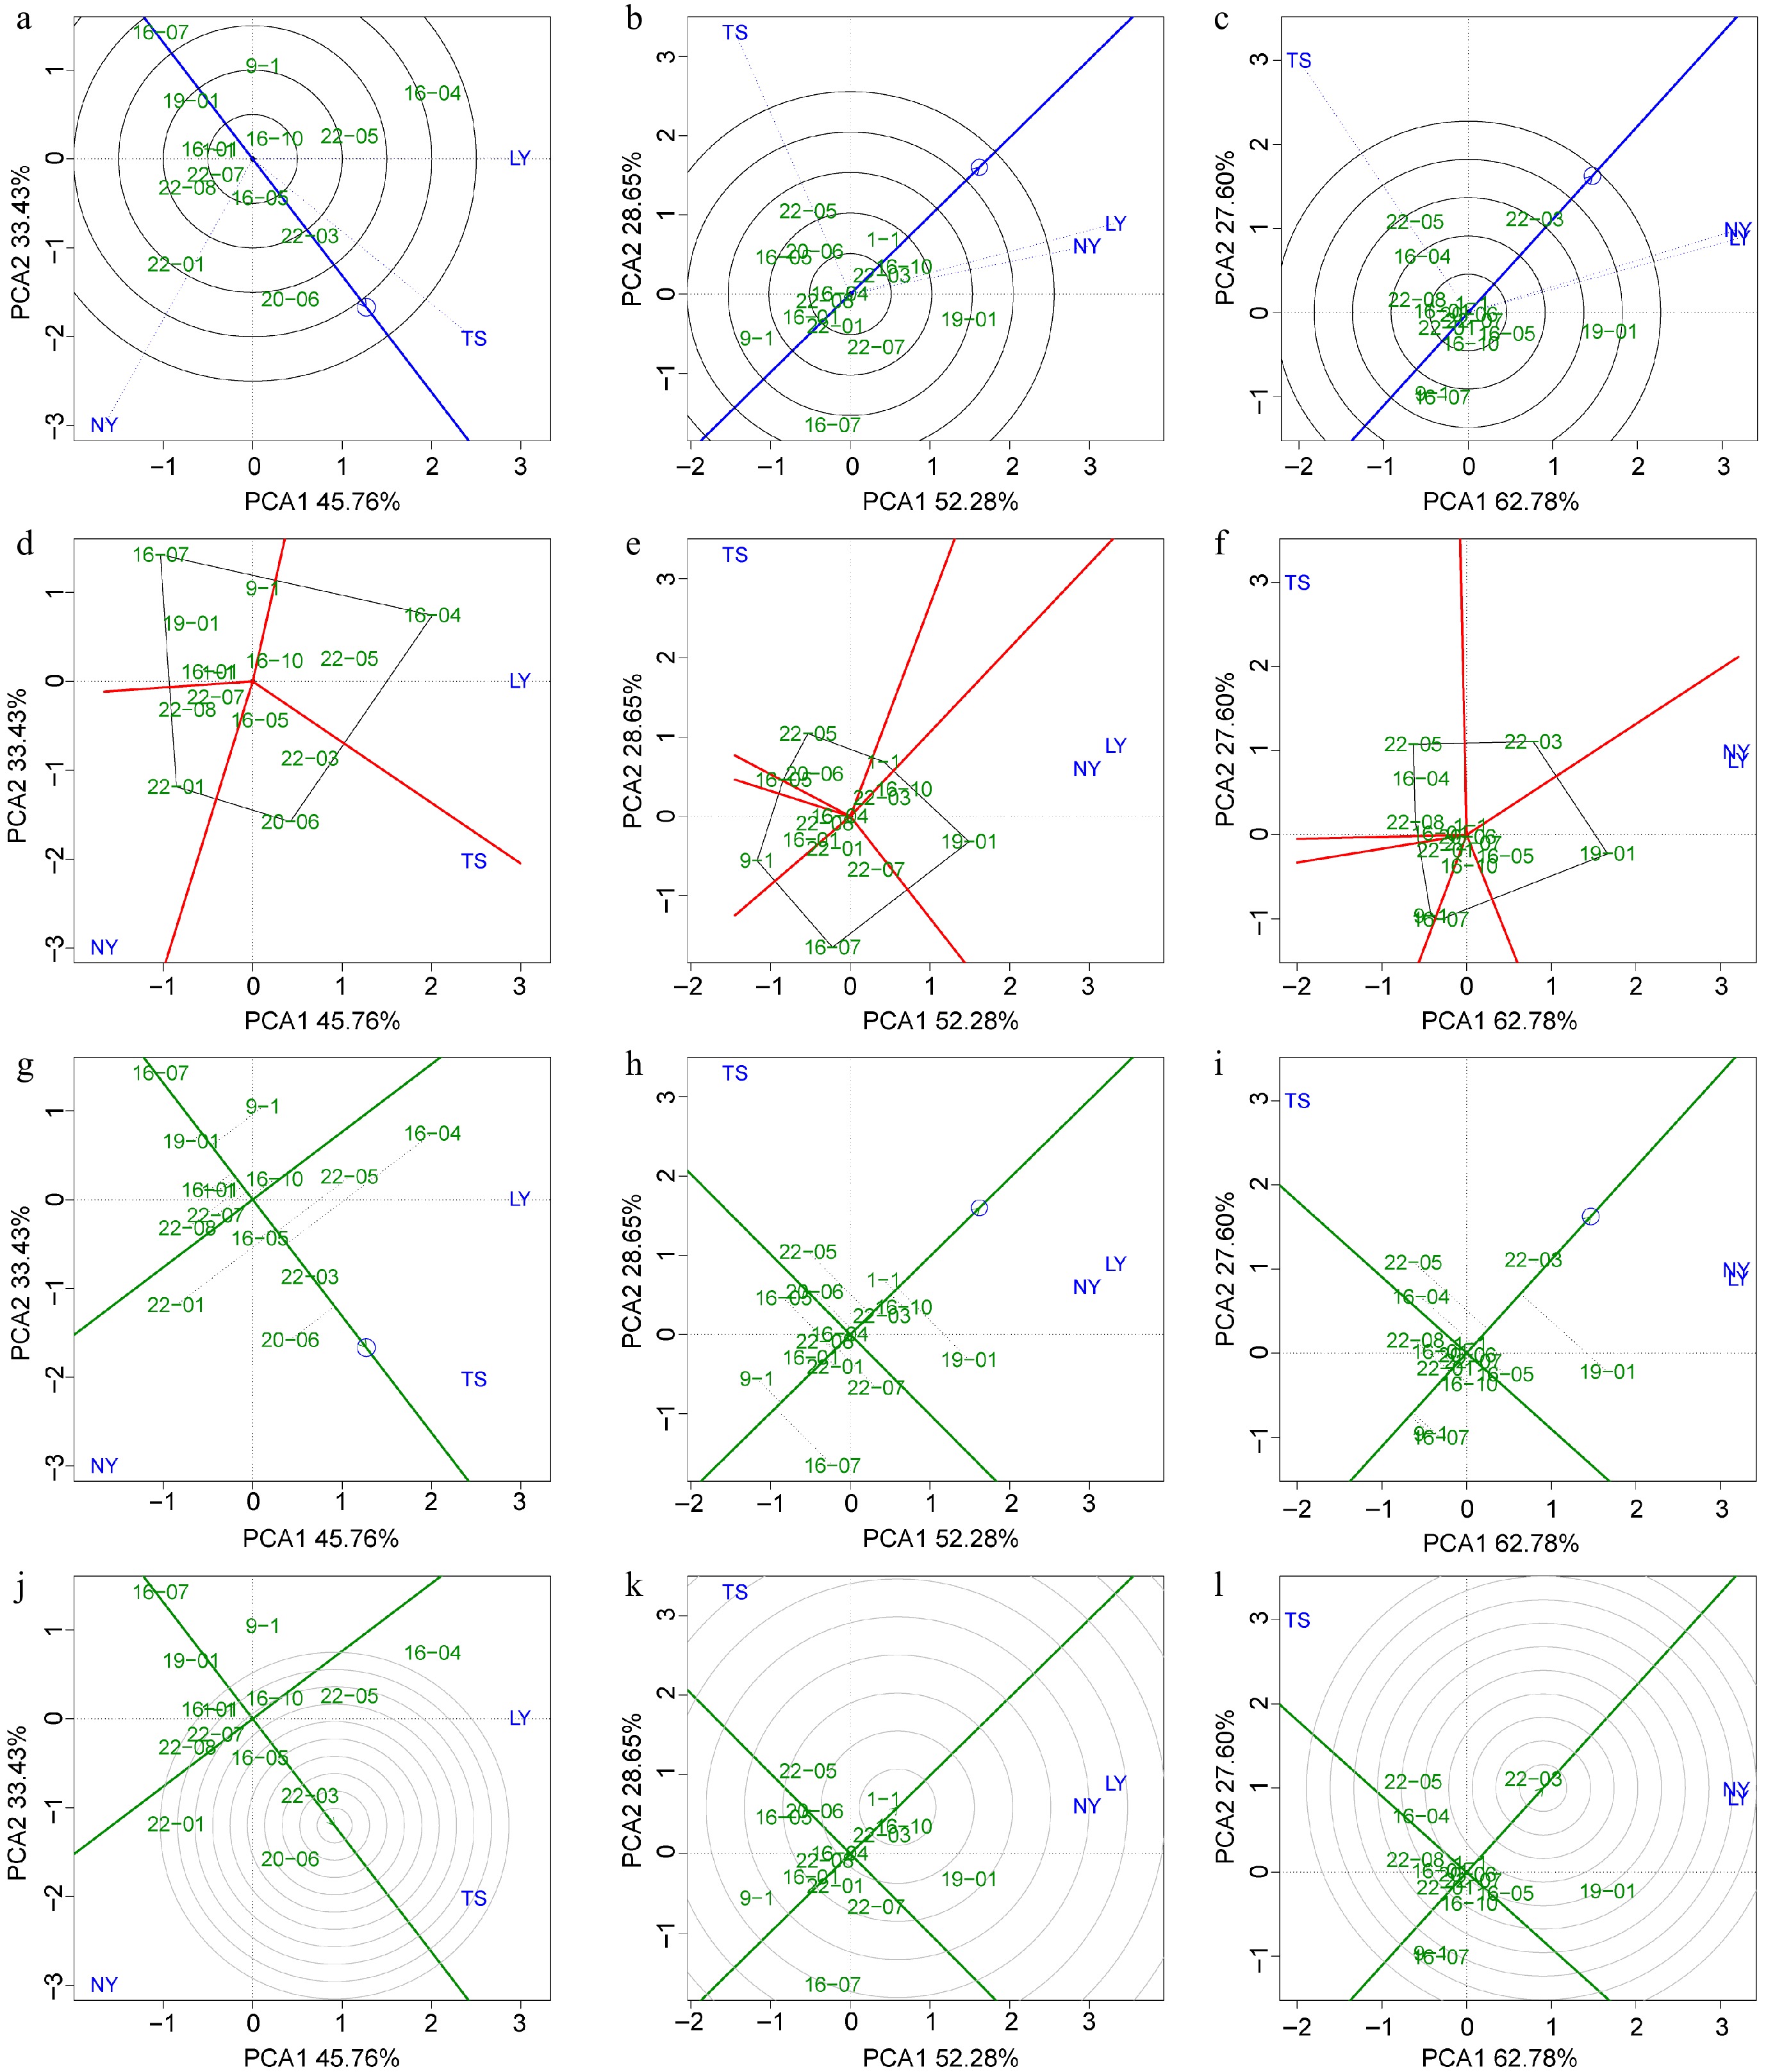
Figure 6.
BLUP-GGE analysis for the tree height, DBH, and volume of clones. Green labels indicating clones and blue labels indicating sites. (a)−(c) 'Discrimination vs representativeness' analysis is shown the blue arrow line segment representing the average environmental axis, the length of the test point line segment indicates the discriminating power of the environment on the variety, and the angle between the line segment and the average environmental axis represents the degree of representativeness of the target environment; the smaller the angle, the stronger the representativeness. (d)−(f) The 'which and won where/what' module analysis is shown, where clones at the four vertices of the polygon represent the best clones within specific regions. (g)−(i) The 'mean vs stability' analysis is shown, with the arrowed line representing the environmental mean axis, the position of the arrow indicating the mean environmental value, and the perpendicular line from the clone to the mean environmental axis (gray dashed line) representing the stability of the clone's traits. The longer the perpendicular line, the worse the trait stability, and the closer the clone is to the arrow, the better the trait performance. (j)−(l) The 'rank genotype' analysis is presented, with concentric circles made relative to the mean environmental axis, with clones closer to the center indicating better mean values and stability for their traits.
-
Trait 5a height (m) 9a DBH (cm) 5a volume (cm3) Site LY NY TS Multiple sites LY NY TS Multiple sites LY NY TS Multiple sites Excellent clone 16-04 22-01 20-06 22-03 19-01 19-01 22-05 1-1 19-01 19-01 22-05 22-03 Mean of excellent clone 9.01 7.96 9.34 8.51 15.03 14.55 12.64 13.09 0.0460 0.0366 0.0374 0.0362 Mean of population 8.63 7.40 8.18 8.07 13.35 12.37 10.44 12.06 0.0350 0.0260 0.0233 0.0271 Repeatability 0.31 0.67 0.73 0.49 0.49 0.79 0.41 0.72 0.58 0.52 0.49 0.36 Genetic gain (%) 1.36 5.11 10.43 2.70 6.12 13.94 8.56 6.22 18.13 21.46 29.84 12.11 Table 1.
The genetic gain of growth traits for excellent clones estimated from single-site and multi-site analyses.
Figures
(6)
Tables
(1)