-

Figure 1.
Scatterplot matrix, density distribution plot, and correlation coefficients (Pearson's r) for quantitative traits (tree height (H), diameter at breast height (DBH), number of branches (NB), clear bole height (CBH), crown length ratio (CLR)). * 0.01 < p < 0.05; ** 0.001 < p < 0.01; ***p < 0.001.
-
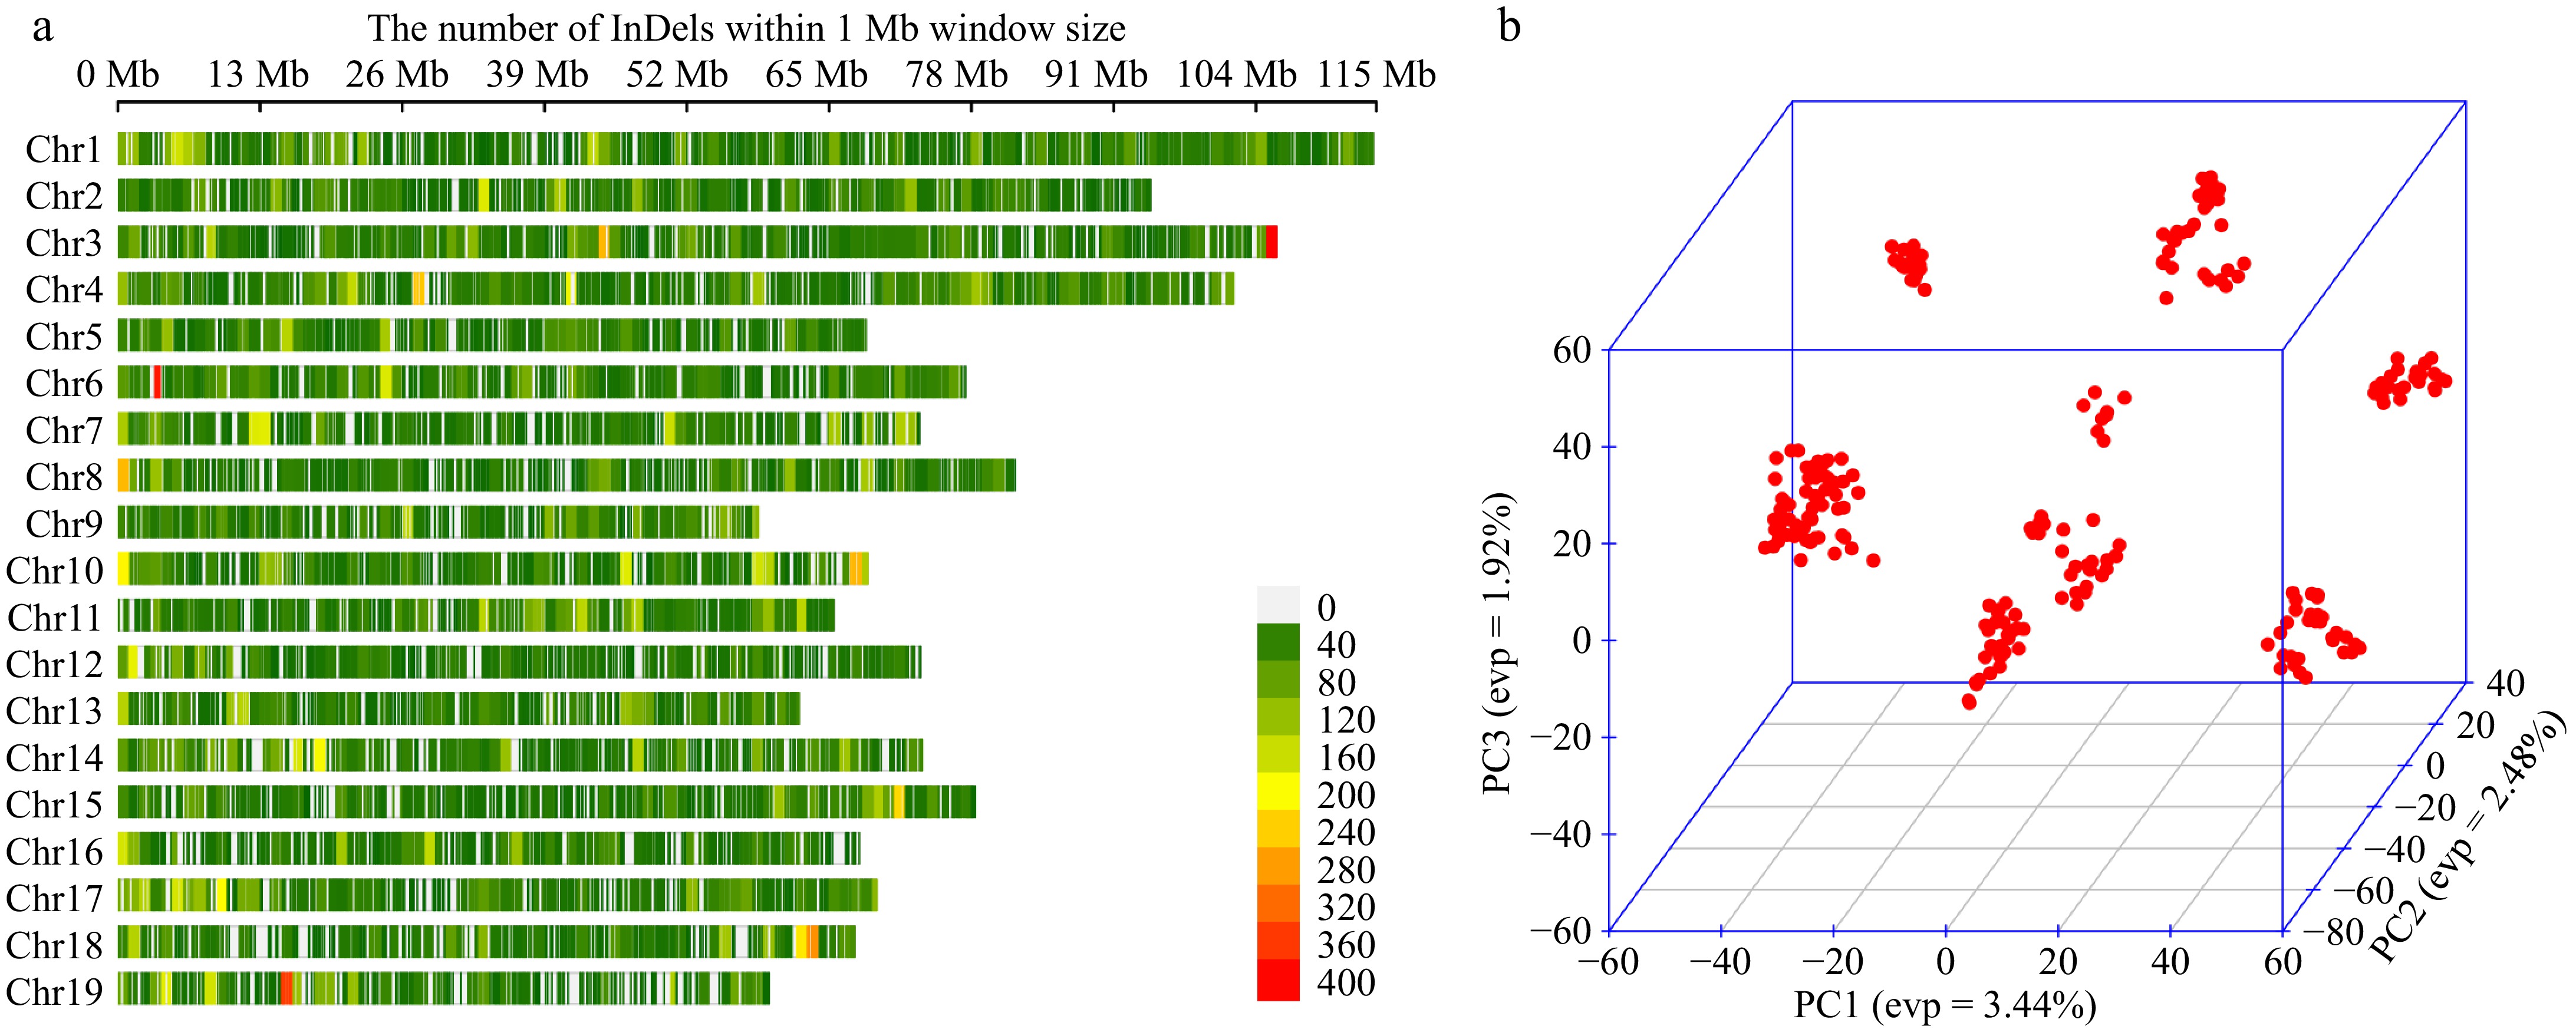
Figure 2.
(a) InDel density map of 19 chromosomes, with a window size of 1 MB, excluding overlapping clusters, where redder colours represent denser InDel distributions. (b) Three-dimensional scatter plot of the first three principal components for all individuals.
-

Figure 3.
Heat map of the number of significant loci screened by each model. The redder the color, the higher the number of loci.
-
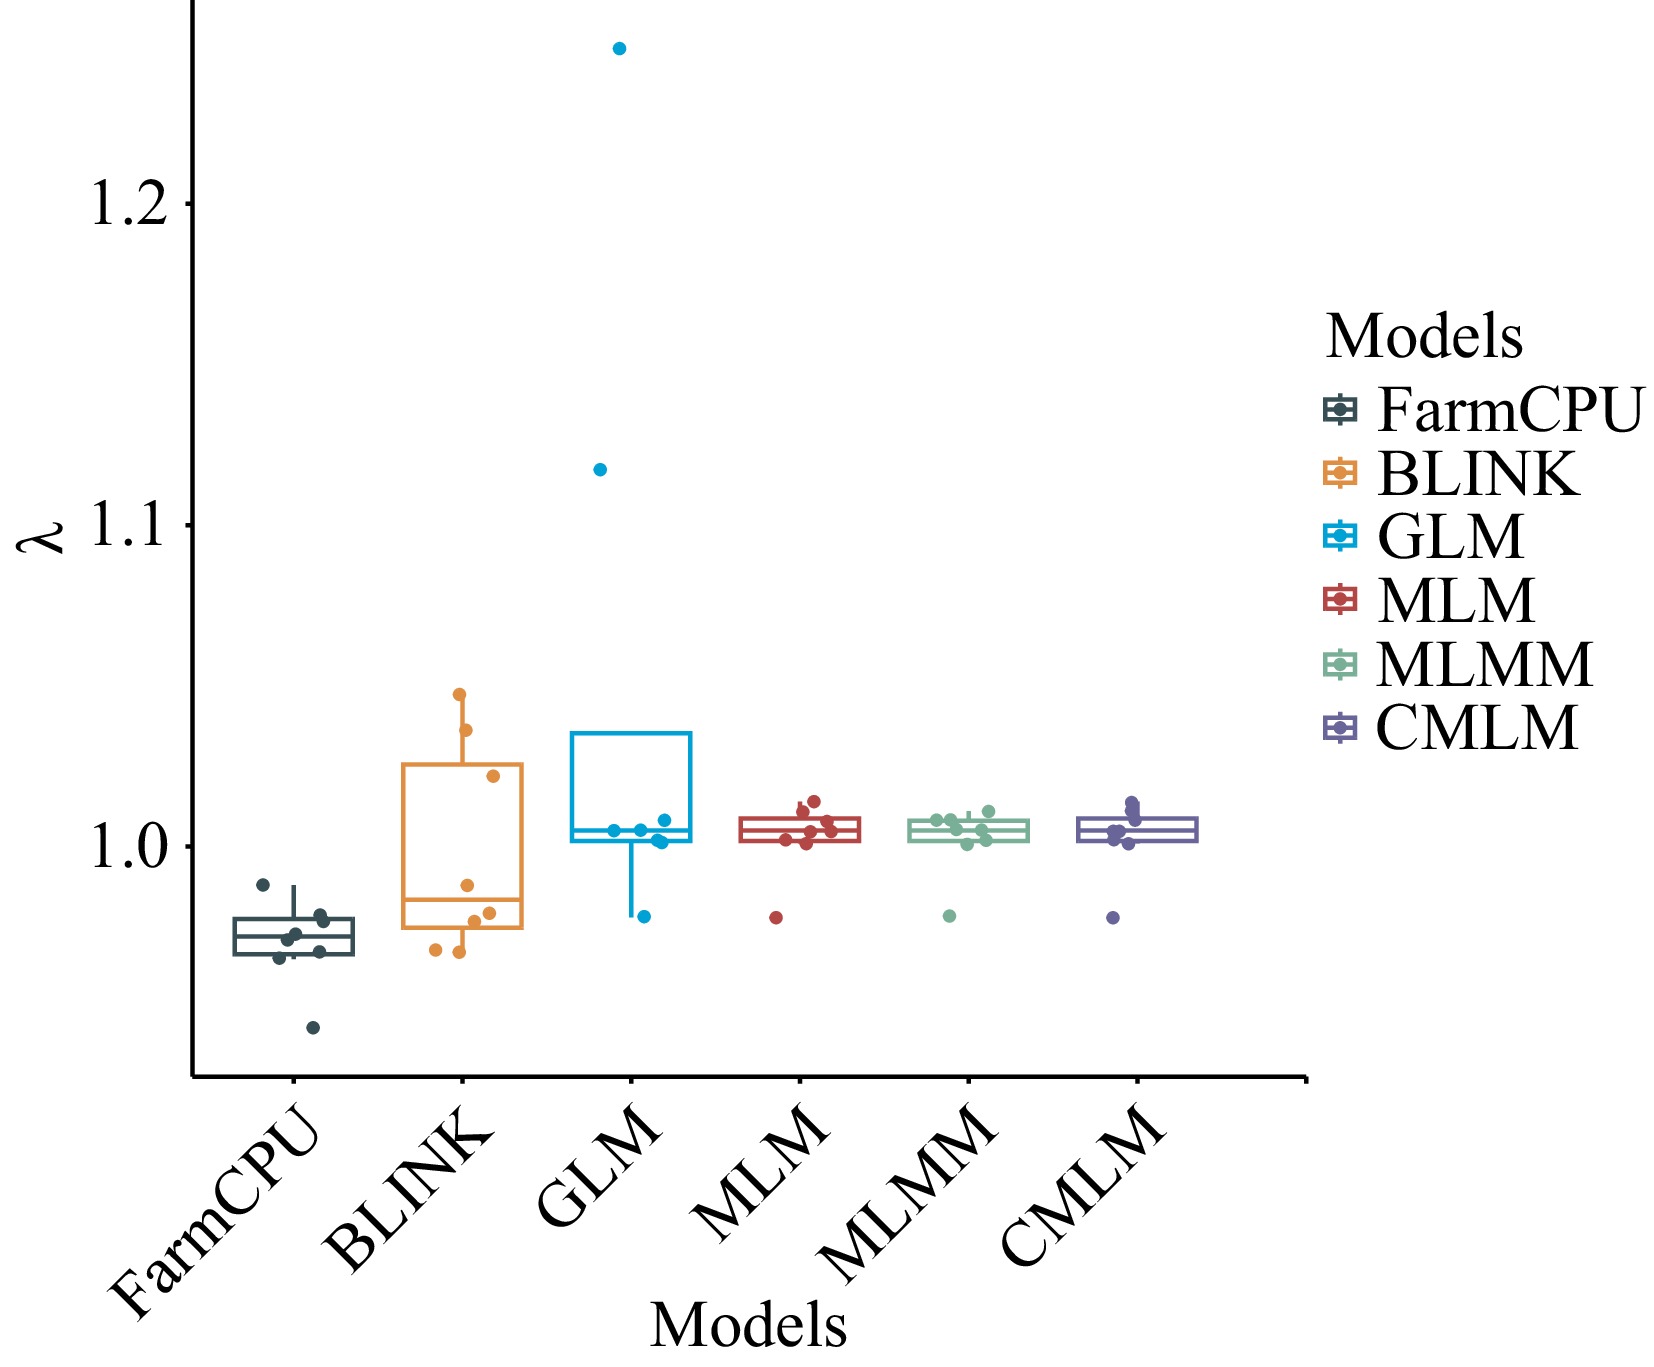
Figure 4.
Box plots of expansion coefficients for the six models. λ is the expansion coefficient.
-
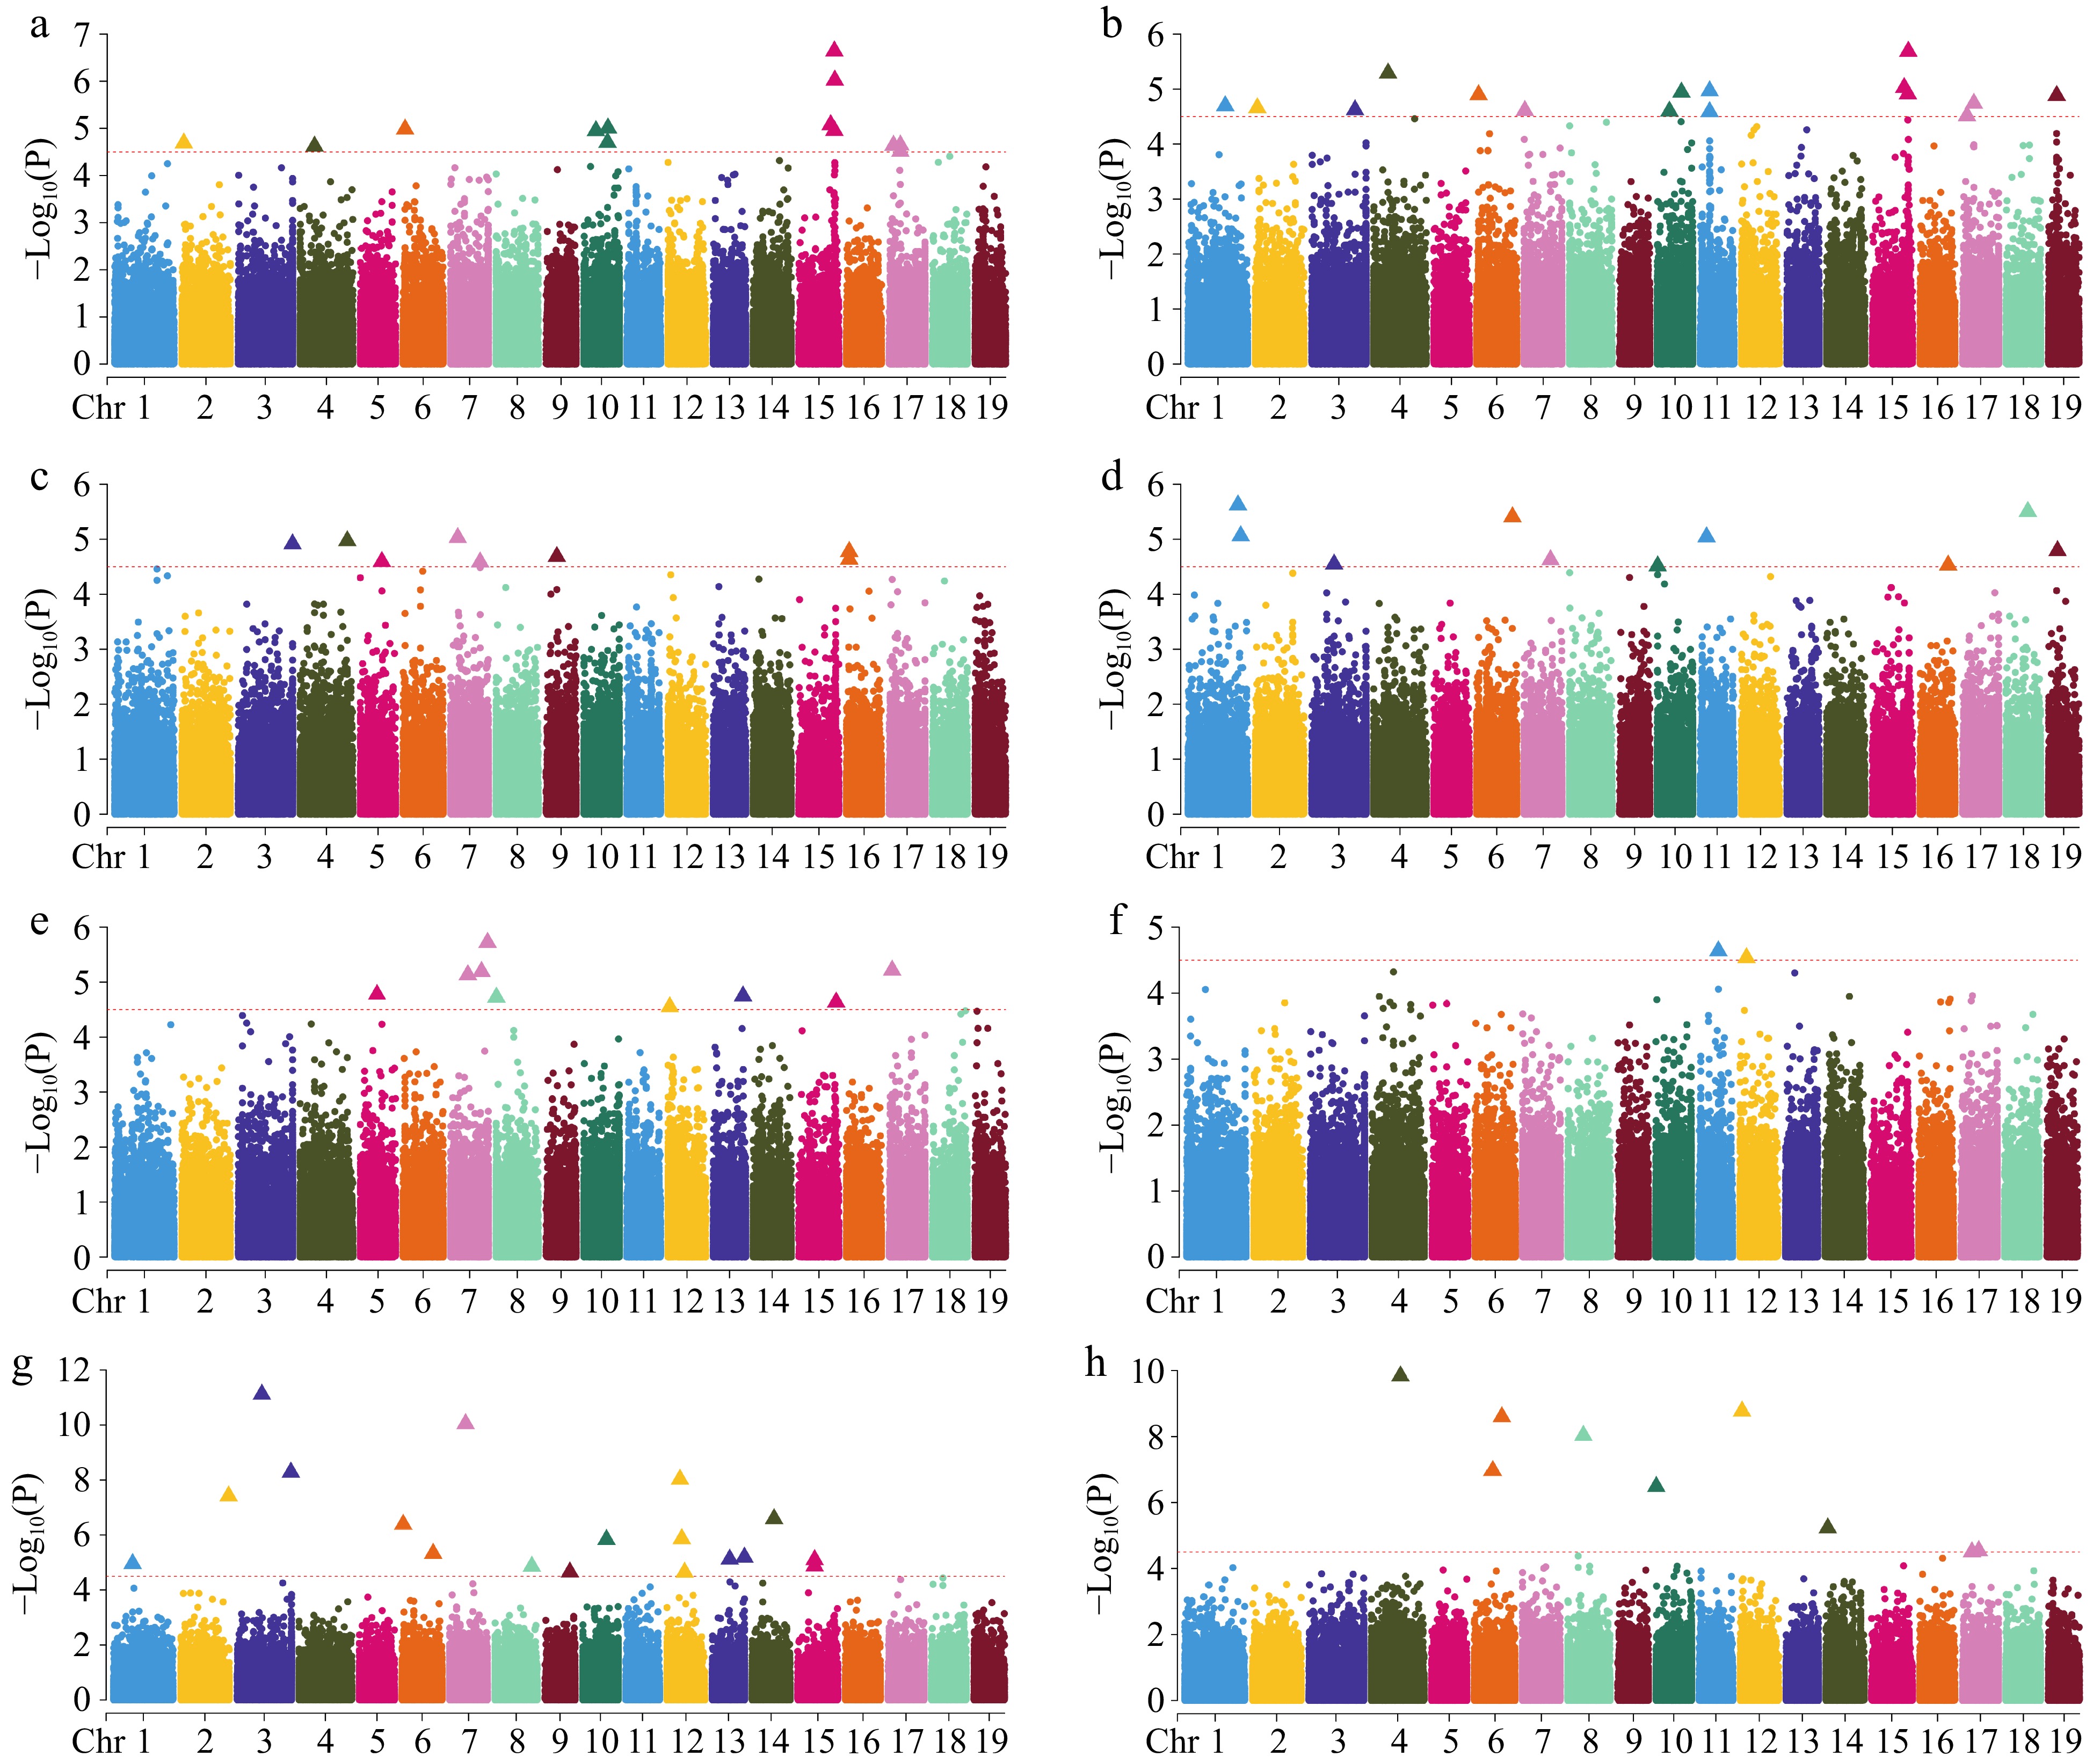
Figure 5.
Manhattan plot of GWAS analysis using SNPs. (a) Clear bole height; (b) crown to length ratio; (c) branch angle; (d) forking; (e) number of branches; (f) straightness; (g) diameter at breast height; (h) tree height. The red dotted line indicates the significance threshold (−Log10(P) ≥ 4.50), the points of the triangle are the loci of significance, and only 19 chromosomes are shown, excluding contigs.
-
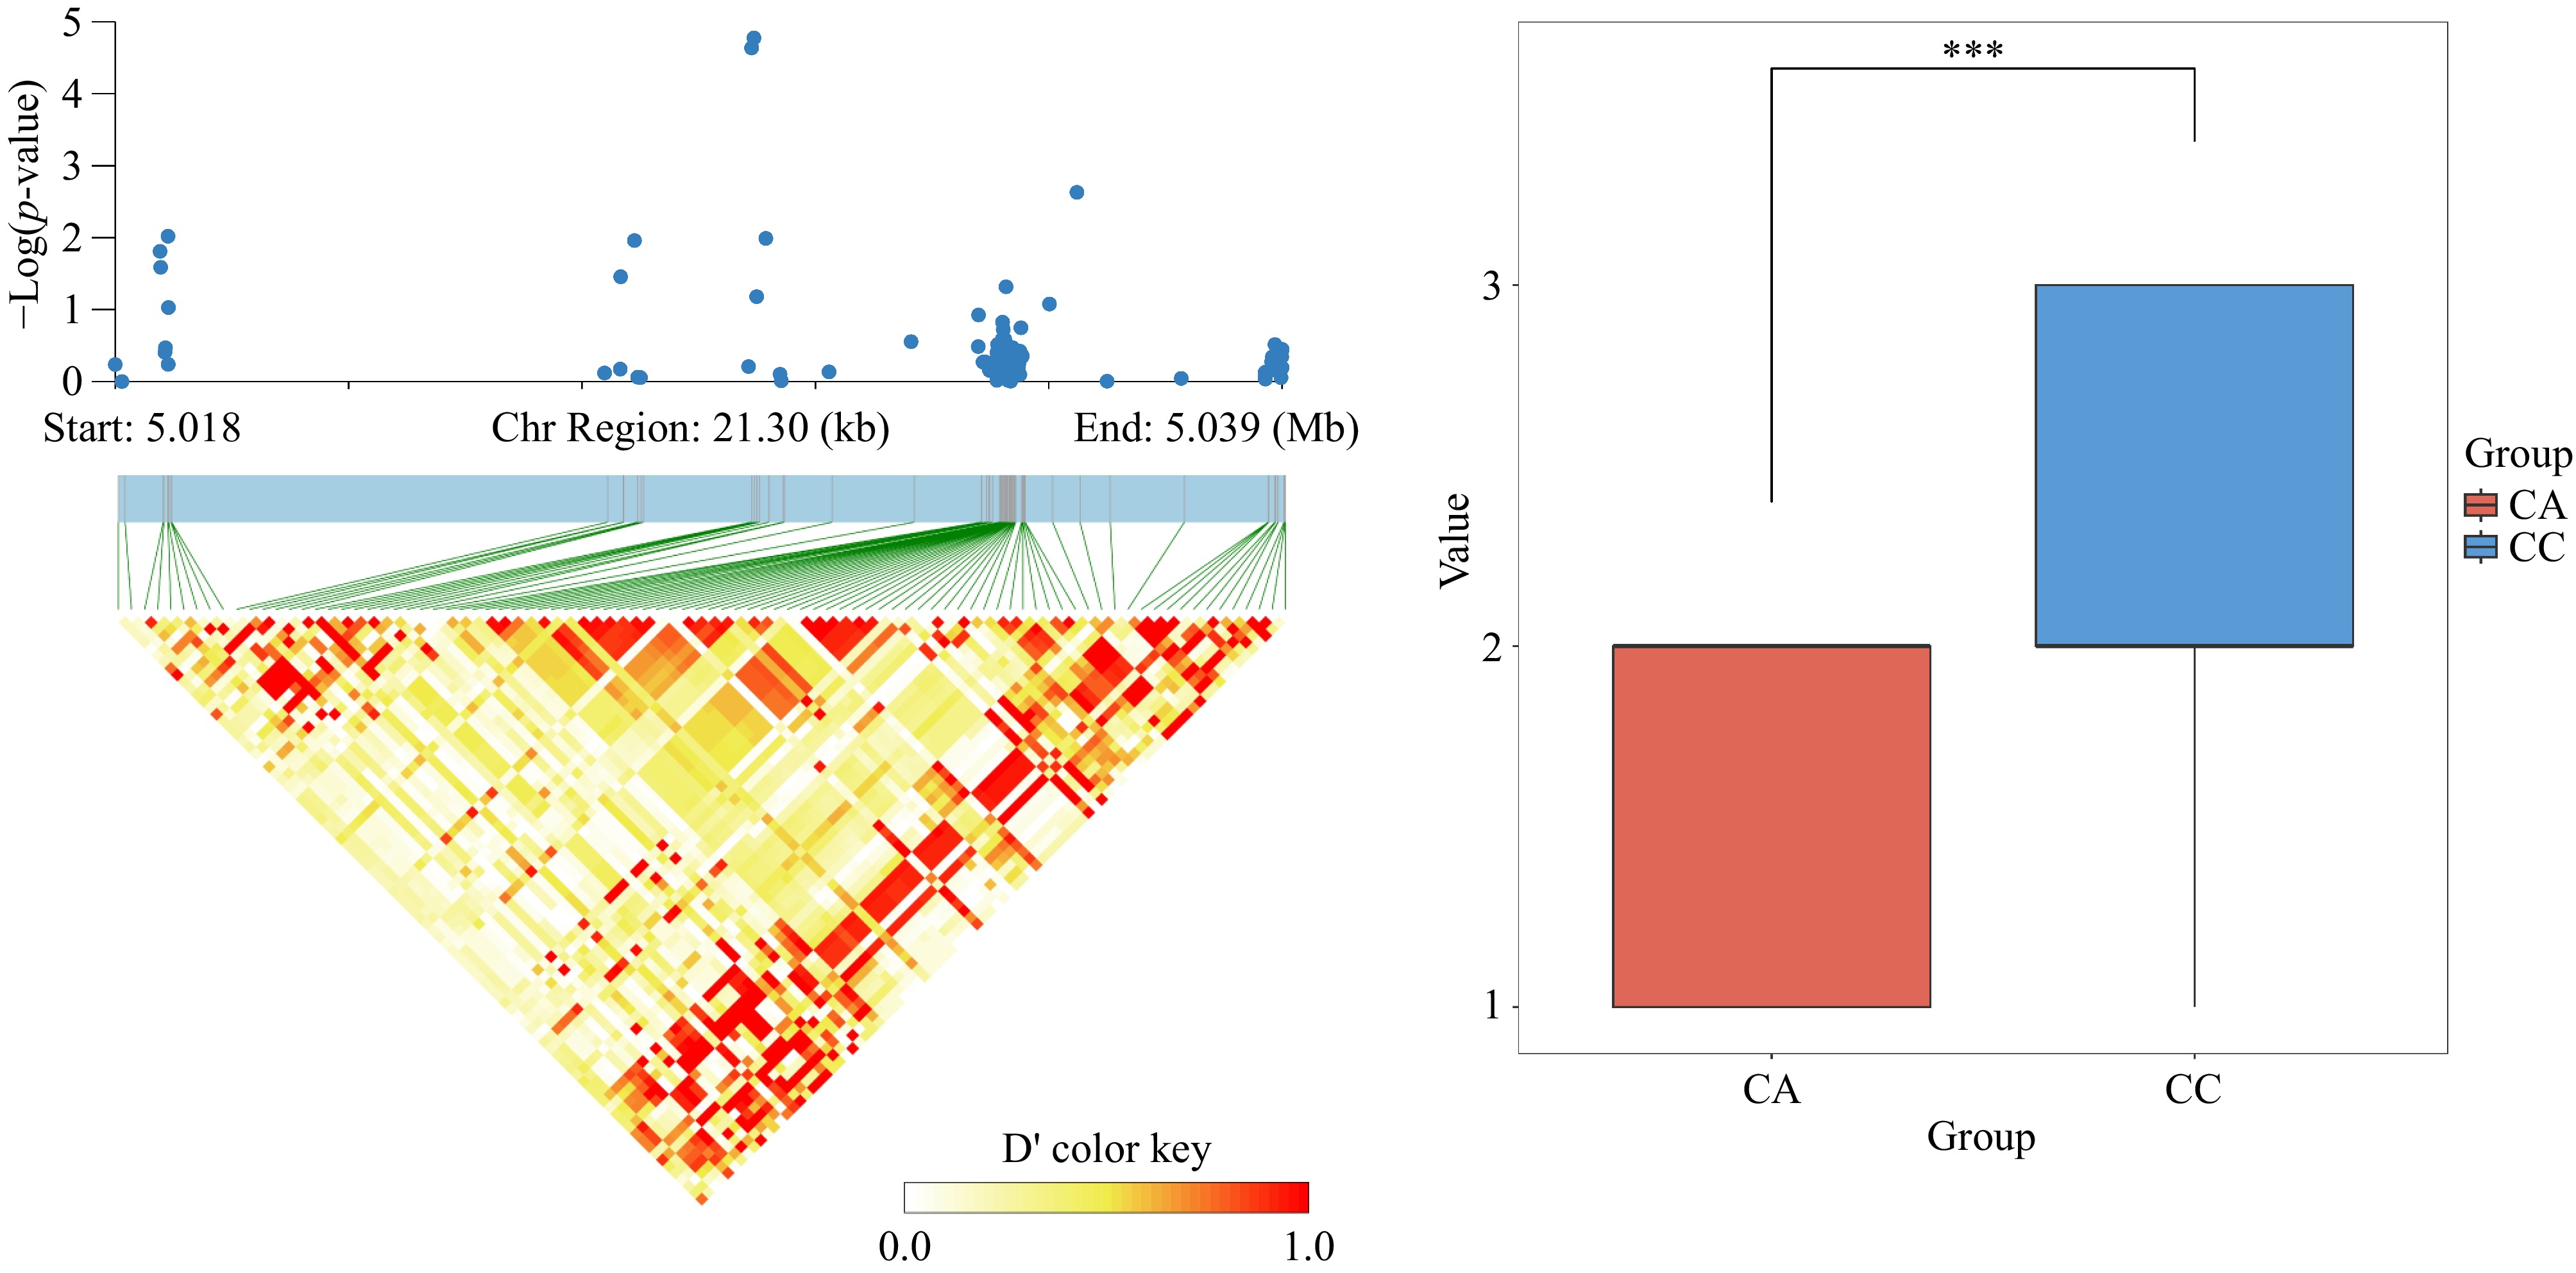
Figure 6.
(a) Analysis of significant SNP locus Chr16_5029808 LD block. (b) Significance analysis of allelic differences for the highly significant SNP locus chr16_5029808, where CC indicates that the locus is CC pure and CA indicates that the locus is CA heterozygous.
-
Traits Minimum
valuesMaximum
valueAverage
valueStandard
deviationCV (%) H 12.10 25.80 21.21 2.28 0.11 DBH 11.40 38.70 26.64 4.91 0.18 NB 3.00 43.00 20.40 7.29 0.36 CBH 1.70 16.20 8.15 3.00 0.37 CLR 0.16 0.91 0.62 0.13 0.21 Table 1.
Statistical analysis of tree height (H), diameter at breast height (DBH), number of branches (NB), clear bole height (CBH), crown length ratio (CLR) traits.
-
Tissues Gene Log2FC Log2CPM LR p-value FDR Up/down Shoot Lchi_12g23550 2.45 3.12 20.99 4.63E-06 3.78E-04 Up Lchi_18g34878 3.61 2.75 13.81 2.02E-04 6.66E-03 Up Lchi_10g20626 −1.53 5.14 14.37 1.51E-04 5.34E-03 Down Lchi_12g23559 1.98 4.25 8.97 2.75E-03 4.24E-02 Up Lchi_5g12415 −2.05 3.59 18.10 2.10E-05 1.18E-03 Down Lchi_15g28864 3.34 2.07 10.34 1.3E-03 2.51E-02 Up Lchi_14g27994 2.57 2.35 11.15 8.40E-04 1.89E-02 Up Lchi_3g07857 −1.32 7.58 9.09 2.57E-03 4.07E-02 Down Xylem Lchi_6g12913 −1.06 6.54 15.94 6.52E-05 3.14E-03 Down Table 2.
Nine candidate genes associated with growth and stem traits in the differentially expressed gene (DEG) sets.
Figures
(6)
Tables
(2)