-
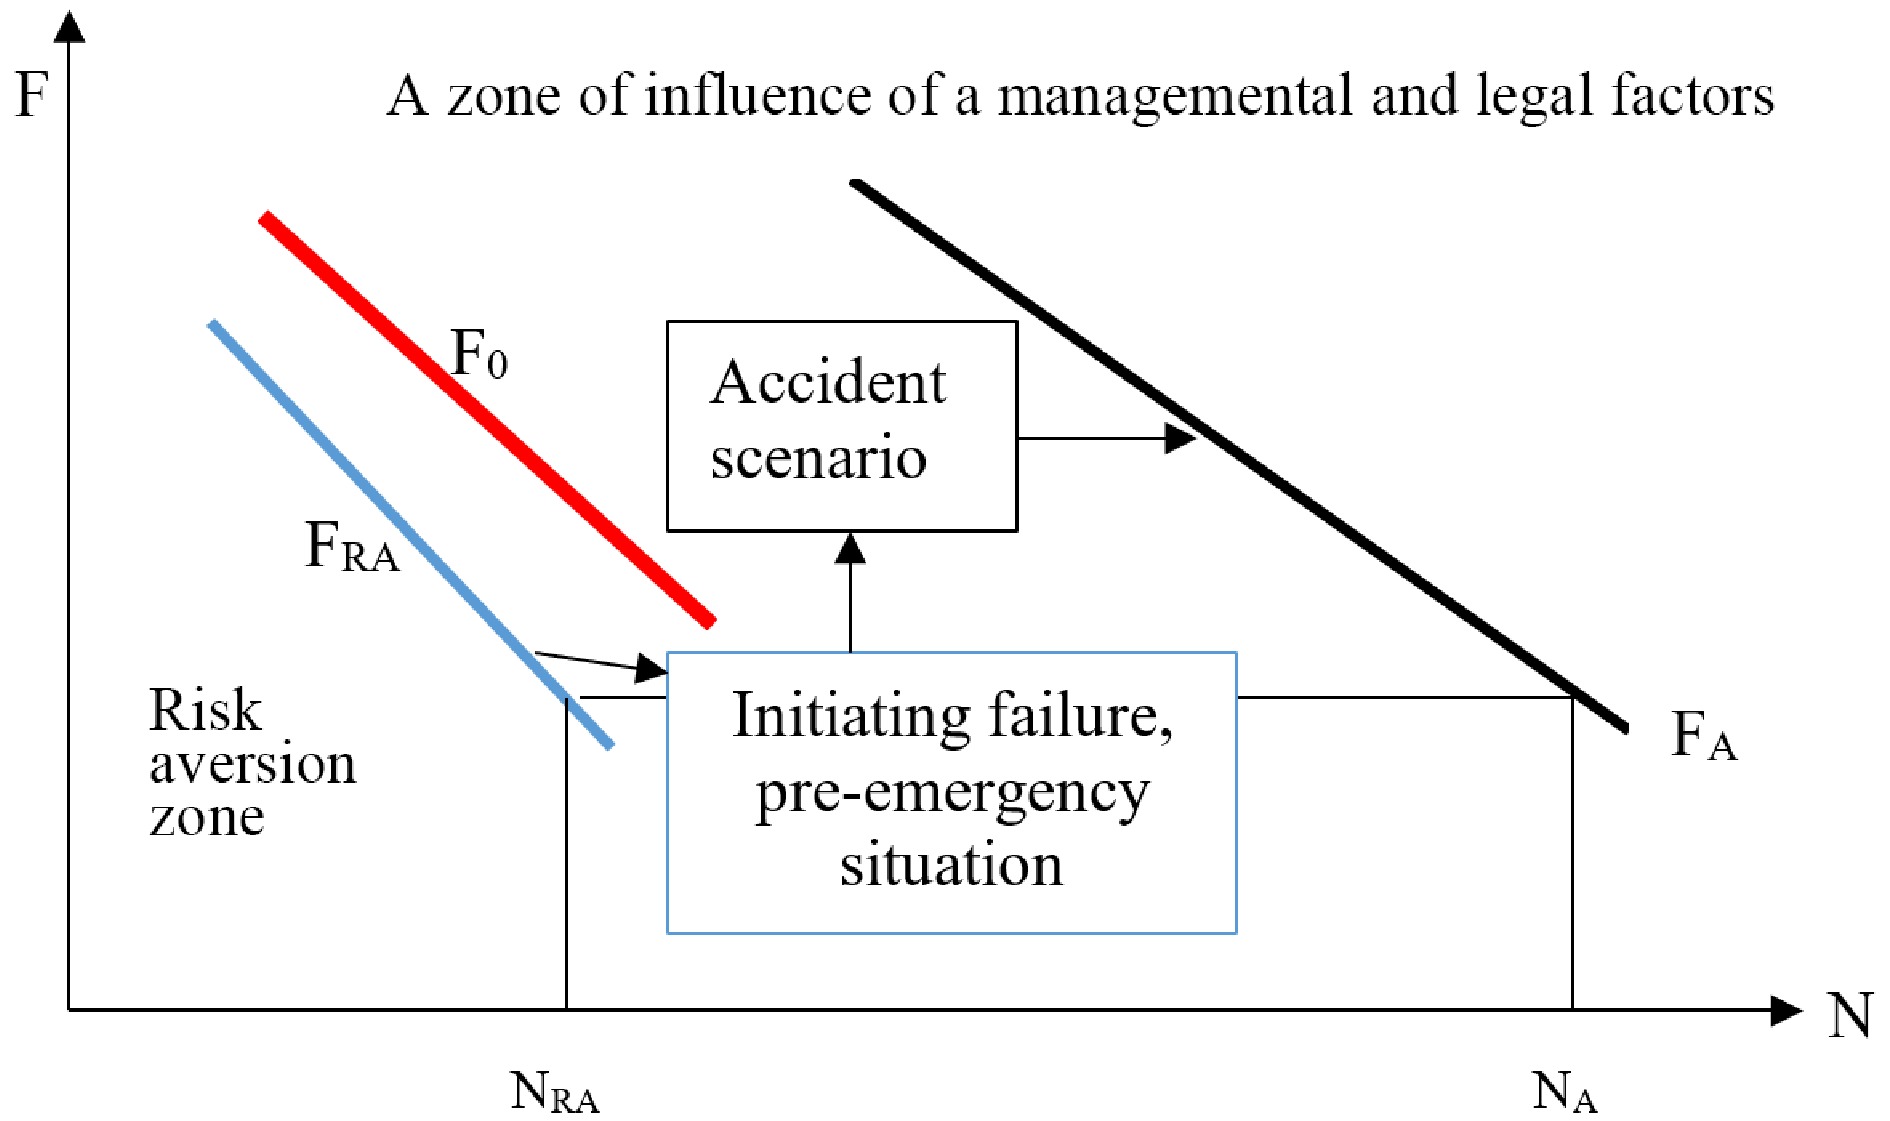
Figure 1.
F-N-curves of neutral risk (F0), risk aversion (FRA) and the scheme of formation of high-risk curves (FA).
-
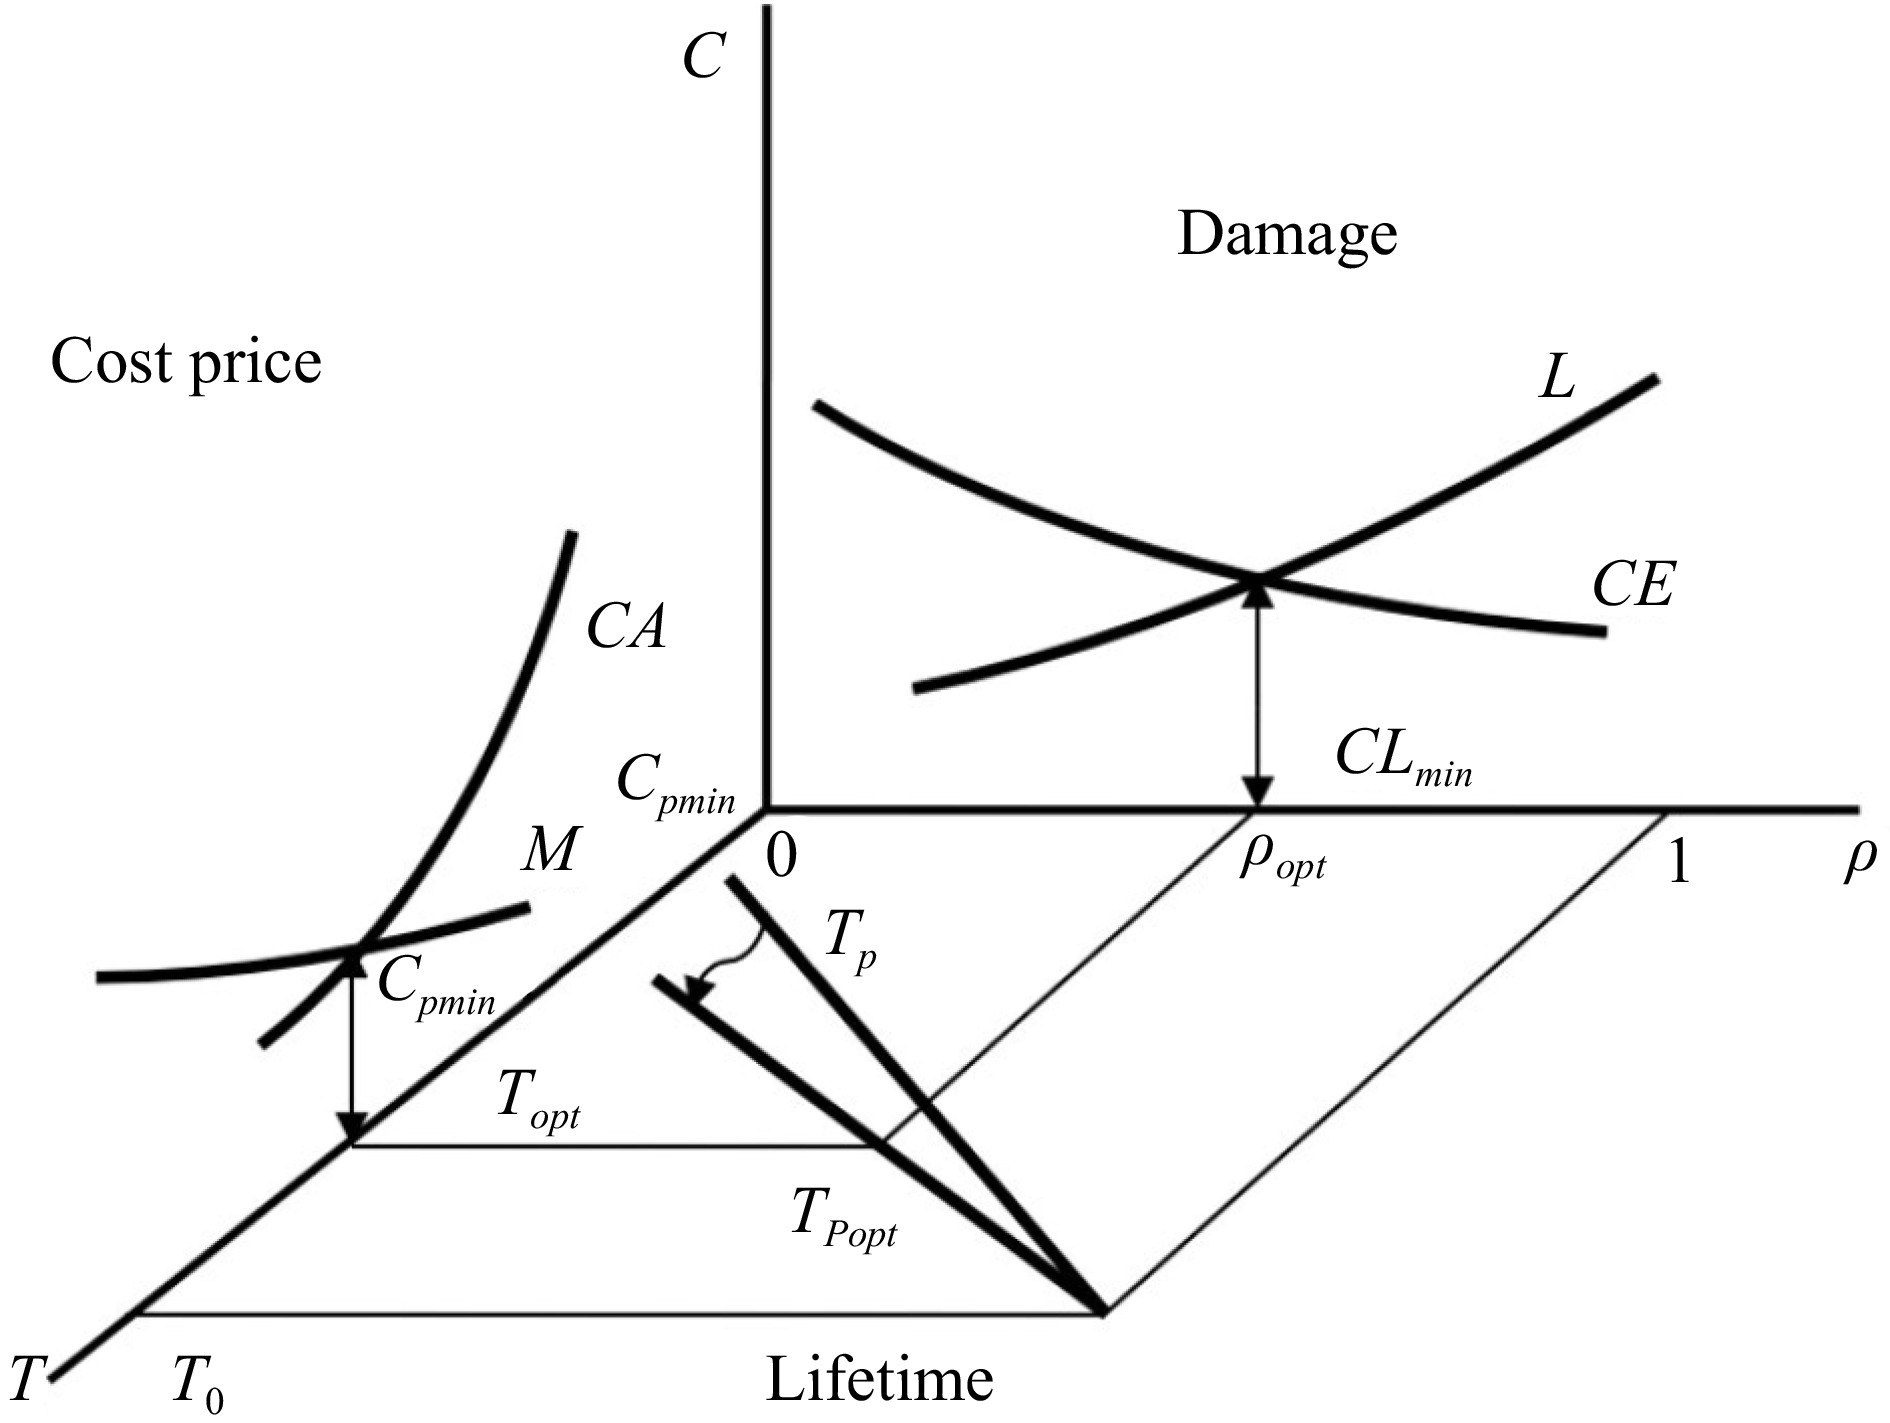
Figure 2.
The principle of finding the optimal risk ρopt and improving safety when transitioning from the assigned resource allocation function F to the initial resource allocation function Fopt , the guaranteed value of which should correspond to the optimal risk ρopt and the optimal service life Topt.
-
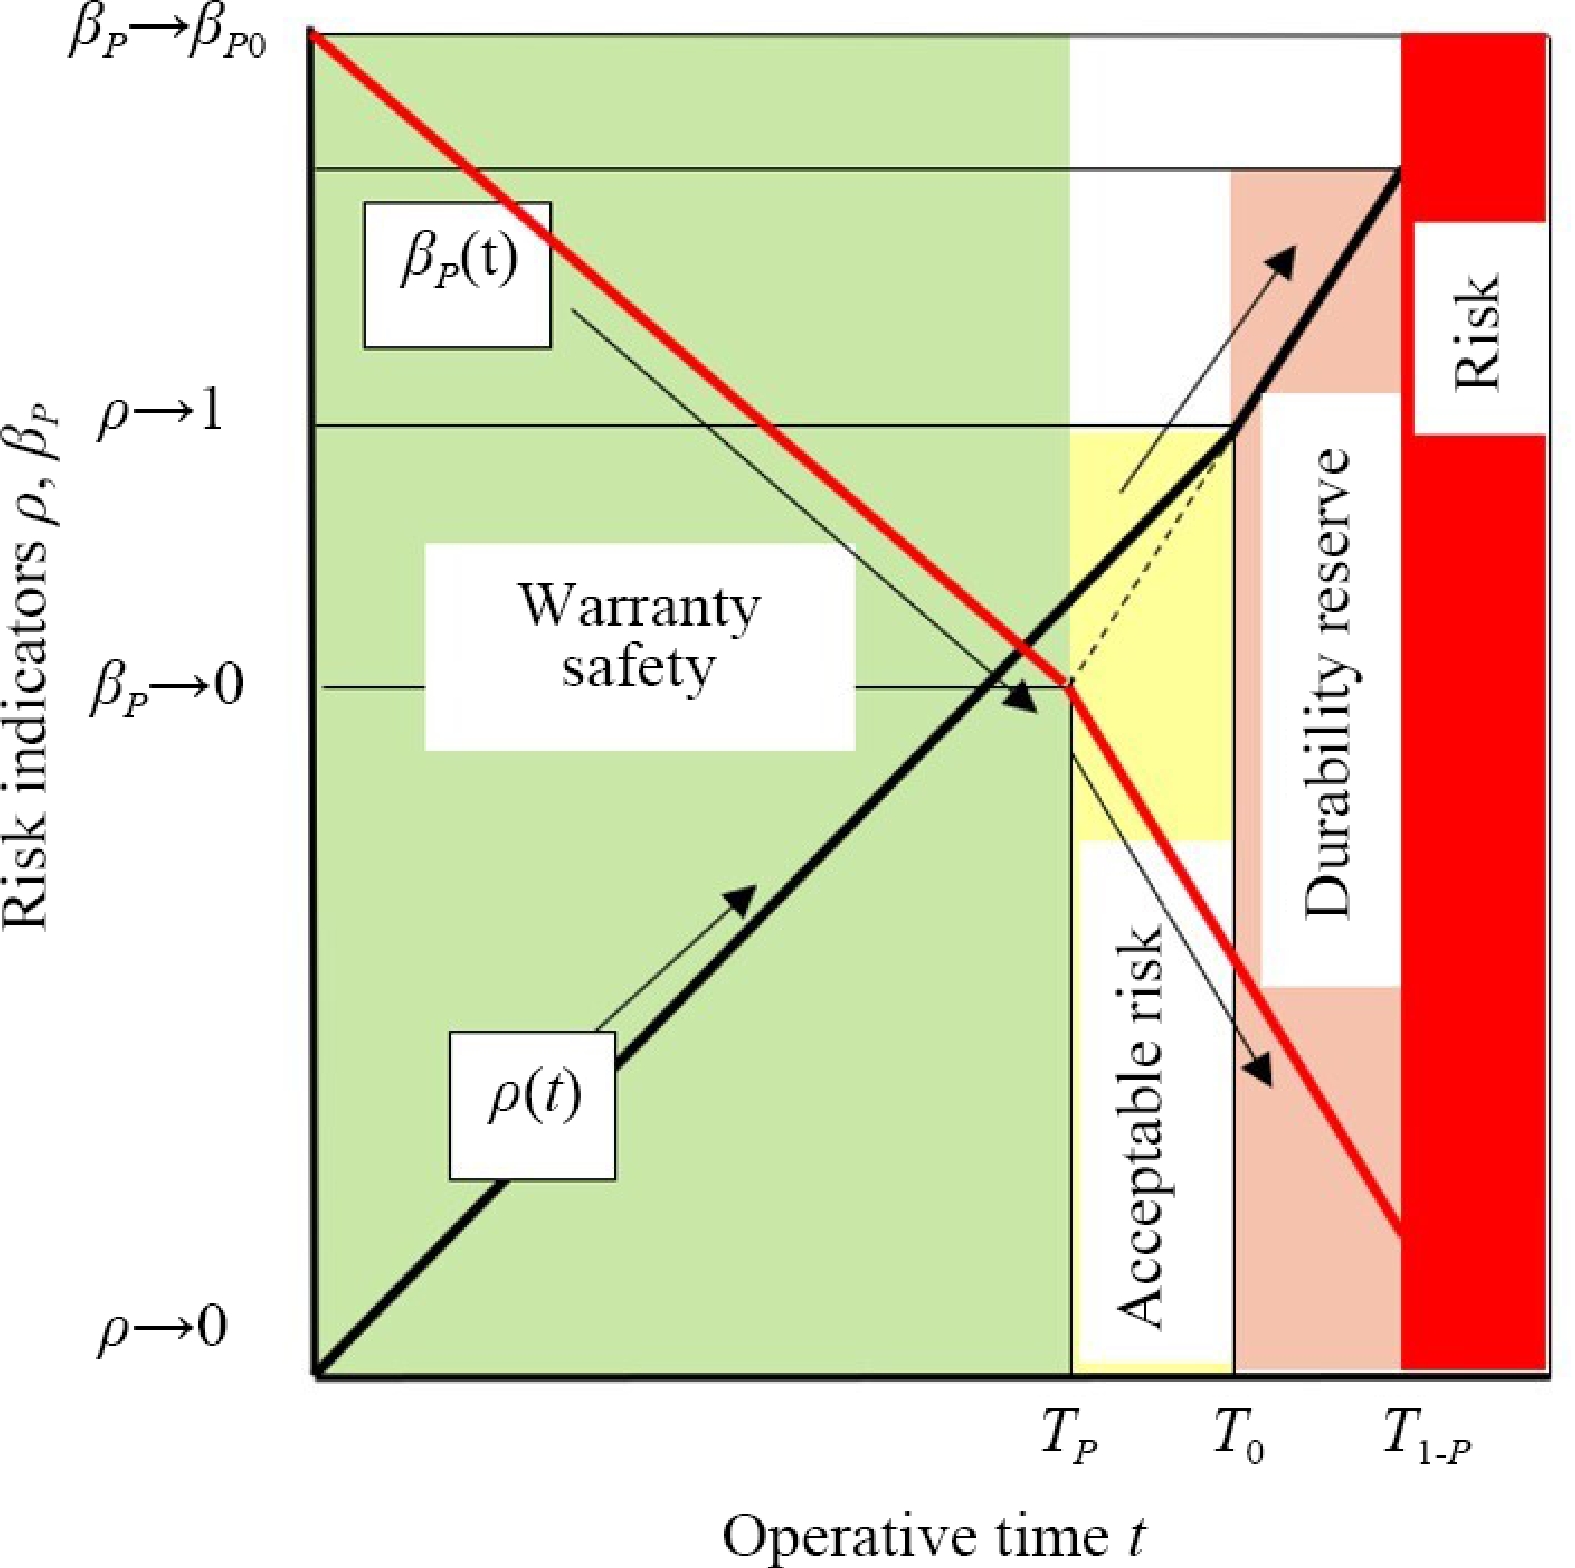
Figure 3.
Application of risk and safety indicators for diagnosing technical conditions.
-
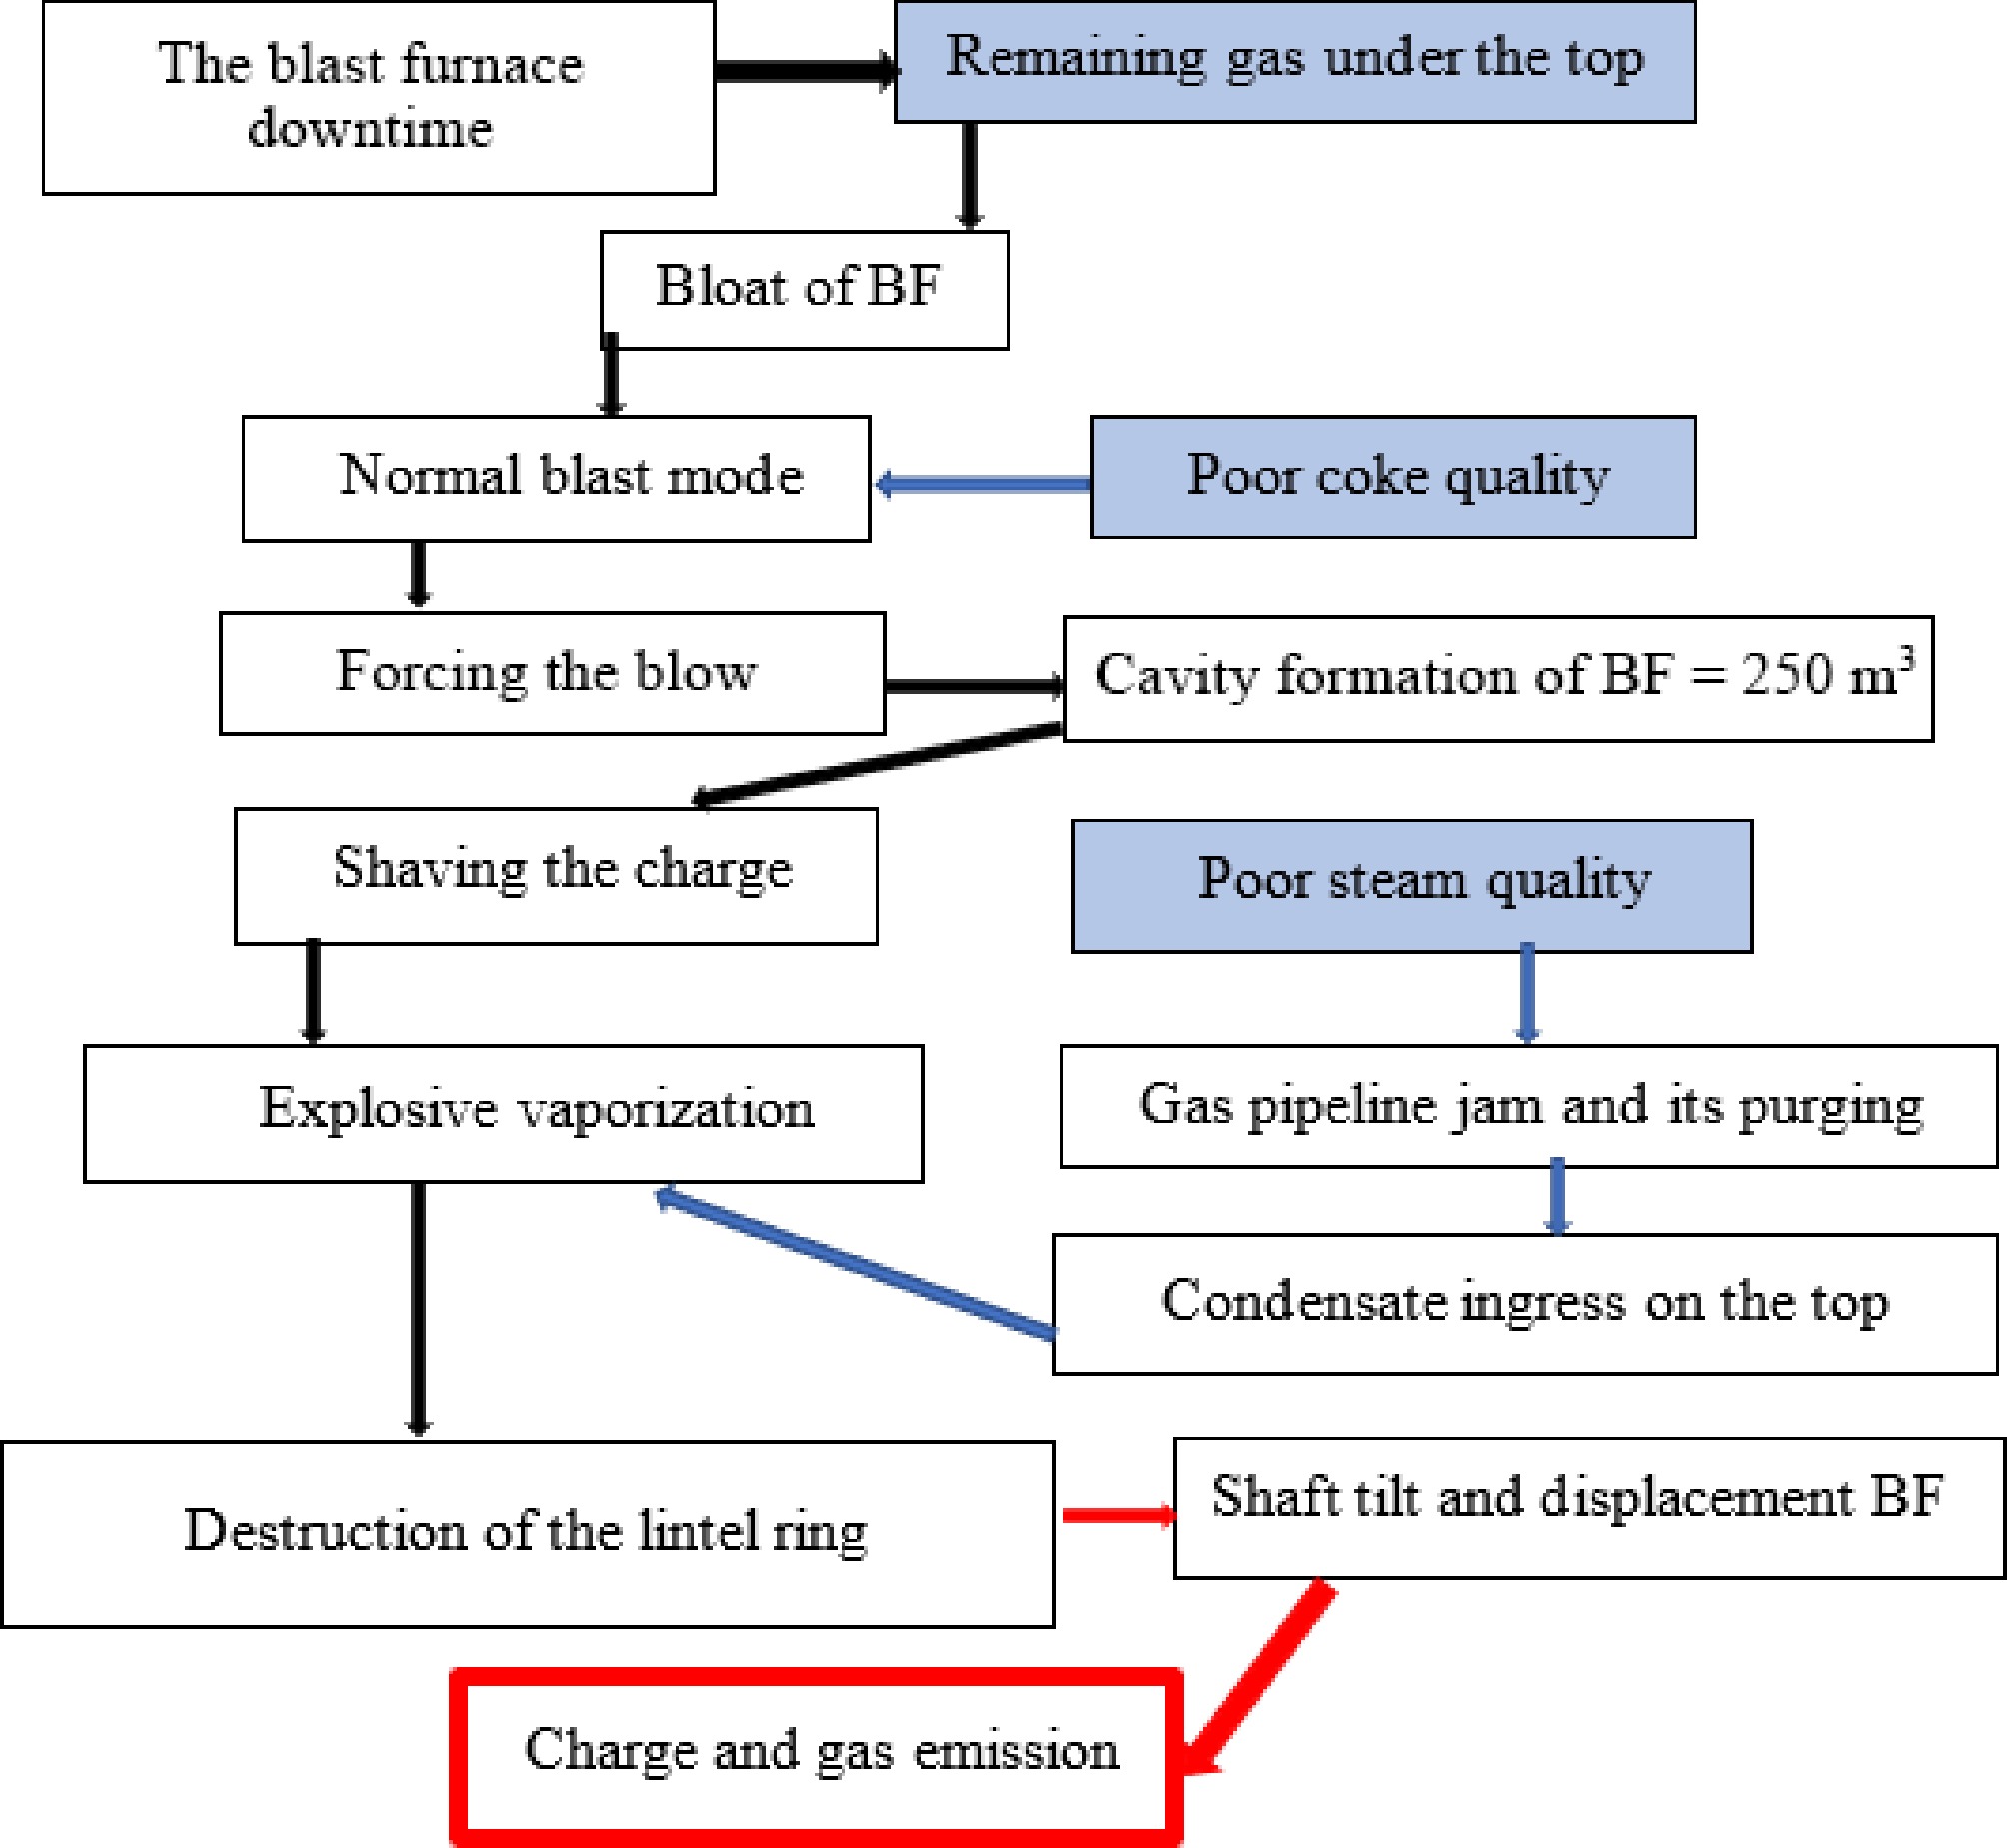
Figure 4.
Scenario of the accident at the blast furnace in Ukraine.
-
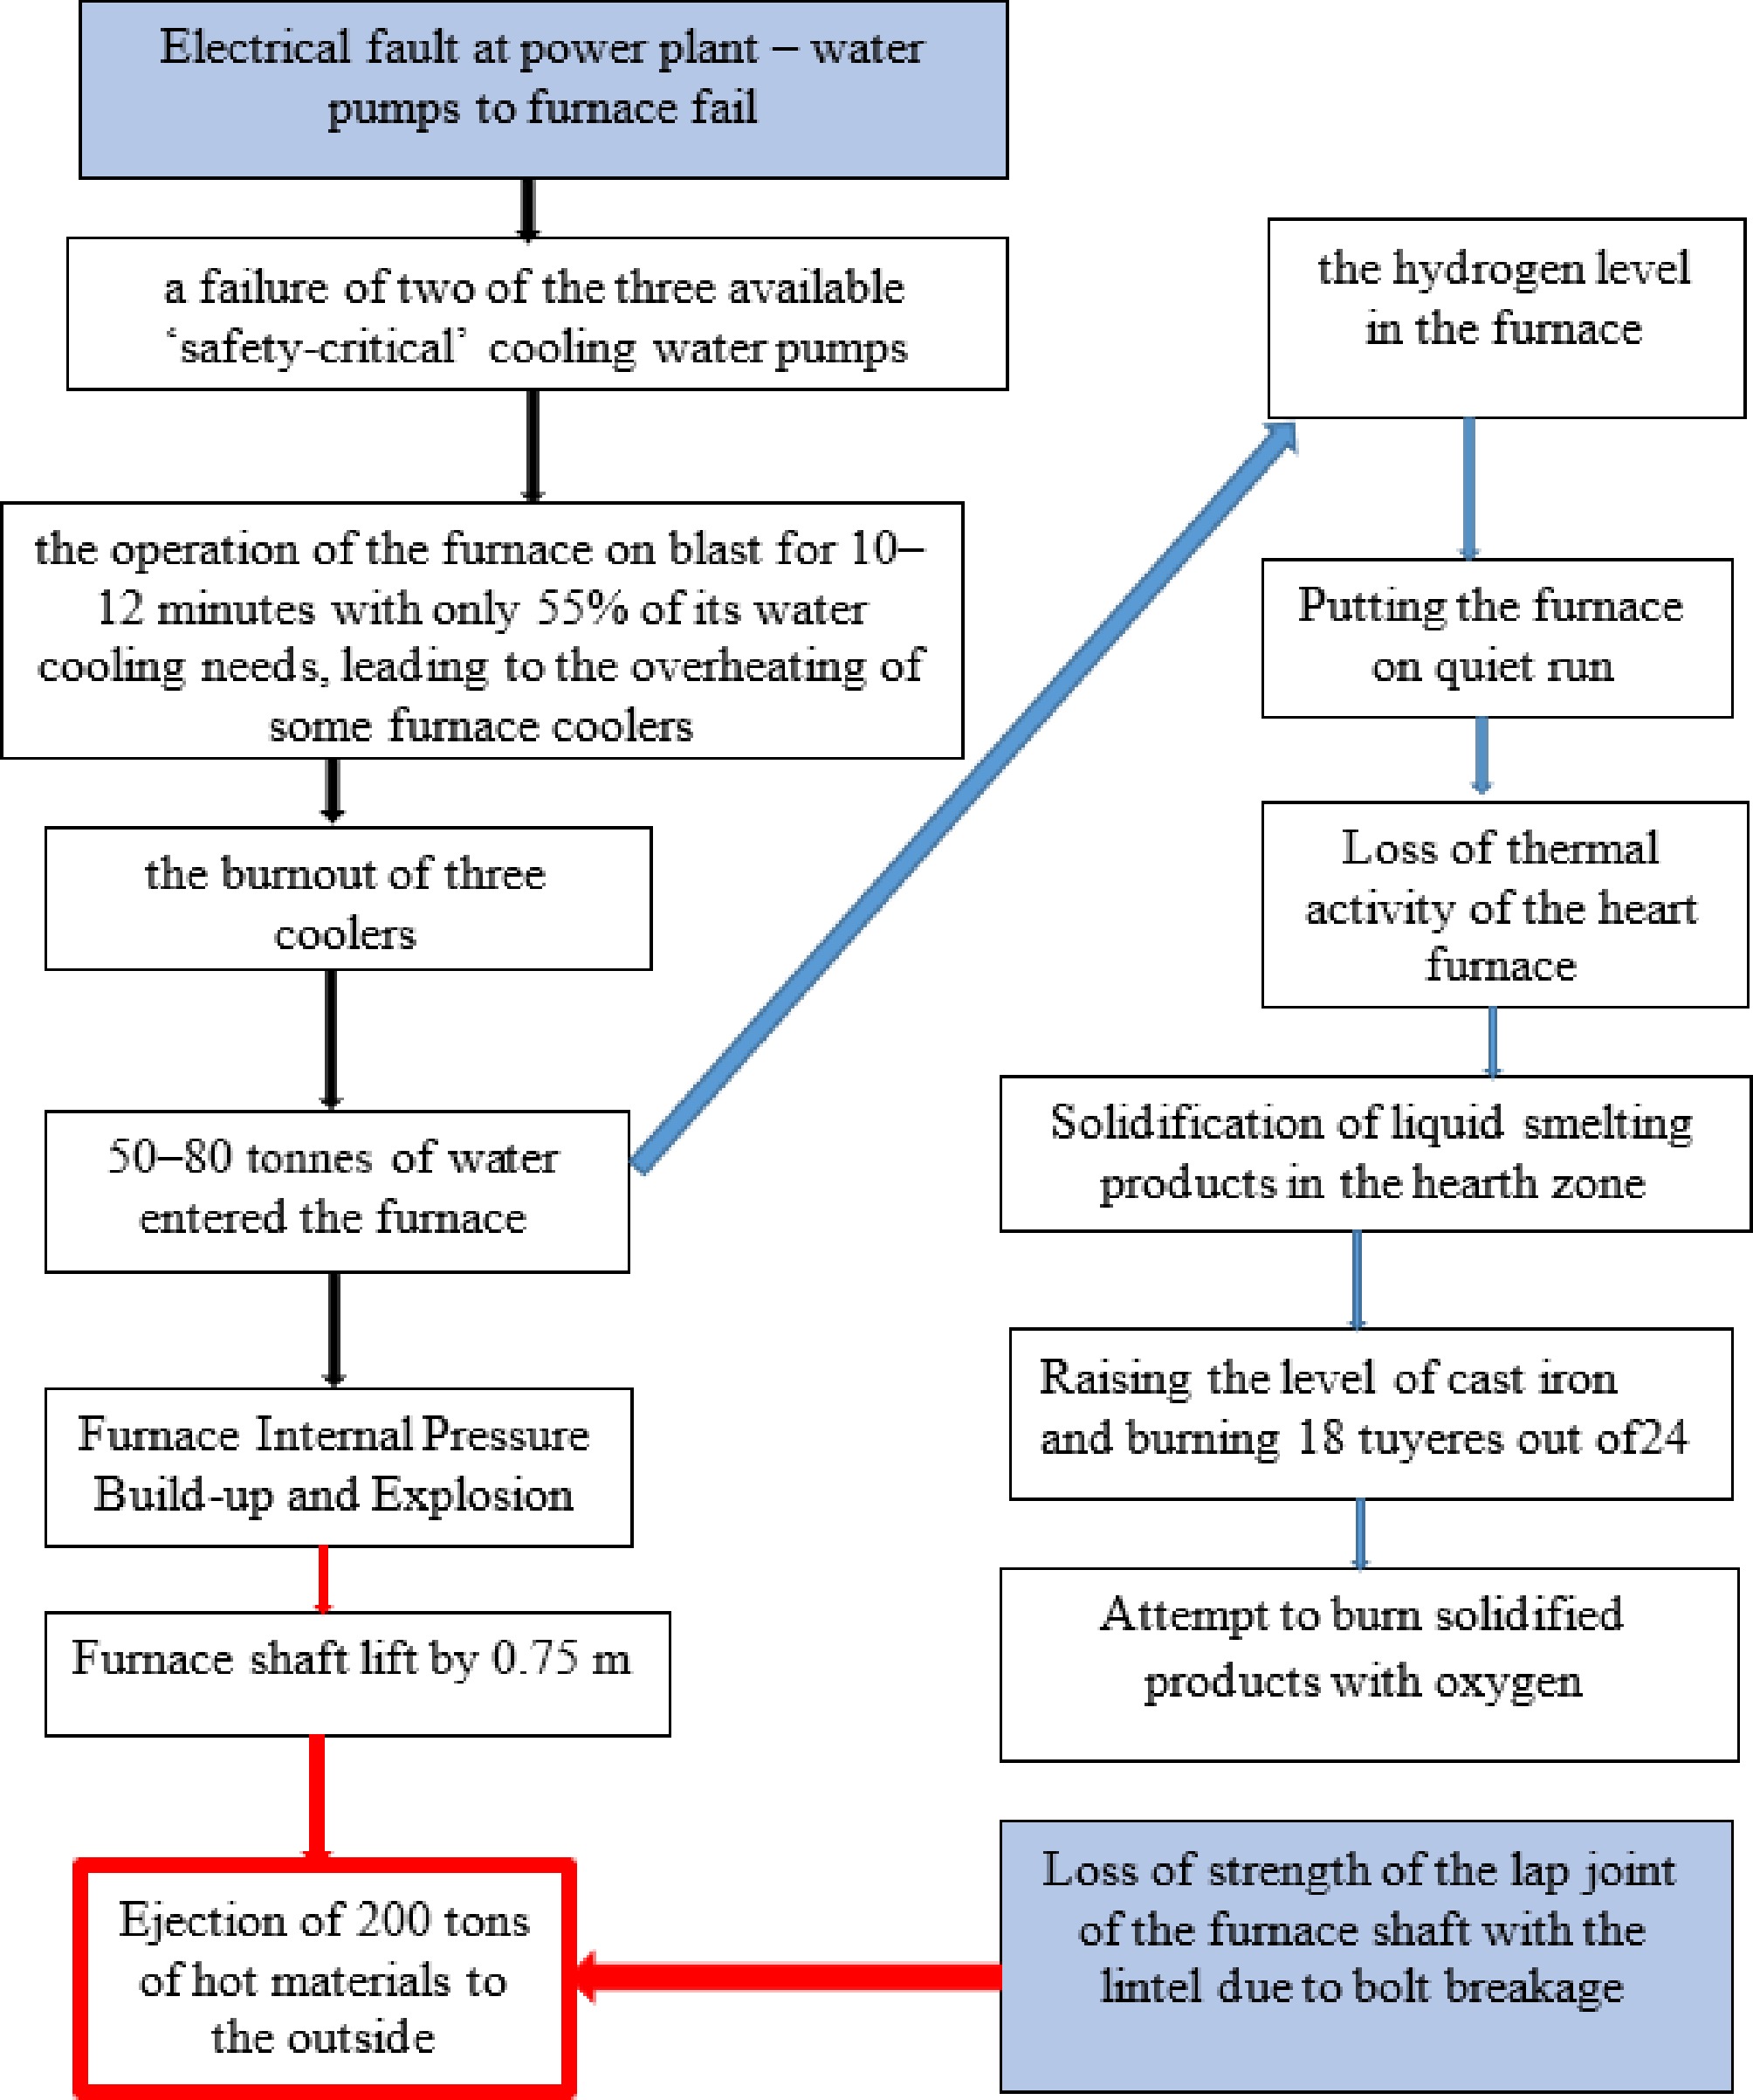
Figure 5.
Scenario of the accident at the blast furnace in Wales.
Figures
(5)
Tables
(0)