-
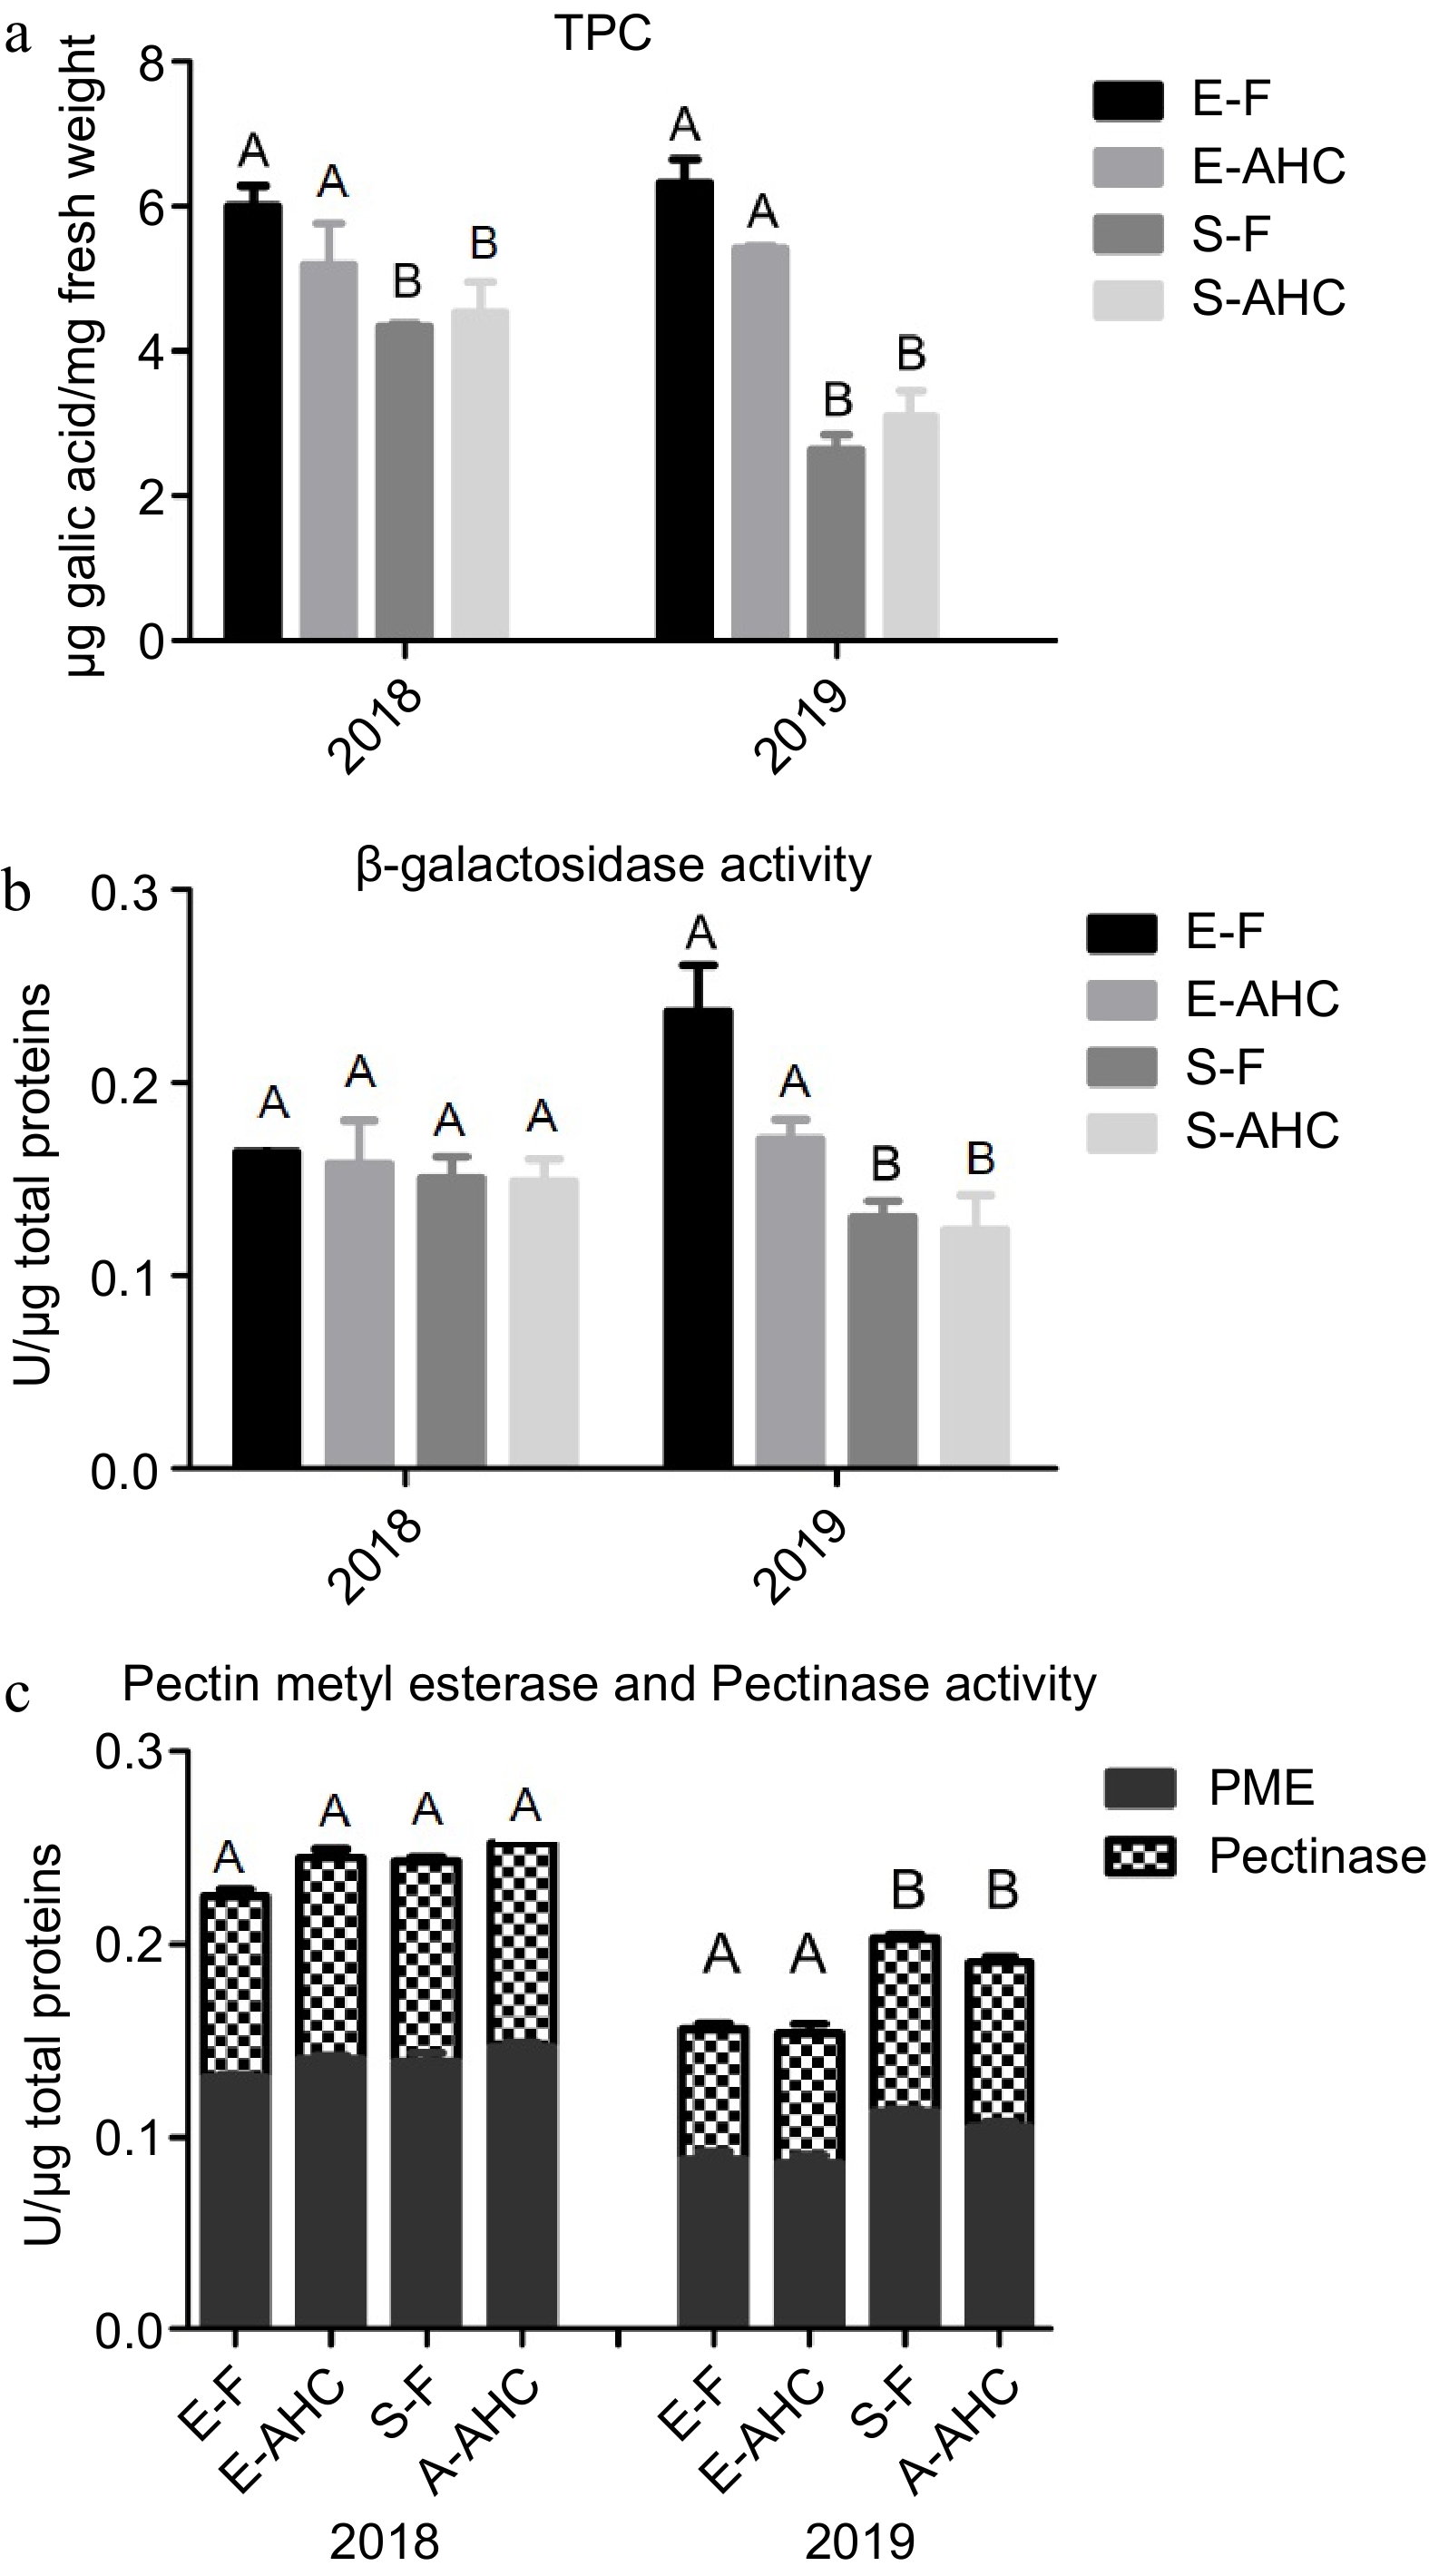
Figure 1.
Total phenolic content and enzymatic activities of cell wall related enzymes in mature blueberries from 'Emerald' and 'Snowchaser' throughout the 2018 and 2019 growing seasons. (a) Total phenolic content. (b) β-gal activity. (c) PME and Pectinase activities (for further information, see Material and methods). E-AHC: 'Emerald' grown under anti-hail cover; E-F: 'Emerald' grown in the field; S-AHC: 'Snowchaser' grown under anti-hail cover; S-F: 'Snowchaser' grown in the field. The values are the mean and standard deviation of at least three replicates per cultivar in the 2018 and 2019 seasons. Significant differences (p < 0.5) between varieties are denoted by capital letters. In either season, no significant changes were recorded between treated and untreated fruit.
-
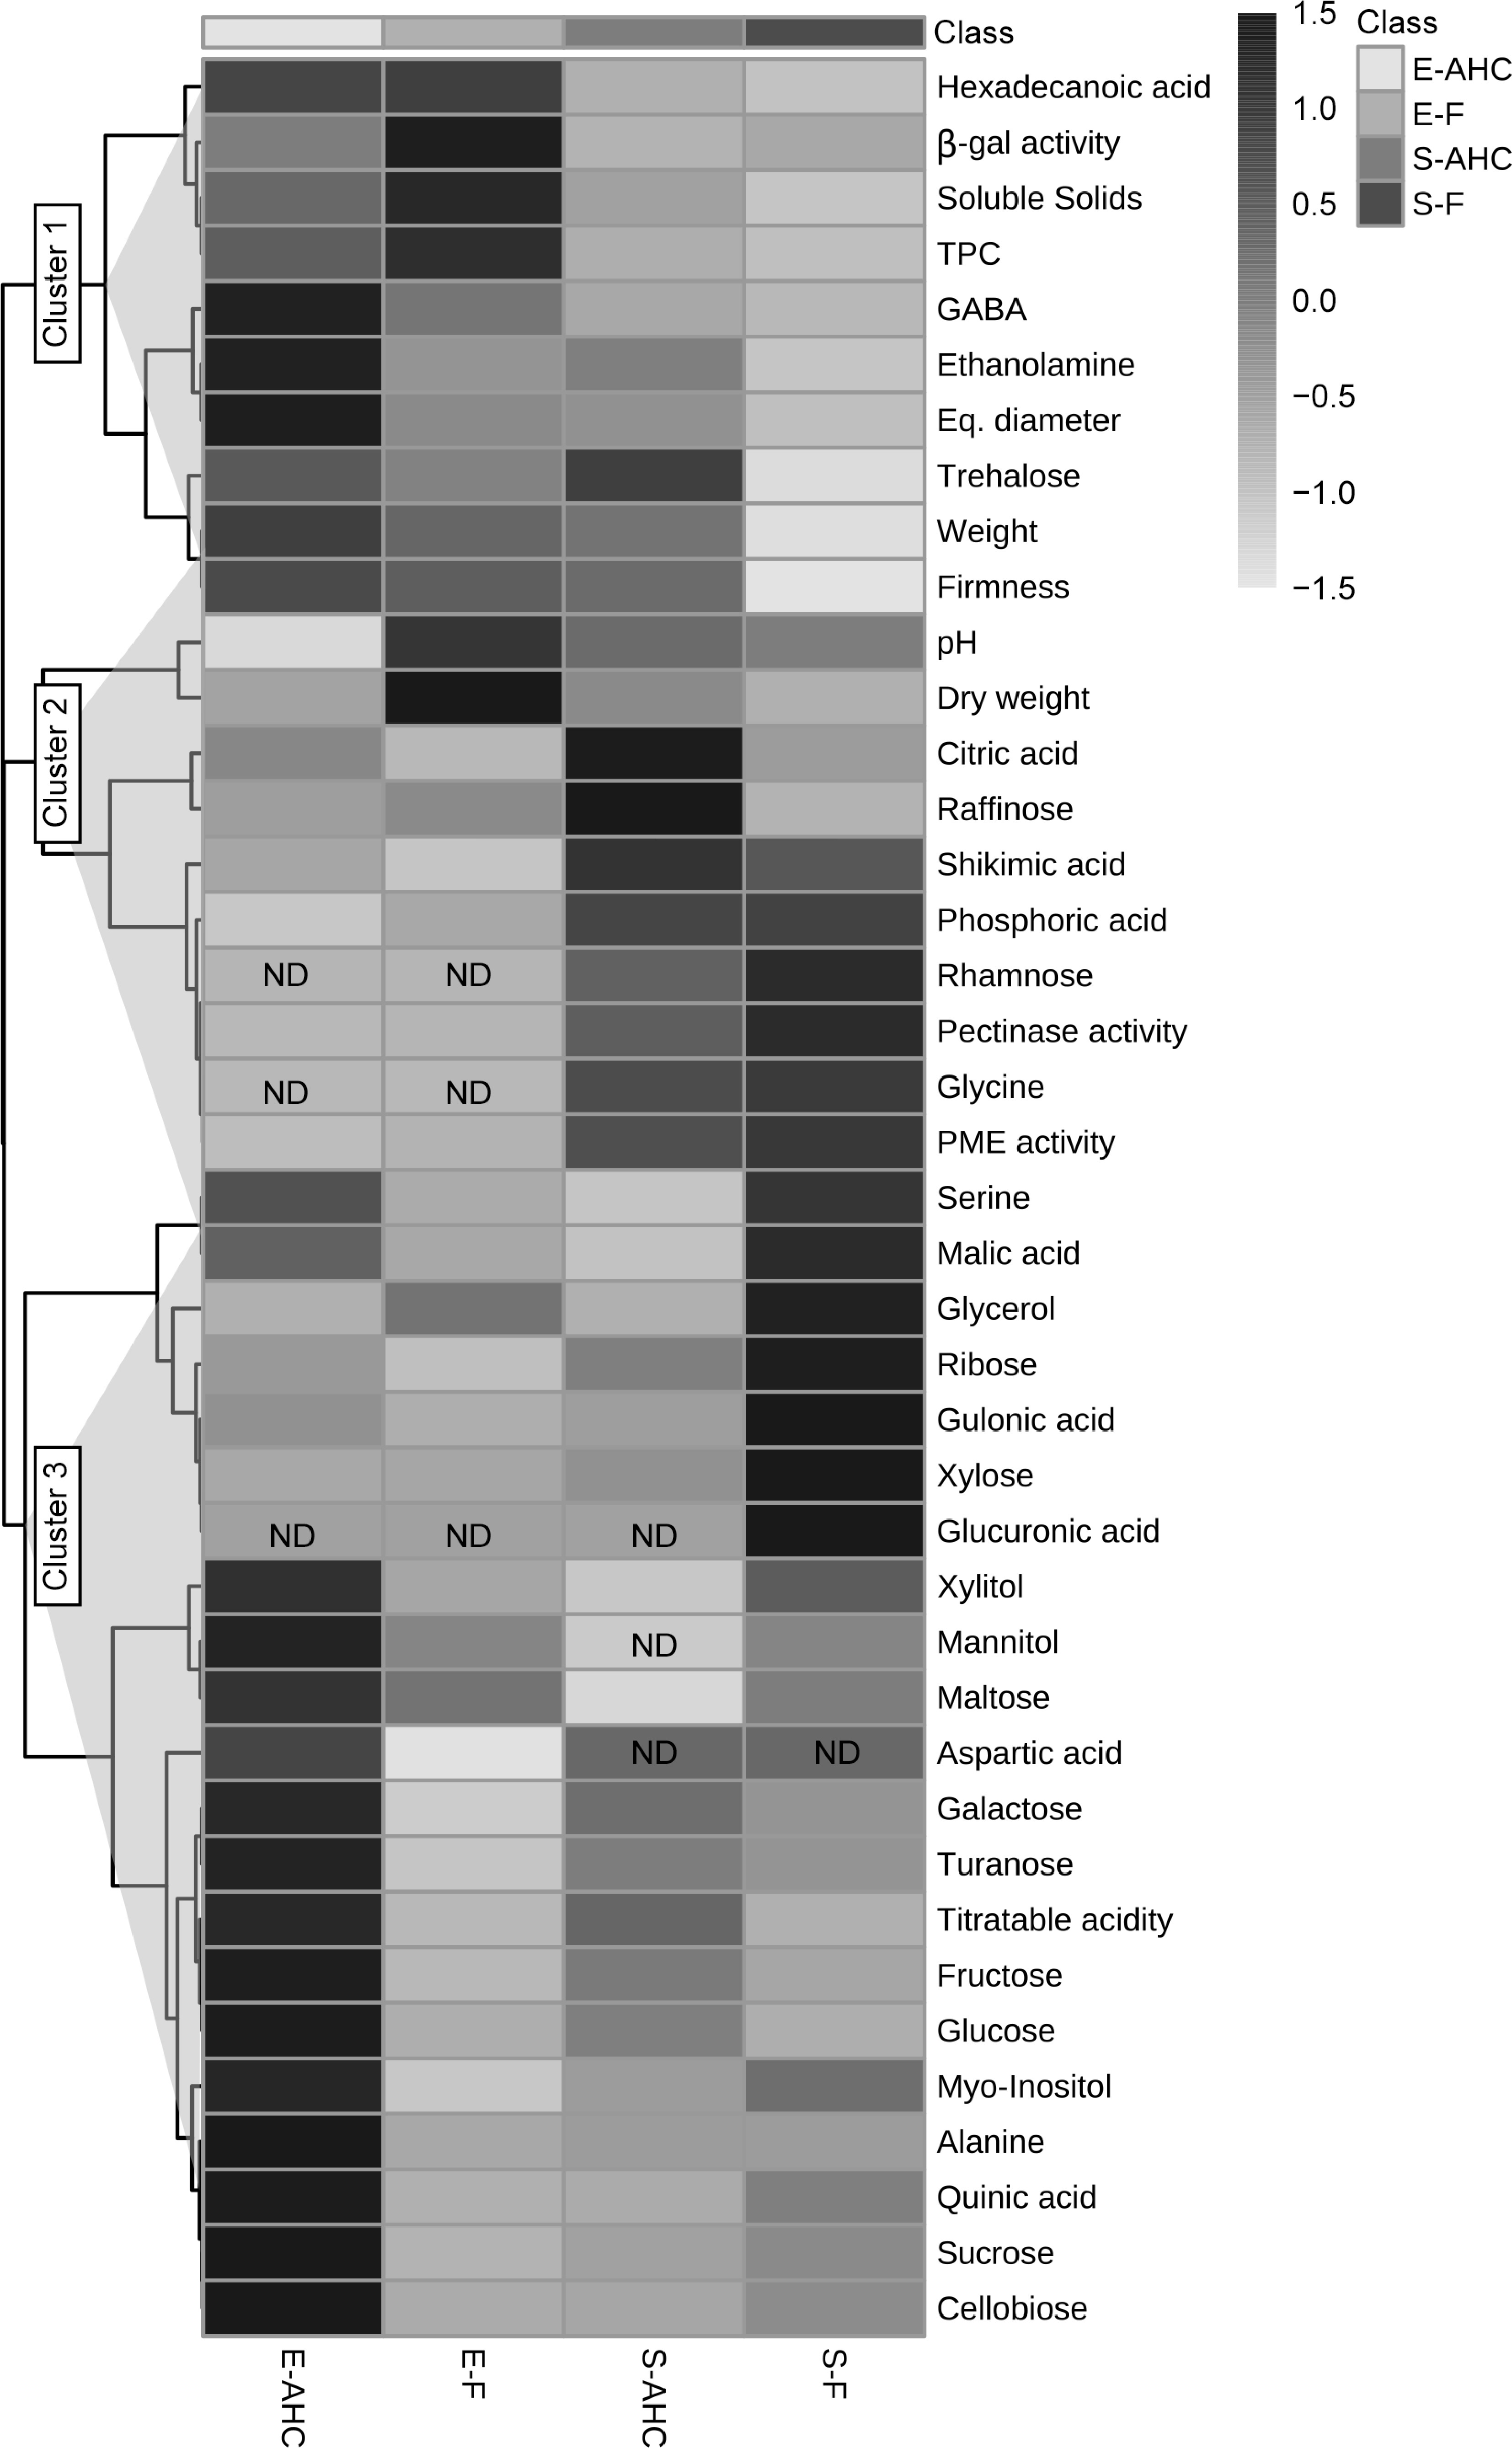
Figure 2.
Heatmap depicting metabolite levels, variations in cell wall-associated enzyme activity, and quality parameters in blueberries cultivated under different conditions. E-AHC: 'Emerald' grown under anti-hail cover; E-F: 'Emerald' grown in the field; S-AHC: 'Snowchaser' grown under anti-hail cover; S-F: 'Snowchaser' grown in the field. Clusters 1, 2, and 3 are further described in the text. Normalized data values are displayed on a grey scale (shown to the right of the figure) and are proportional to the content of each metabolite. Values from three separate determinations were normalized and examined as specified in the Materials and methods. ND indicates chemicals that were not detected in the sample.
-
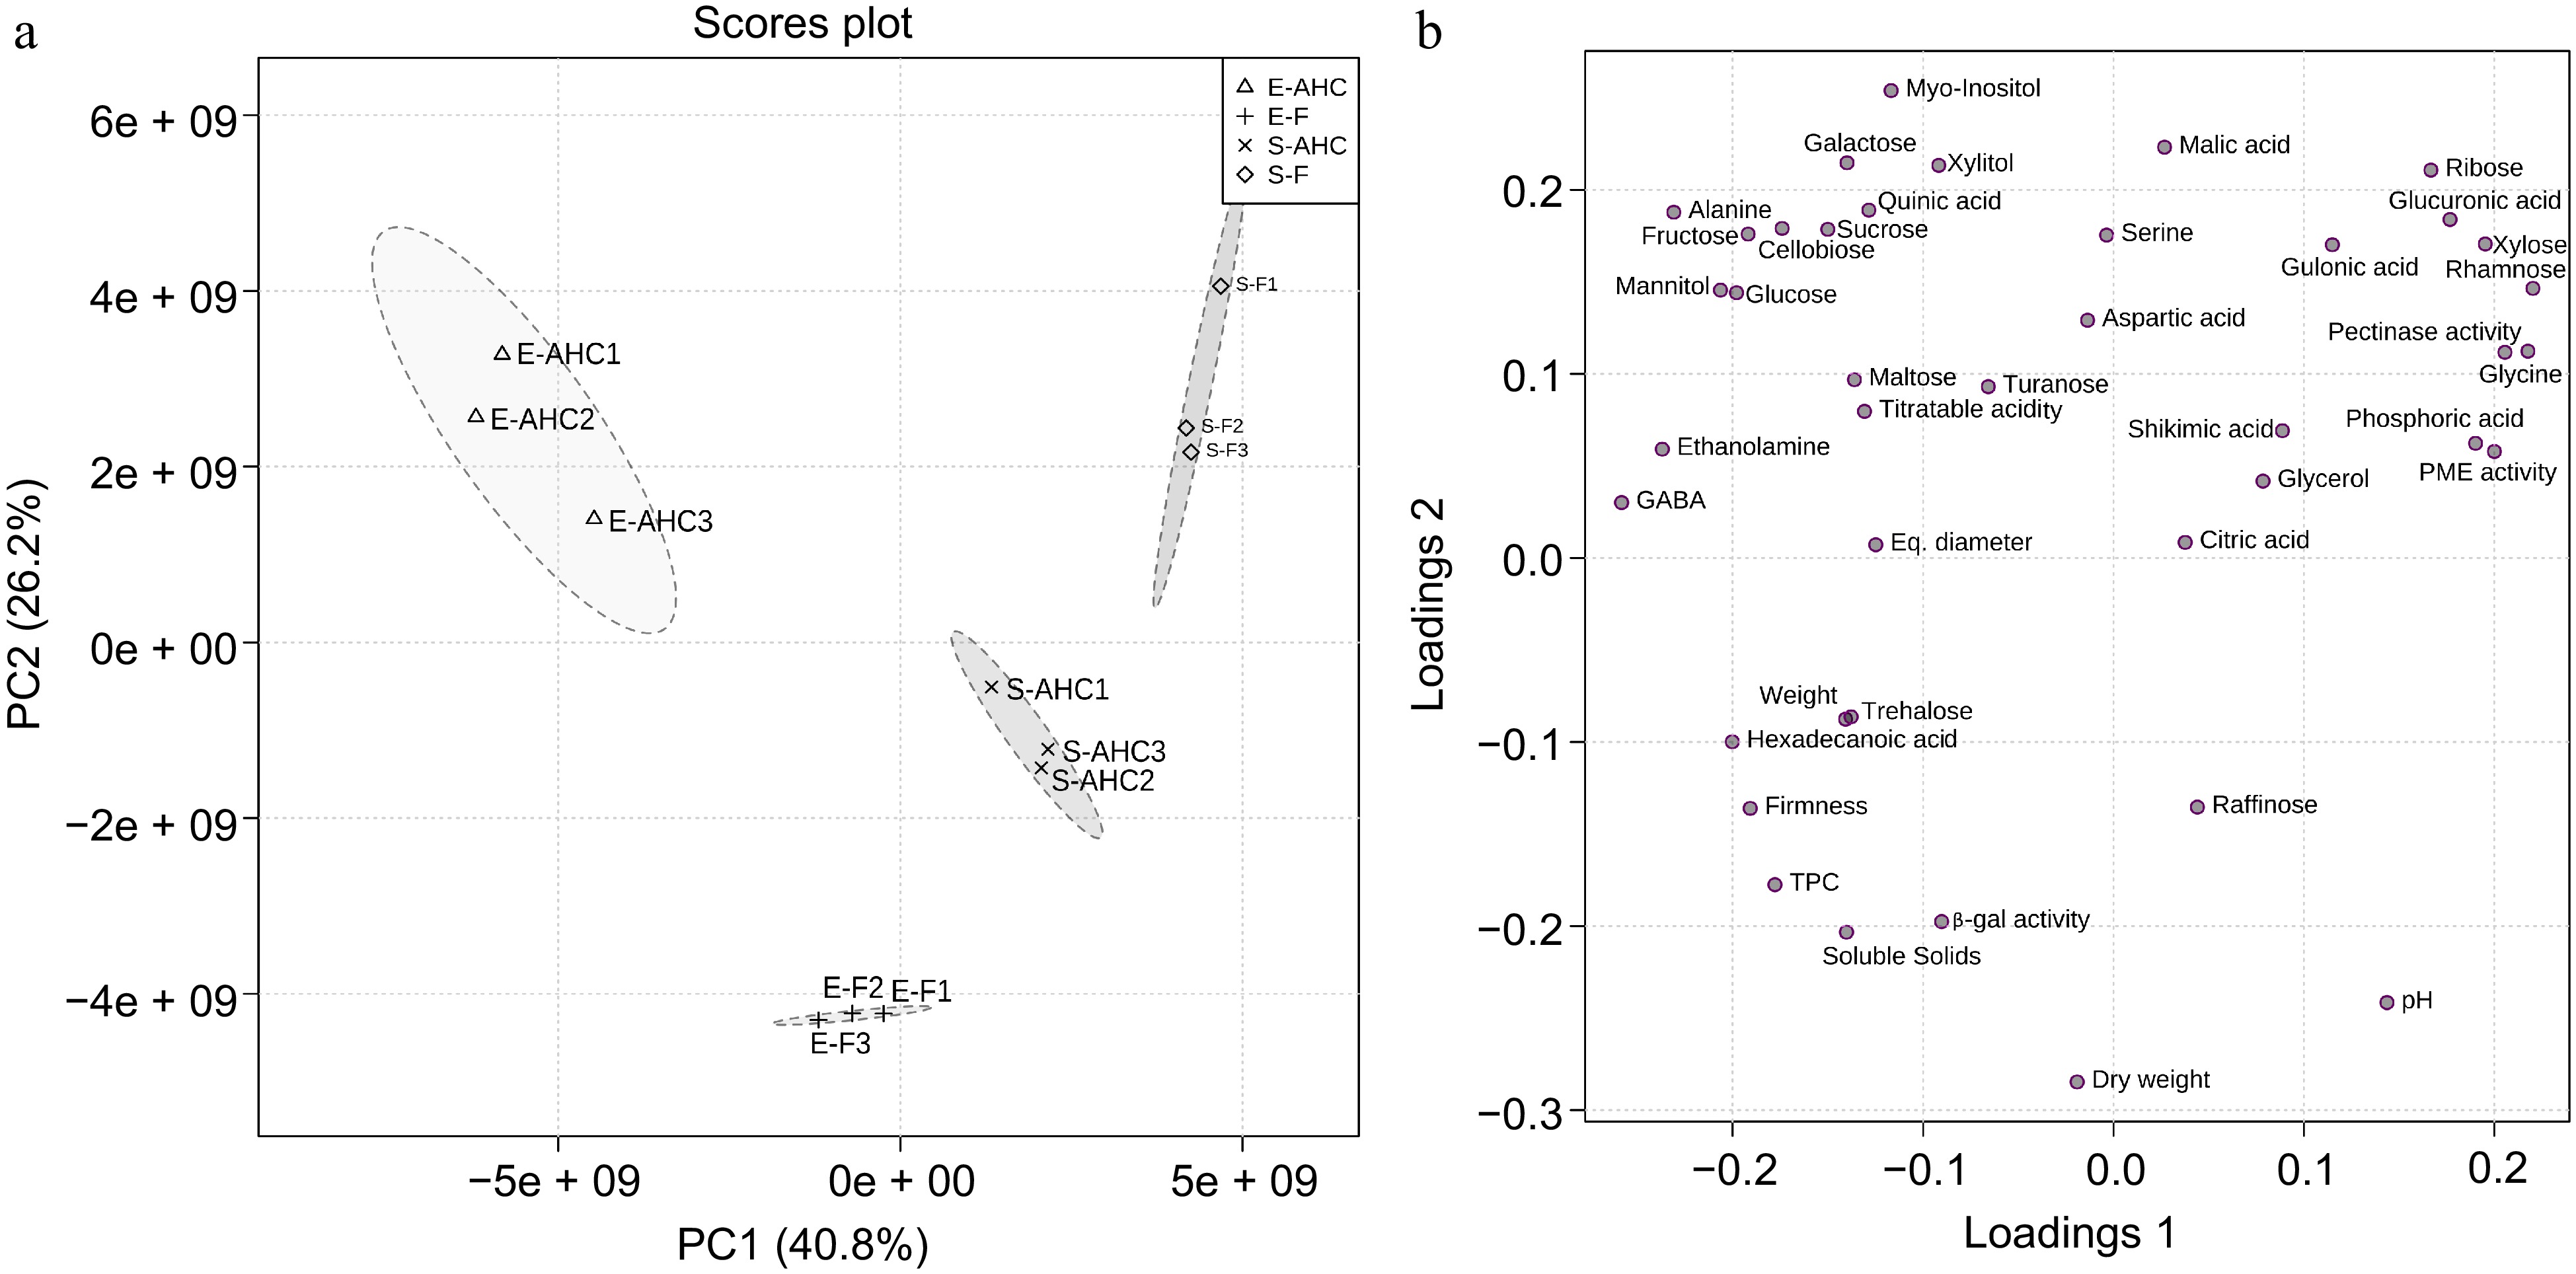
Figure 3.
Principal components analyses (PCA). PCA was modeled on the standardized data matrix for z-score to observe its grouping trend. The data matrix of each group was analyzed by unsupervised PCA. (a) PC1 and PC2 with the (b) related loading plot. Each component's contribution is indicated as a percentage (%). E-AHC: 'Emerald' under anti-hail cover; E-F: 'Emerald' grown in the field; S-AHC: 'Snowchaser' under anti-hail cover; S-F: 'Snowchaser' grown in the field.
-
Agronomic parameter E-F E-AHC S-F S-AHC Season 2018 Soluble solids (SS, °Brix) 12.0 ± 0.2 (a, A) 11.9 ± 0.2 (a, A) 12.8 ± 0.3 (a, B) 11.3 ± 0.5 (b, B) Titratable acidity (TA,% acid) 1.44 ± 0.07 (a, A) 1.51 ± 0.22 (a, A) 1.01± 0.04 (a, B) 1.38 ± 0.11 (b, A) SS/TA ratio 8.3 ± 0.46 (a, A) 7.9 ± 1.2 (a, A) 12.7 ± 0.8 (a, B) 8.2 ± 1.1 (b, A) pH 2.65 ± 0.10 (a, A) 2.61 ± 0.01 (a, A) 2.87 ± 0.05 (a, A) 2.77 ± 0.14 (a, A) Equatorial diameter (mm) 16.44 ± 0.73 (a, A) 17.59 ± 1.21 (b, A) 16.44 ± 0.80 (a, A) 16.08 ± 0.60 (b, B) Weight (g) 1.63 ± 0.10 (a, A) 1.43 ± 0.20 (a, A) 1.53 ± 0.02 (a, A) 1.52 ± 0.06 (a, A) Dry matter content (%) 12.97 ± 0.14 (a, A) 12.97 ± 0.12 (a, A) 12.63 ± 0.17 (a, A) 12.03 ± 0.52 (a, B) Firmness (N) 1.83 ± 0.23 (a, A) 2.16 ± 0.30 (b, A) 1.60 ± 0.20 (a, B) 1.83 ± 0.23 (b, B) Season 2019 Soluble solids (SS, °Brix) 13.4 ± 1.4 (a, A) 12.5 ± 0.9 (a, A) 9.9 ± 1.1 (a, B) 10.1 ± 0.8 (a, A) Titratable acidity (TA,% acid) 0.88 ± 0.11 (a, A) 1.13 ± 0.03 (b, A) 0.90±0.08 (a, A) 1.05 ± 0.08 (a, A) SS/TA ratio 15.22 ± 1.9 (a, A) 11.06 ± 1.0 (b, A) 11 ± 0.6 (a, B) 9.6 ± 0.3 (b, B) pH 2.87 ± 0.04 (a, A) 2.67 ± 0.01 (b, A) 2.79 ± 0.06 (a, A) 2.82 ± 0.05 (a, A) Equatorial diameter (mm) 14.82 ± 0.18 (a, A) 15.15 ± 0.58 (a, A) 15.43 ± 0.73 (a, A) 15.04 ± 1.06 (a, A) Weight (g) 1.72 ± 0.04 (a, A) 1.76 ± 0.15 (a, A) 1.76 ± 0.09 (a, A) 1.73 ± 0.06 (a, A) Dry matter content (%) 13.70 ± 0.04 (a, A) 11.99 ± 0.62 (b, A) 11.92 ± 0.04 (a, B) 12.42 ± 0.24 (a, A) Firmness (N) 2.19 ± 0.24 (a, A) 2.24 ± 0.21 (a, A) 1.86 ± 0.22 (a, B) 2.16 ± 0.30 (b, A) F: Field growth; AHC: Anti-hail cover growth. Different letters indicate significant differences (p < 0.5) between treatments for the same variety (lowercase letters) or between varieties with the same treatment condition (capital letters). The quantities in bold indicate major seasonal changes. The values are the mean and standard deviation of at least three replicates. Table 1.
Blueberry agronomic parameters. Data for the cvs 'Emerald' and 'Snowchaser' were obtained throughout the 2018 and 2019 seasons.
-
Metabolites E-F E-AHC S-F S-AHC Sugars Cellobiose 12.90 ± 0.60 (a, A) 20.20 ± 0.80 (b, A) 14.2 ± 0.20 (a, B) 12.90 ± 0.20 (b, B) Fructose 328.24 ± 5.83 (a, A) 433.81 ± 79.74 (b, A) 338.43 ± 3.31 (a, B) 385.59 ± 27.60 (a, A) Galactose 234.01 ± 17.42 (a, A) 322.86 ± 66.09 (a, A) 272.90 ± 0.91 (a, B) 298.73 ± 9.97 (b, A) Glucose 588.96 ± 11.86 (a, A) 821.06 ± 163.92 (a, A) 619 ± 2.79 (a, B) 708.09 ± 62.58 (a, A) Maltose 77.10 ± 2.90 (a, A) 87.9 ± 3.00 (b, A) 73.8 ± 5.80 (a, A) 57.4 ± 6.70 (b, B) Raffinose 1.60 ± 0.06 (a, A) 0.90 ± 0.05 (b, A) 1.1 ± 0.20 (a, B) 2.60 ± 0.40 (b, B) Rhamnose ND ND 0.33 ± 0.08 (a, B) 0.22 ± 0.05 (b, B) Ribose 0.51 ± 0.09 (a, A) 0.61 ± 0.01 (a, A) 1.73 ± 0.13 (a, B) 0.95 ± 0.18 (b, B) Sucrose 49.98 ± 1.29 (a, A) 70.00 ± 7.86 (b, A) 54.94 ± 3.12 (a, B) 48.03 ± 0.27 (b, B) Trehalose 12.36 ± 0.09 (a, A) 16.73 ± 3.35 (b, A) 3.79 ± 0.30 (a, B) 17.24 ± 2.93 (b, A) Turanose 18.79 ± 0.30 (a, A) 22.76 ± 2.32 (b, A) 19.51 ± 2.13 (a, A) 21.69 ± 1.59 (a, A) Xylose 2.61 ± 0.09 (a, A) 2.58 ± 0.02 (a, A) 9.55 ± 1.11 (a, B) 3.32 ± 0.88 (b, A) Sugar alcohols Xylitol 1.30 ±0.13 (a, A) 1.67 ± 0.13 (b, A) 1.54 ±0.16 (a, A) 1.20 ± 0.05 (b, B) Glycerol 0.52 ± 0.05 (a, A) 0.44 ± 0.05 (a, A) 0.55 ± 0.04 (a, A) 0.42 ± 0.03 (b, A) Mannitol 5.22 ± 0.17 (a, A) 10.92 ± 1.45 (b, A) 4.75 ± 0.09 (a, B) ND Myo-Inositol 26.11 ± 0.37 (a, A) 36.08 ± 1.67 (b, A) 30.36 ± 3.28 (a, A) 28.41 ± 0.14 (a, B) Organic acids Citric acid 93.72 ± 4.73 (a, A) 110.23 ± 1.66 (b, A) 102.76 ± 1.65 (a, A) 168.91 ± 9.69 (a, B) Gulonic acid 0.10 ± 0.02 (a, A) 0.17 ± 0.02 (b, A) 0.27 ± 0.05 (a, B) 0.14 ± 0.02 (b, A) Malic acid 0.56 ± 0.04 (a, A) 0.64 ± 0.06 (b, A) 0.72 ± 0.12 (a, A) 0.56 ± 0.04 (a, A) Phosphoric acid 2.73 ± 0.15 (a, A) 2.64 ± 0.02 (a, A) 3.66 ± 0.60 (a, A) 3.69 ± 0.47 (a, B) Quinic acid 34.02 ± 0.06 (a, A) 40.22 ± 1.98 (b, A) 35.87 ± 4.19 (a, A) 33.41 ± 0.71 (a, B) Shikimic acid 1.24 ± 0.12 (a, A) 1.28 ± 0.03 (a, A) 1.38 ± 0.17 (a, A) 1.52 ± 0.03 (a, B) Amino acids Alanine 0.18 ± 0.03 (a, A) 0.56 ± 0.06 (b, A) 0.21 ± 0.03 (a, A) 0.20 ± 0.028 (a, B) Aspartic acid 0.20 ± 0.03 (a, A) 0.28 ± 0.00 (b, A) ND ND GABA 0.44 ± 0.04 (a, A) 0.61 ± 0.04 (b, A) 0.29 ± 0.03 (a, B) 0.32 ± 0.02 (a, B) Glycine ND ND 0.14 ± 0.04 (a, B) 0.11 ±0.03 (a, B) Serine 0.17 ± 0.02 (a, A) 0.20 ± 0.00 (b, A) 0.19 ±0.02 (a, A) 0.15 ±0.02 (b, B) Others Ethanolamine 0.32 ± 0.02 (a, A) 0.46 ± 0.01 (a, A) 0.28 ± 0.06 (a, A) 0.33 ± 0.06 (a, B) Glucuronic acid ND ND 0.16 ± 0.03 (a, B) ND Hexadecanoic acid 3.66 ± 0.23 (a, A) 3.67 ± 0.24 (a, A) 0.52 ± 0.08 (a, B) 0.910 ± 0.02 (b, B) The values show each metabolite's area relative to the standard (ribitol) area, determined per gram of fresh weight and expressed as the mean and standard deviation of at least three replicates. E-AHC: 'Emerald' under anti-hail cover; E-F: 'Emerald' grown in the field; S-AHC: 'Snowchaser' under anti-hail cover; S-F: 'Snowchaser' grown in the field. Different letters indicate significant differences (p < 0.5) between treatments for the same variety (lowercase letters) or between varieties with the same treatment condition (capital letters). ND: Not detected. Table 2.
Metabolites level variation in 'Emerald' and 'Snowchaser' blueberries grown in the field or under anti-hail covers in the 2019 season.
-
Agronomic parameter E-F E-AHC S-F S-AHC 7 d 30 d 7 d 30 d 7 d 30 d 7 d 30 d SS (°Brix) 12.8 a, A 12.7 a, A 10.8 b, A 10.8 b, A 10.8 a, A 10.5 a, A 10.9 a, A 11, 0 a, A TA (% acid) 0.96 a, A 0.93 a, A 1.37 b, A 1.03 b, B 0.80 a, A 0.75 a, A 0.91 a, A 0.83 a, A SS/TA ratio 13.3 a, A 13.7 a, A 7.9 b, A 10.5 b, B 13.5 a, A 14.0 a, A 12.0 a, A 13.3 a, A pH 2.69 a, A 2.96 a, B 2.64 a, A 2.88 a, B 3.02 a 3.05 2.90 b 3.00 a, A Weight loss (%) 0.48 a, A 0.25 a, A 0.70 b, A 0.73 b, A 0.60 a, A 0.10 b, A 0.10 a, A 0.10 a, A Firmness (N) 2.16 a, A 2.64 a, B 2.62 b, A 2.89 b, B 1.92 a, A 2.08 a, A 2.36 b, A 2.55 b, B AHC: Anti-hail cover growth; F: Field growth; 7 d: 7 days of conservation at 0 °C; 30 d: 30 days of conservation at 0 °C. Different letters indicate significant differences (p < 0.5) between treatments for the same variety (lowercase letters) or between conservation periods with the same treatment condition (capital letters). The quantities in bold indicate significant differences between varieties for the same treatment and conservation time. The values are the average of at least three replicates. For all measures, standard errors were less than 15% and were omitted for simplicity. Table 3.
Variation in agronomic parameters during postharvest conservation of 'Emerald' and 'Snowchaser' blueberries grown in the field (F) or under anti-hail cover (AHC) throughout the 2019 growing season.
Figures
(3)
Tables
(3)