-
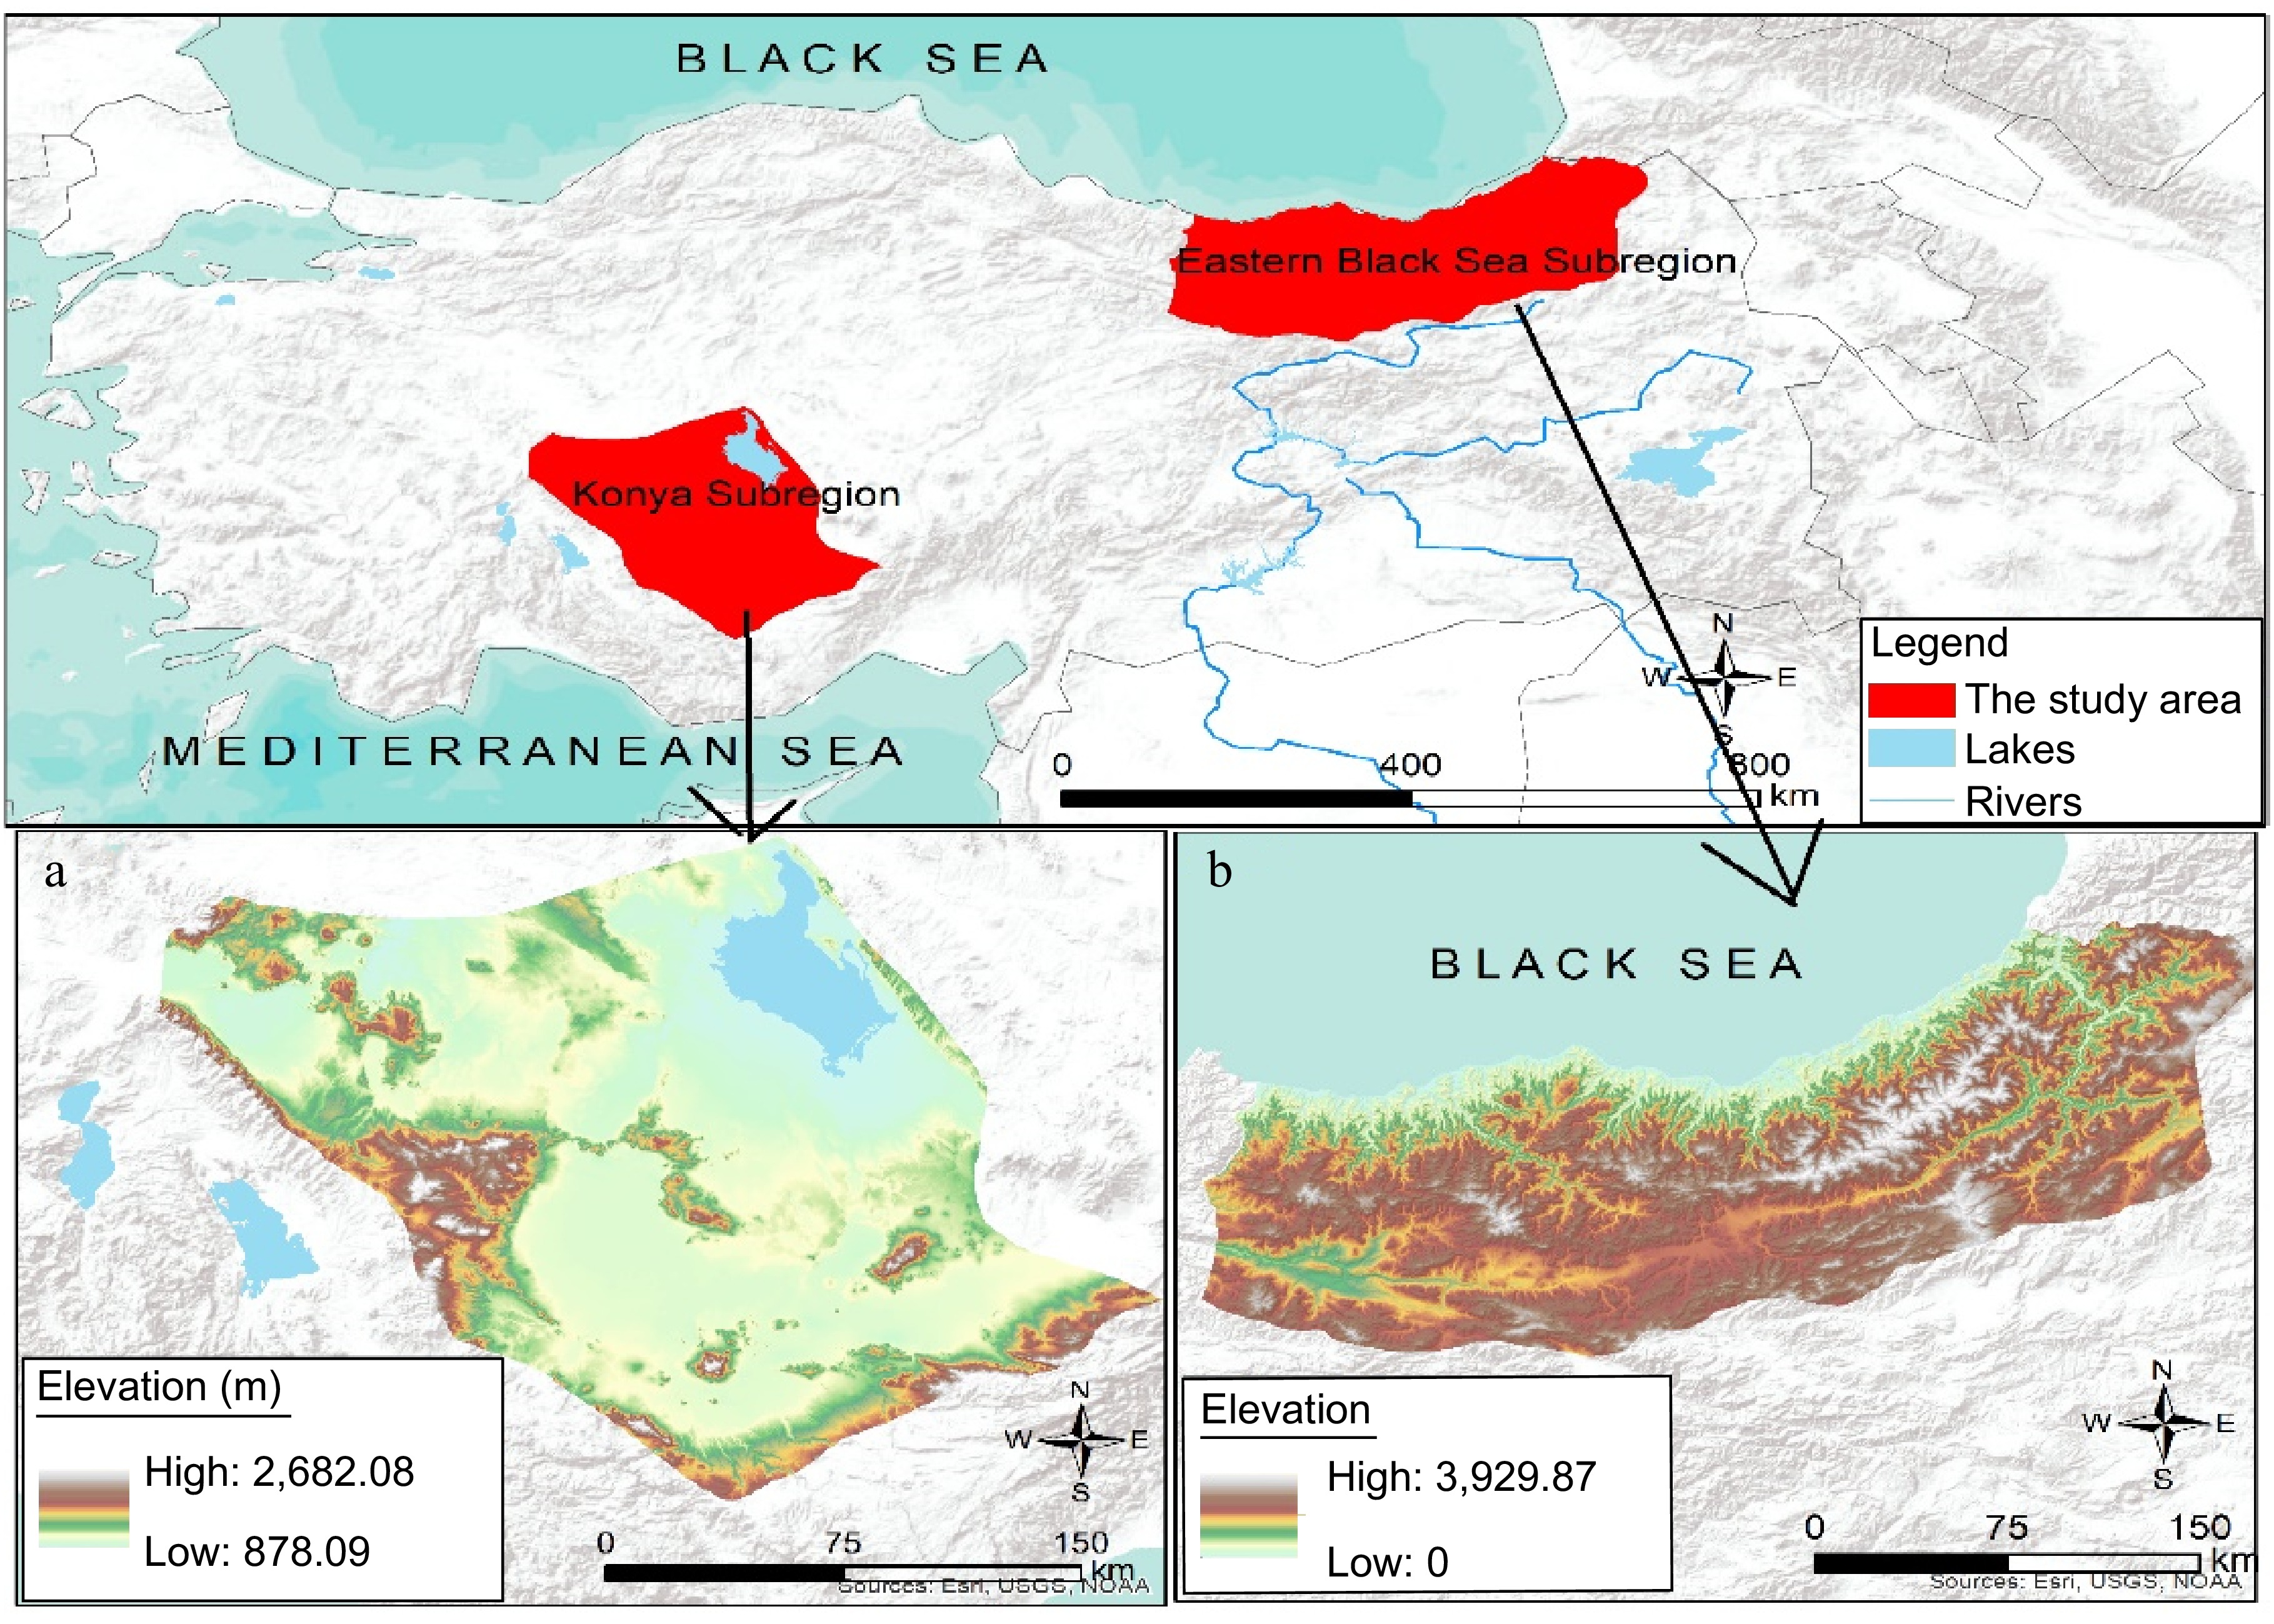
Figure 1.
Location and elevation maps of the study areas: (a) Konya Sub-Region, (b) Eastern Black Sea Sub-Region.
-
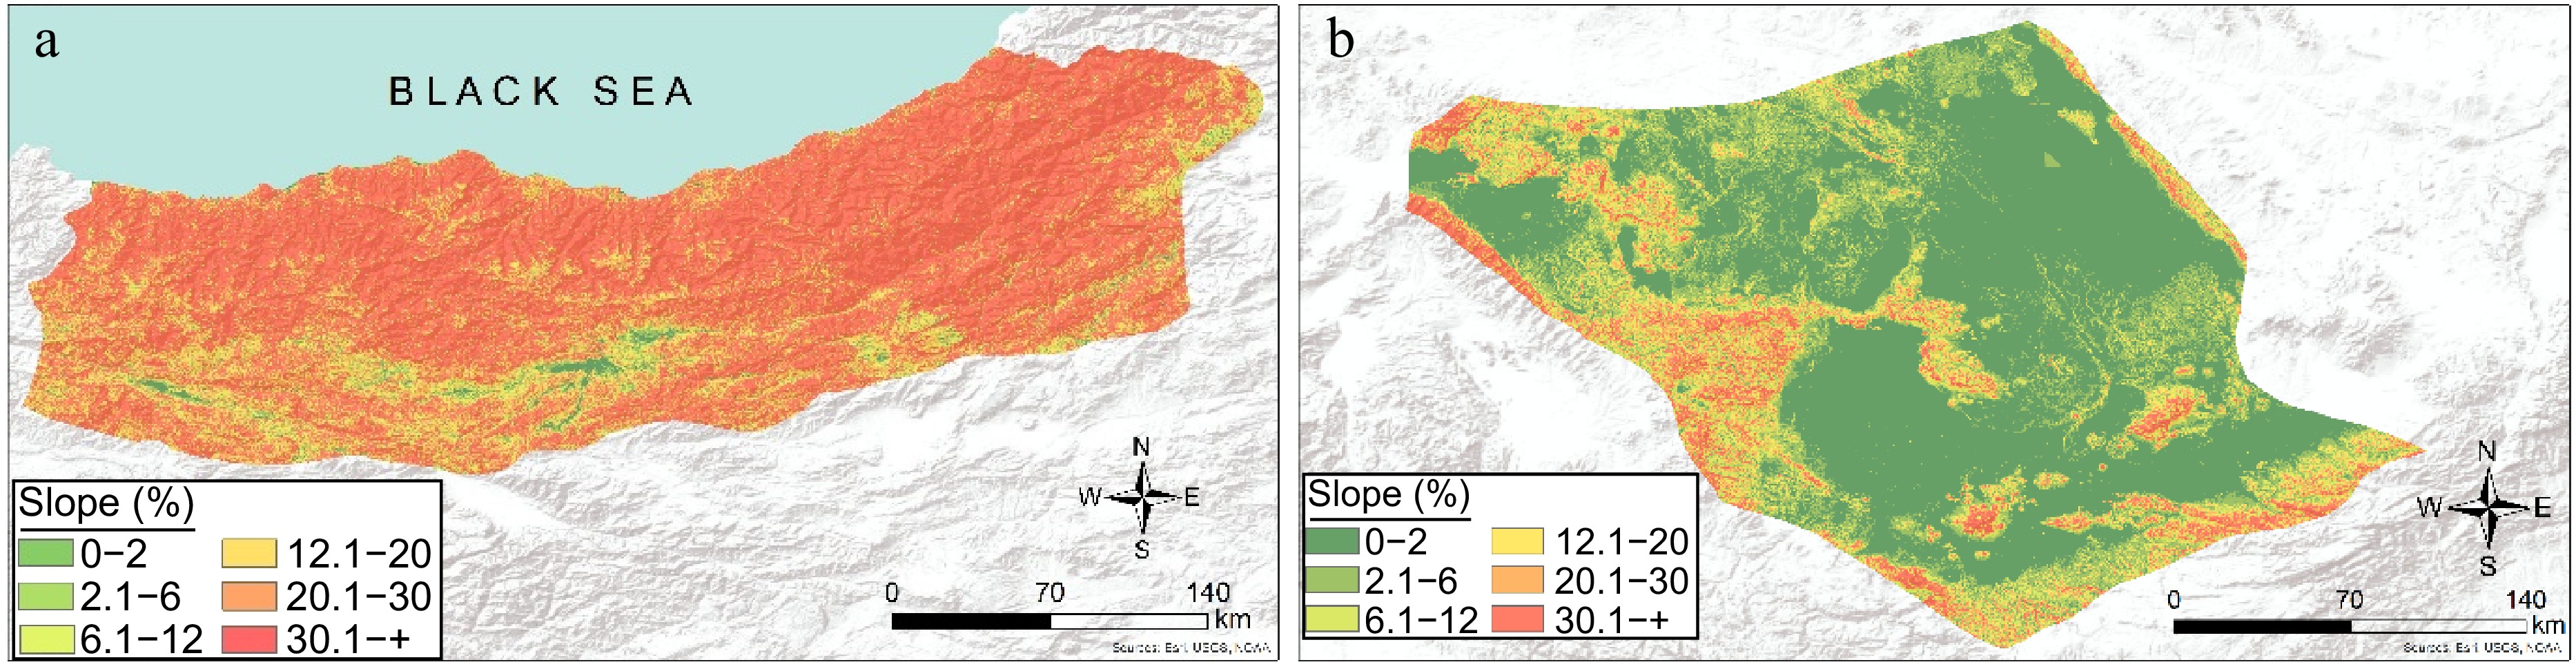
Figure 2.
Slope maps of the study areas: (a) Eastern Black Sea Sub-Region, (b) Konya Sub-Region.
-
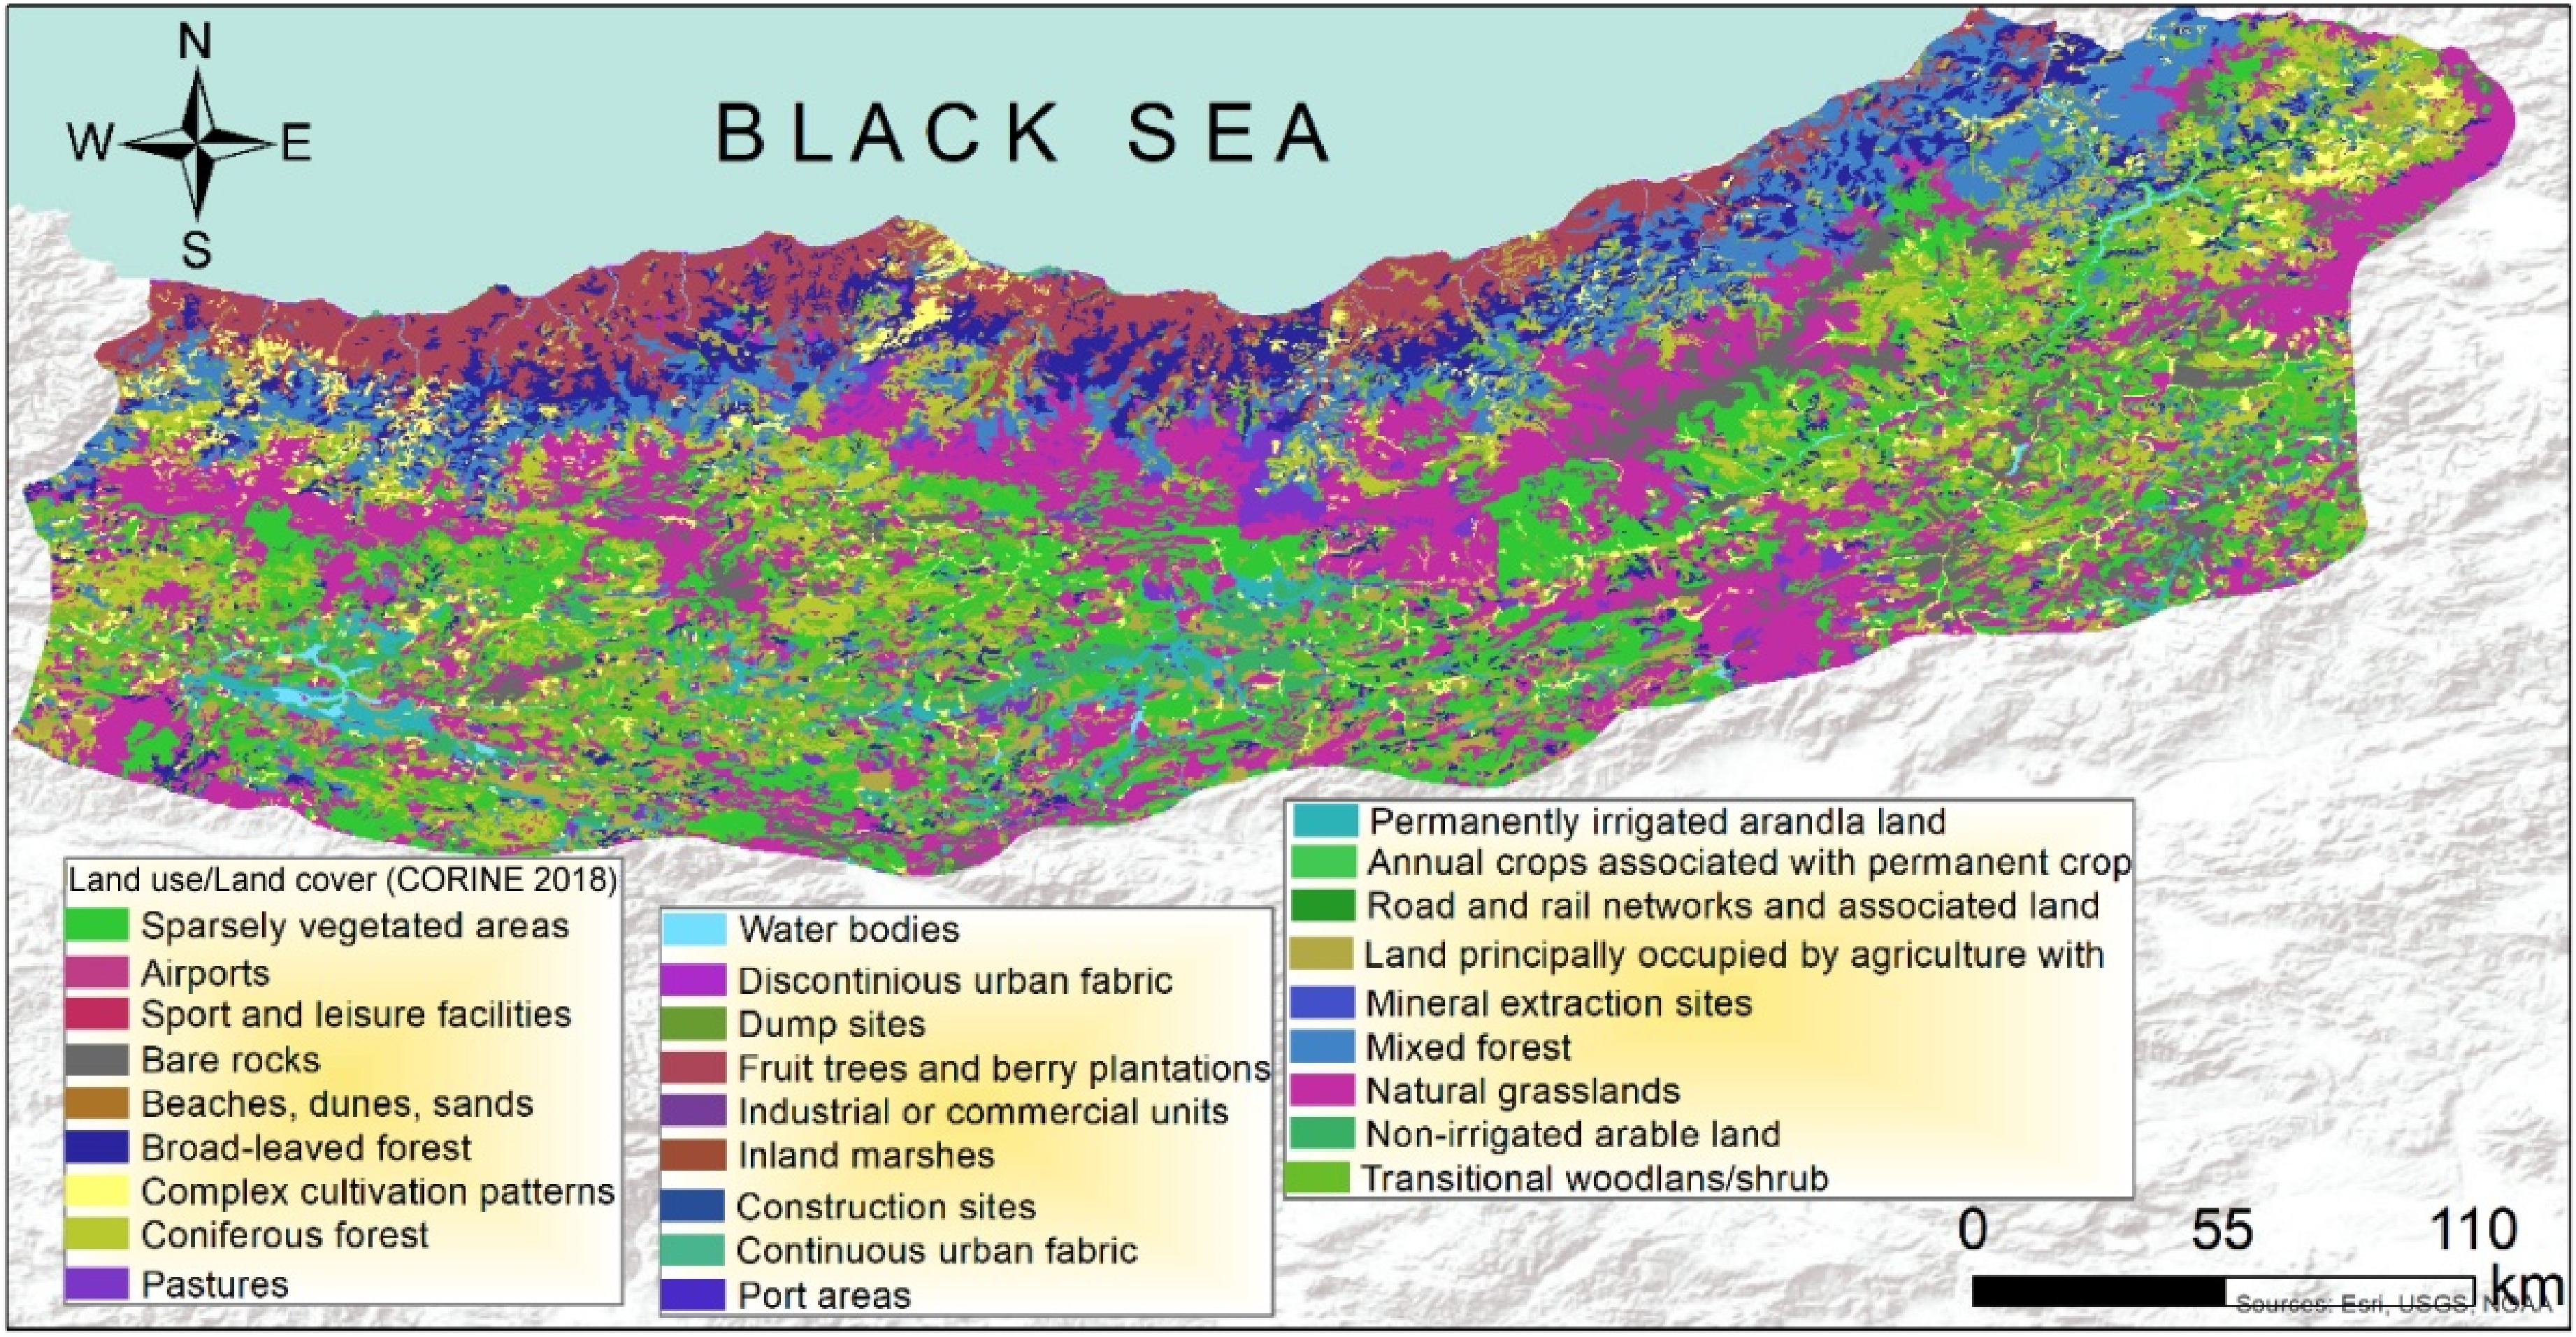
Figure 3.
Land use land cover map of the Eastern Black Sea Sub-Region (CORINE, 2018).
-
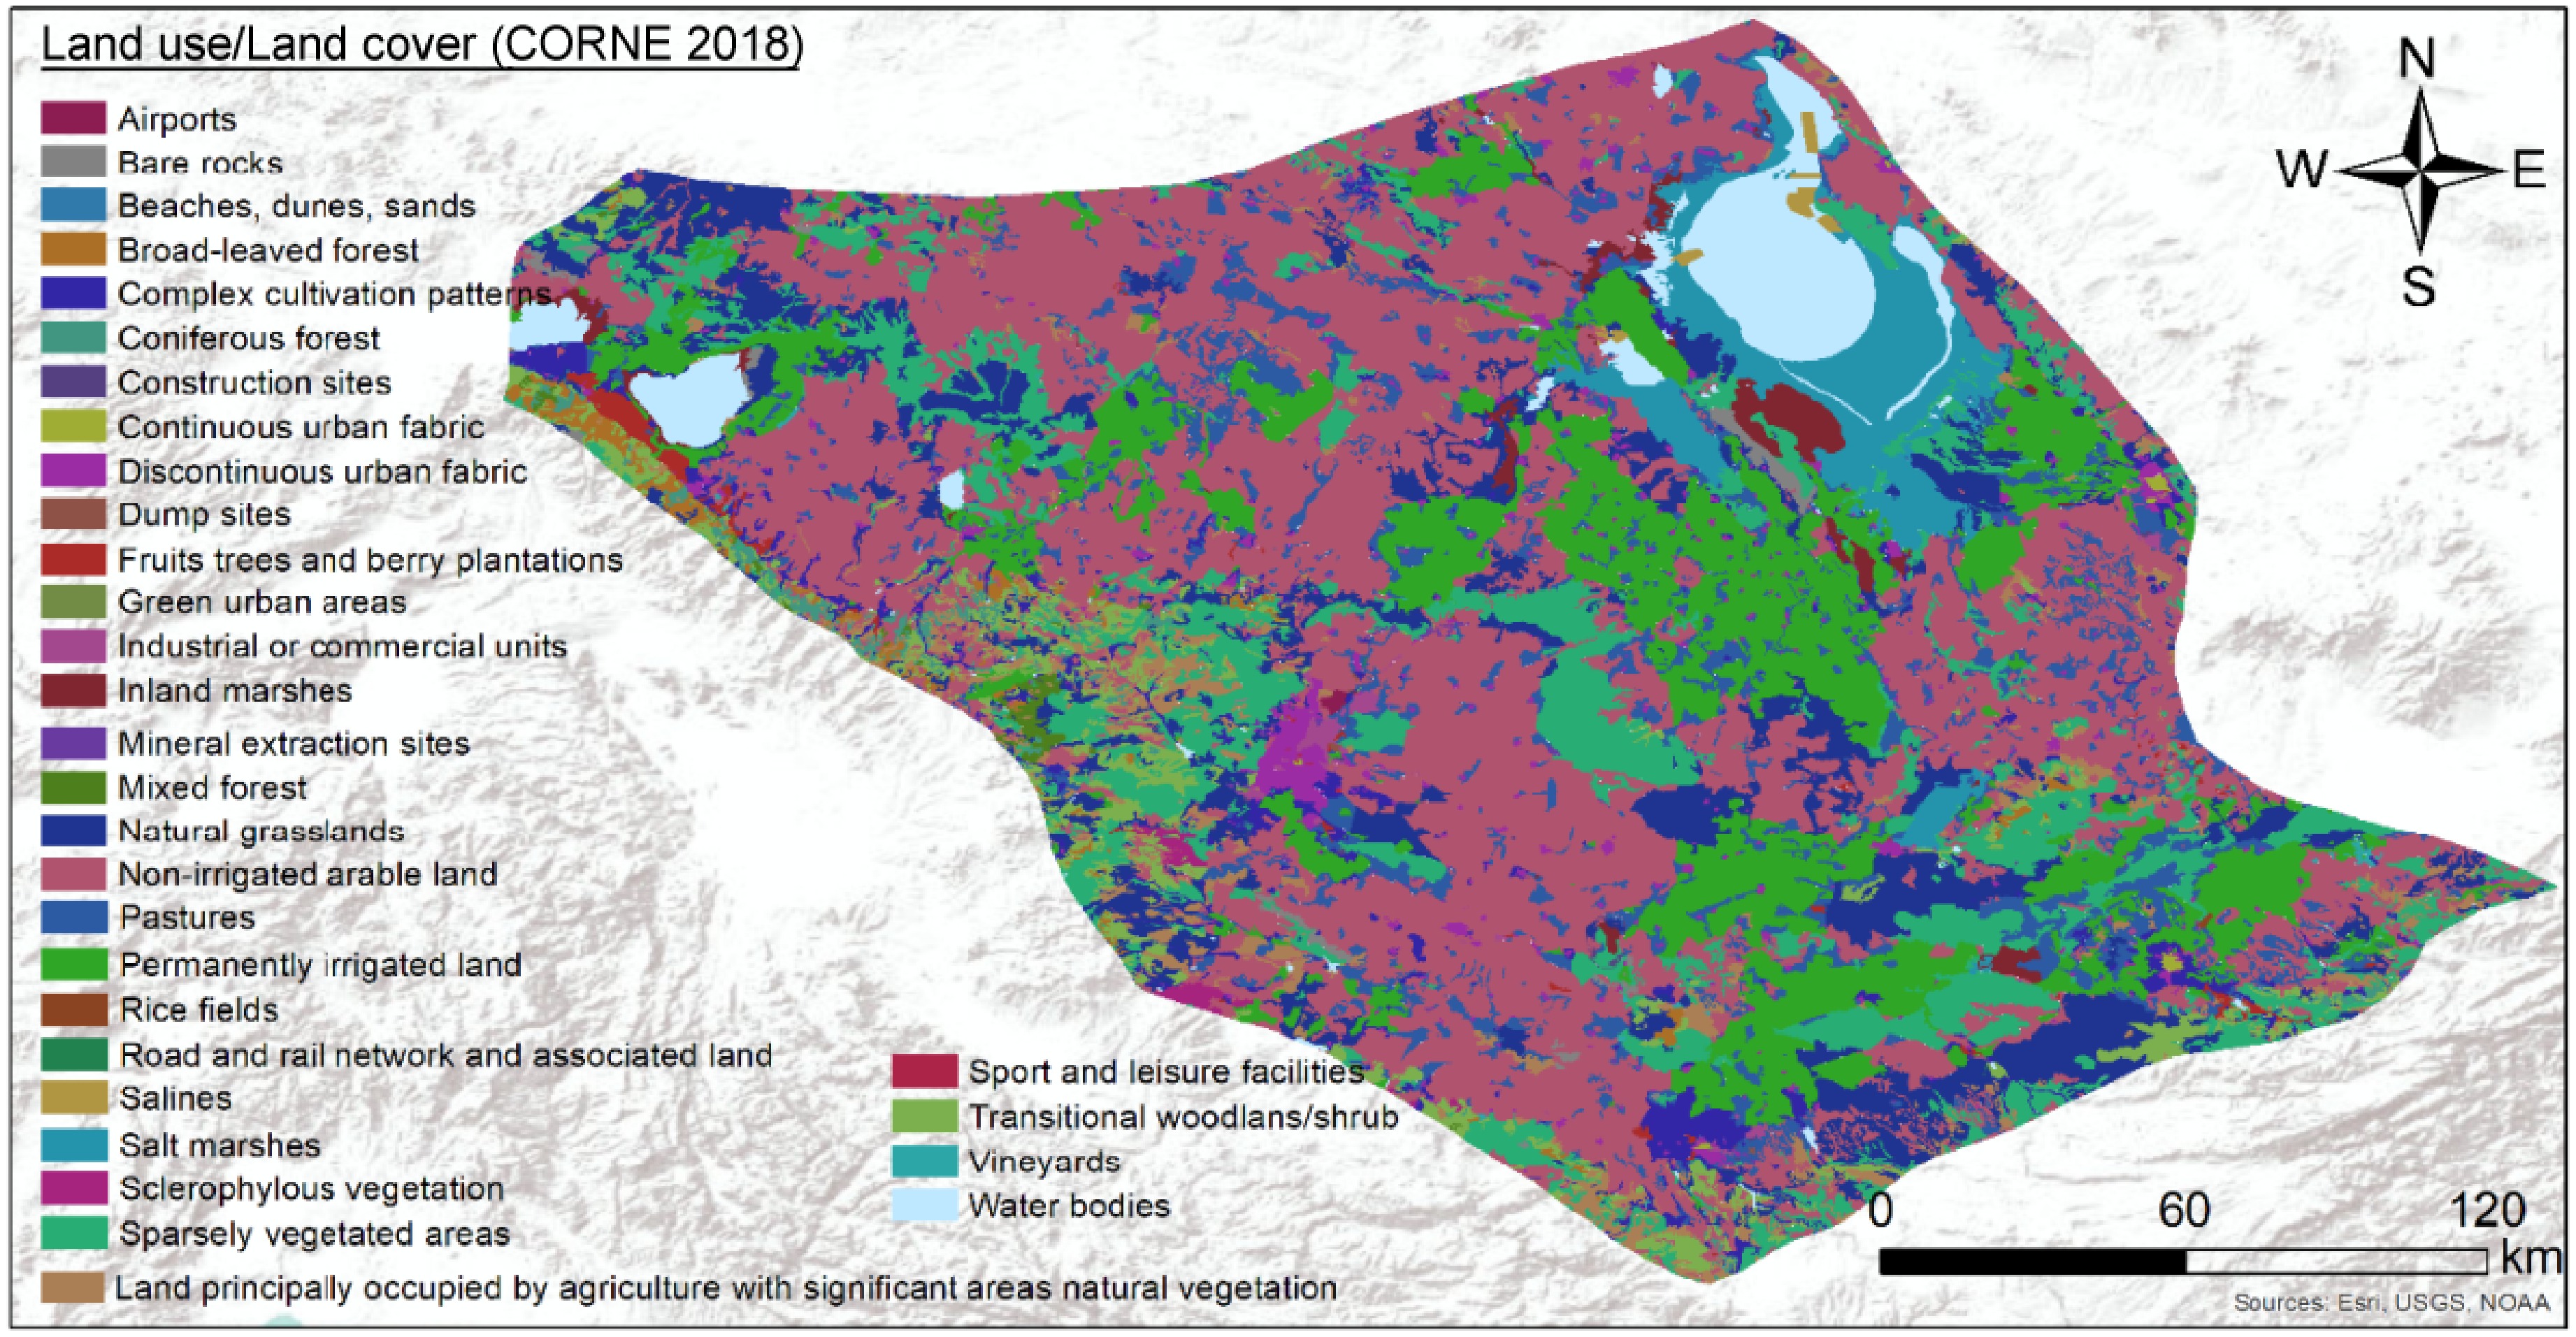
Figure 4.
Land use land cover map of the Konya Sub-Region (CORINE 2018).
-
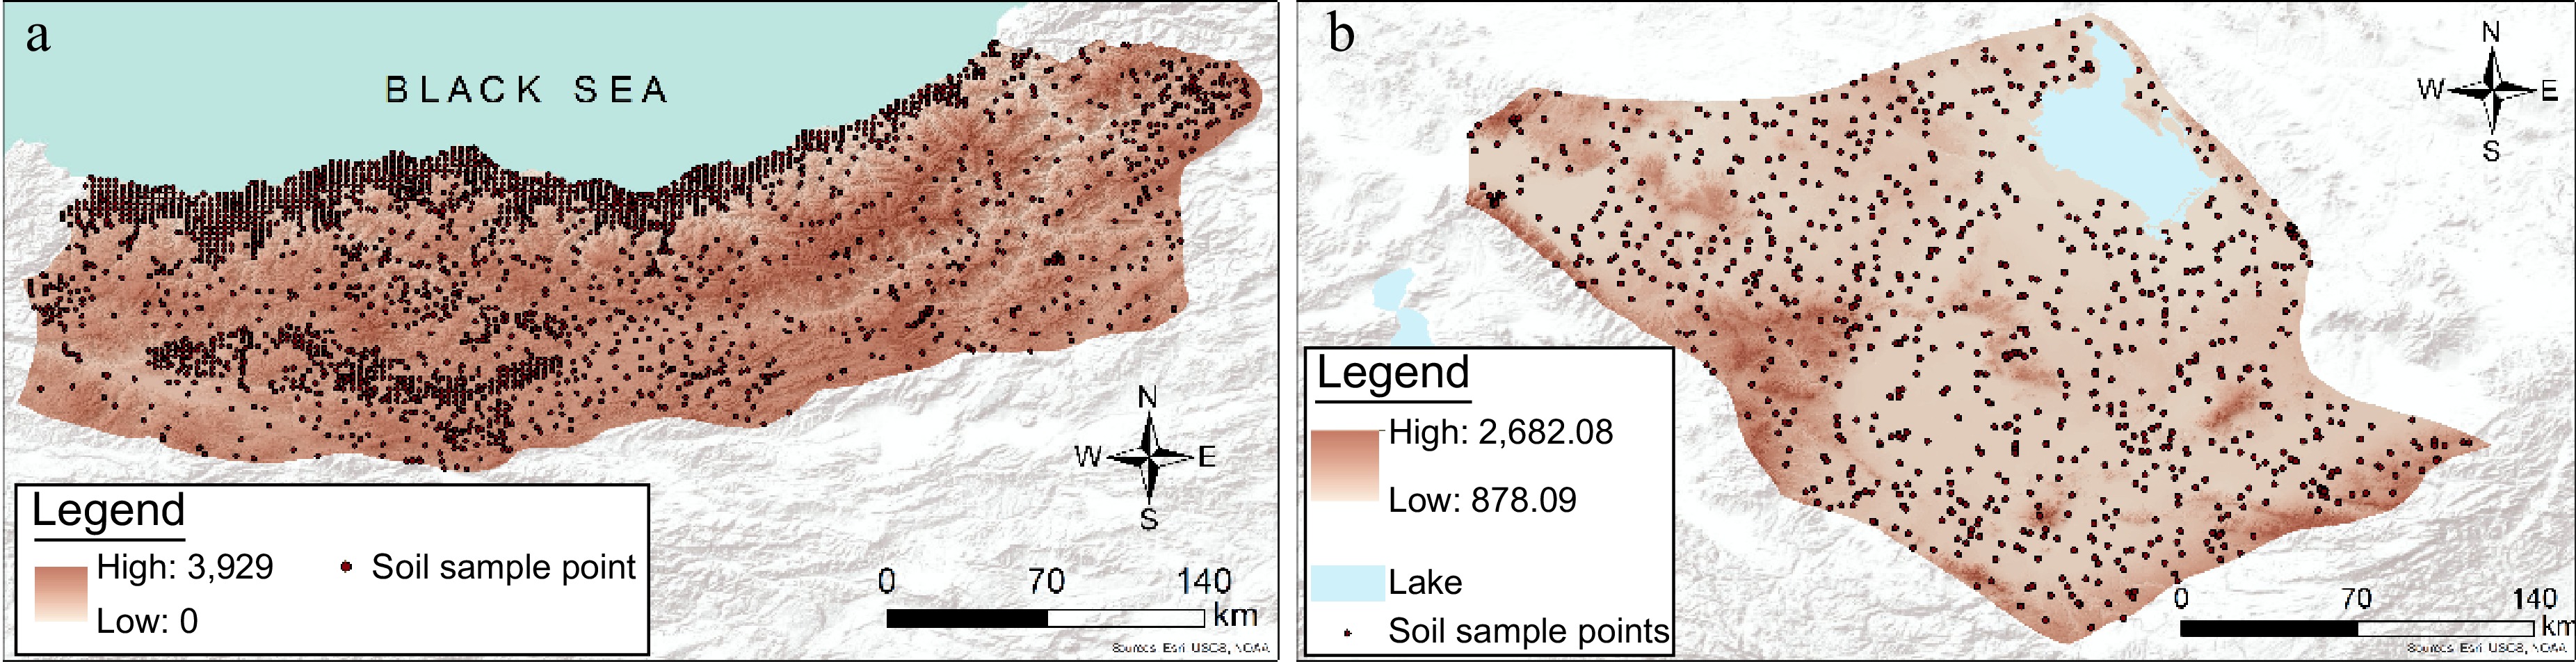
Figure 5.
Spatial distribution patterns of soil samplings over the study areas: (a) Black Sea Sub Region, (b) Konya Sub-Region.
-
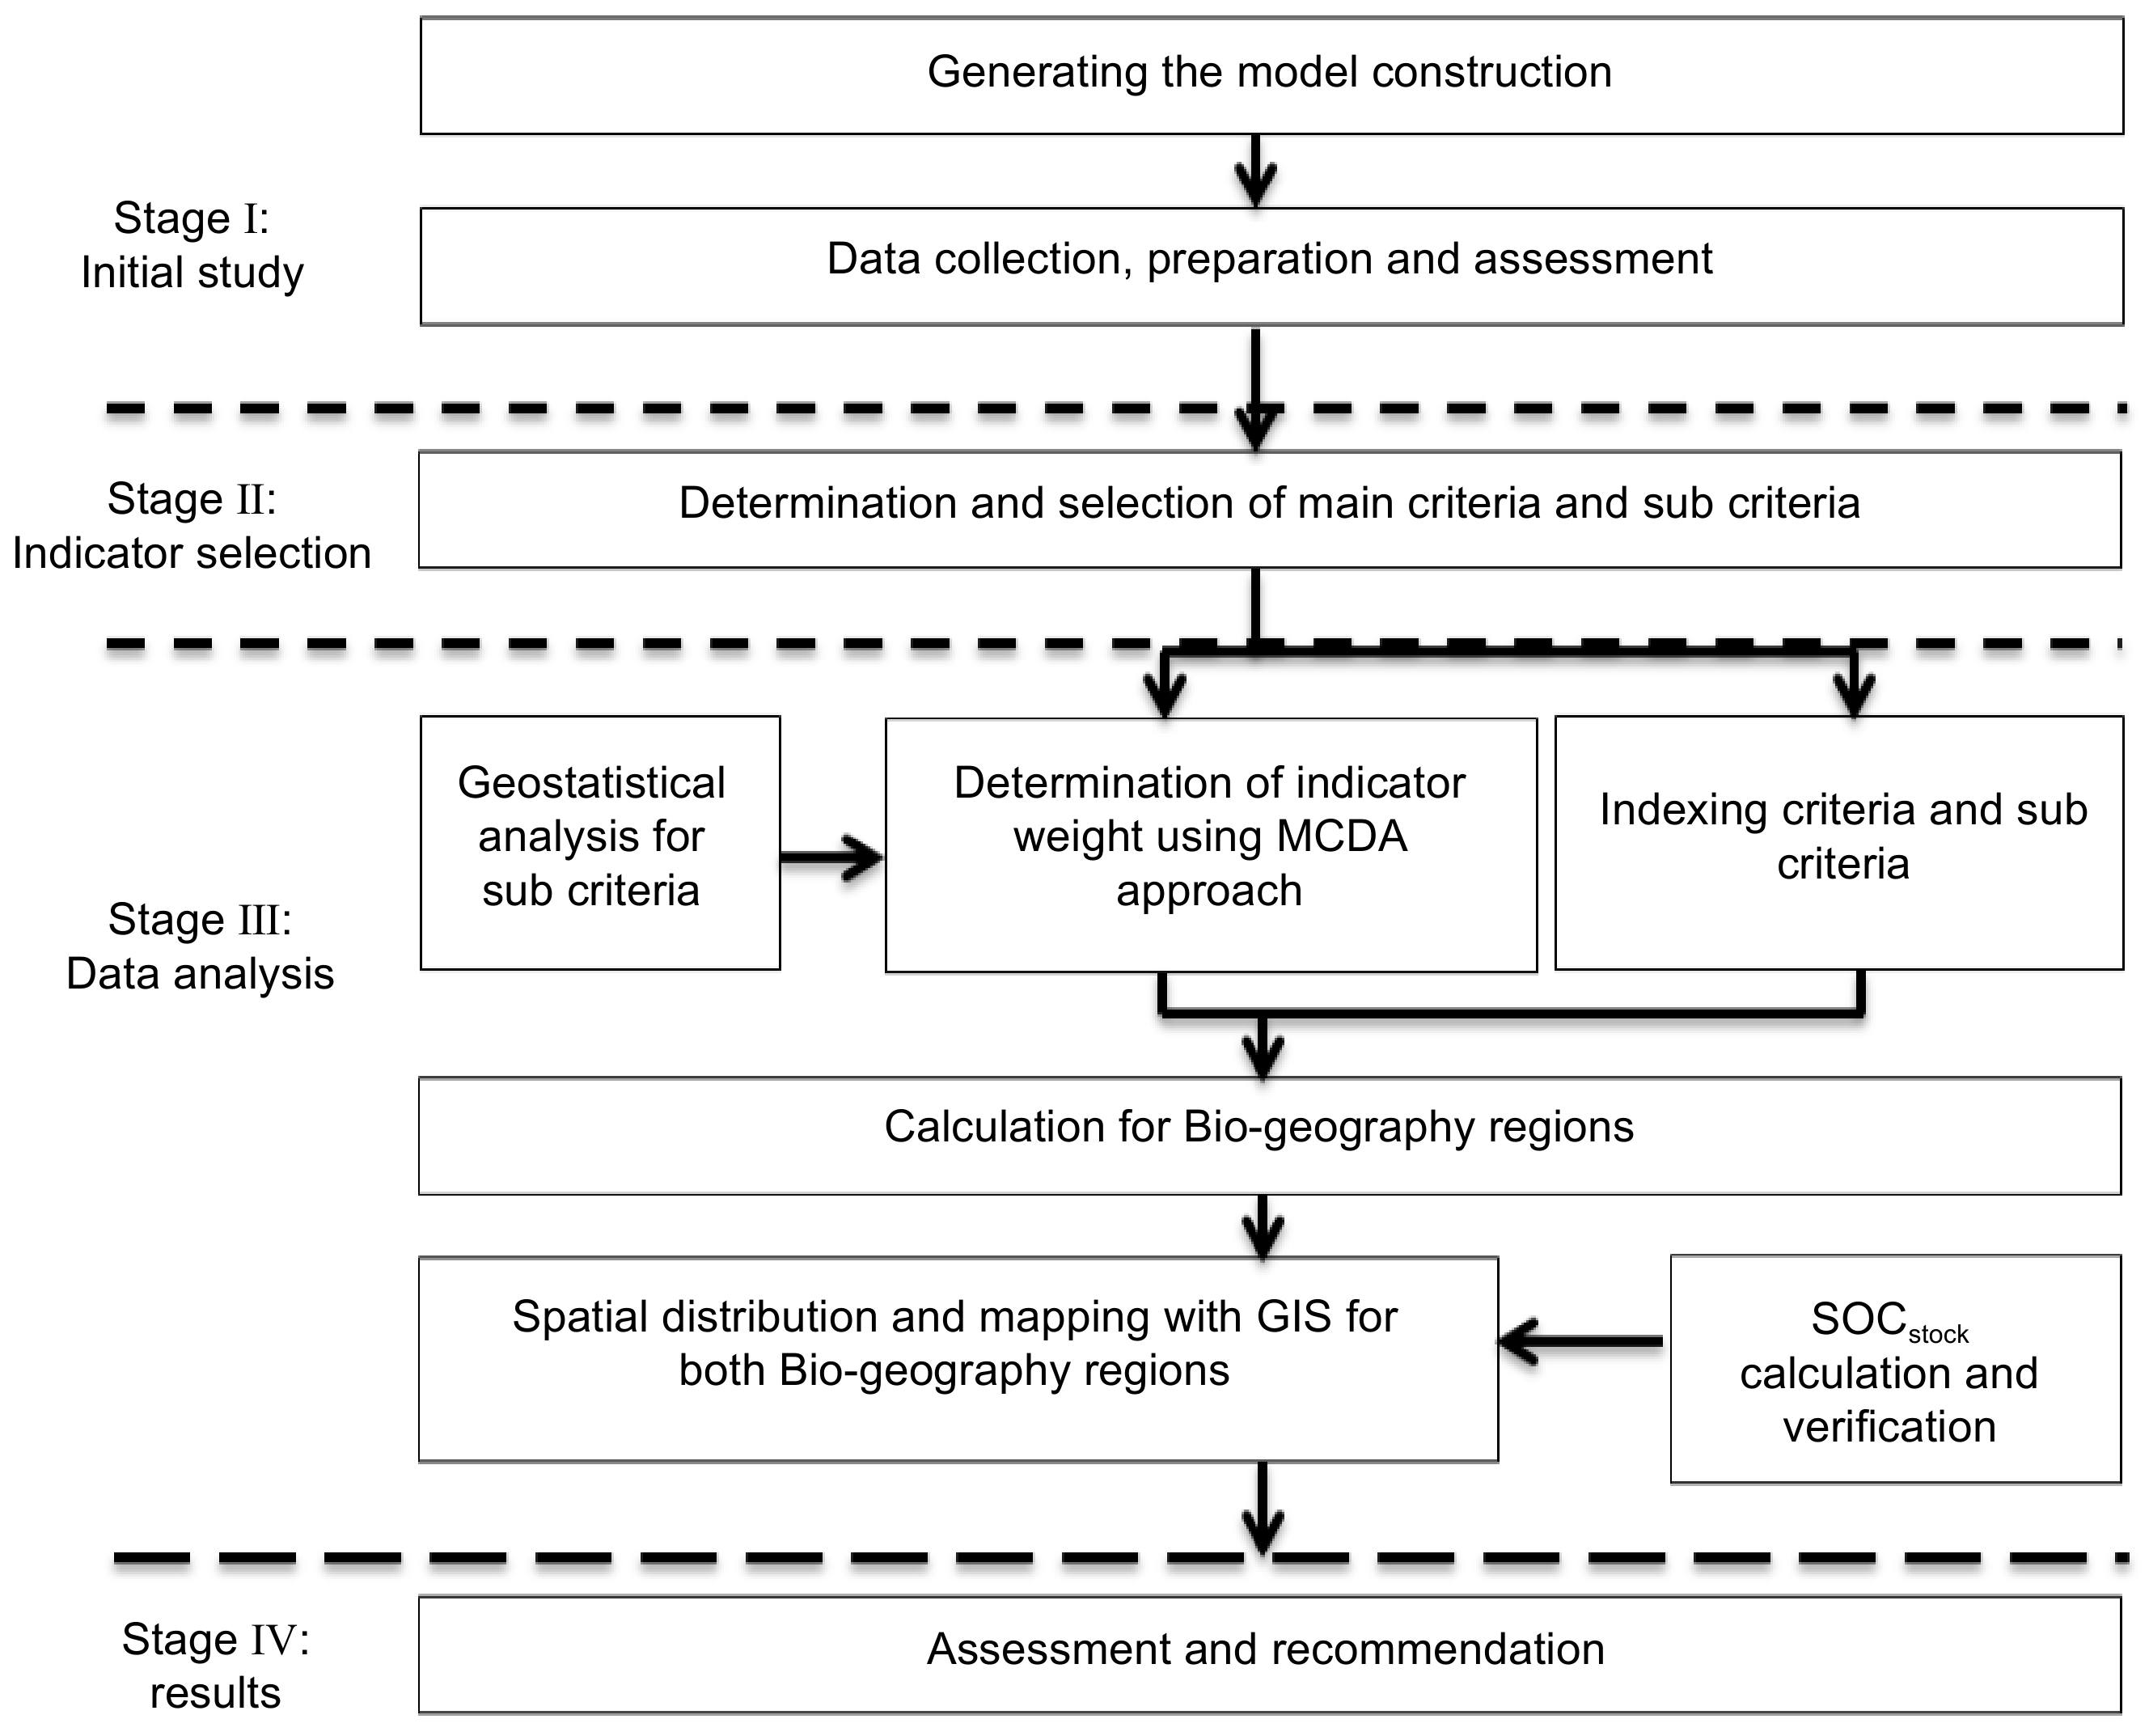
Figure 6.
The modelling architecture designed to determine the biogeographical regions.
-
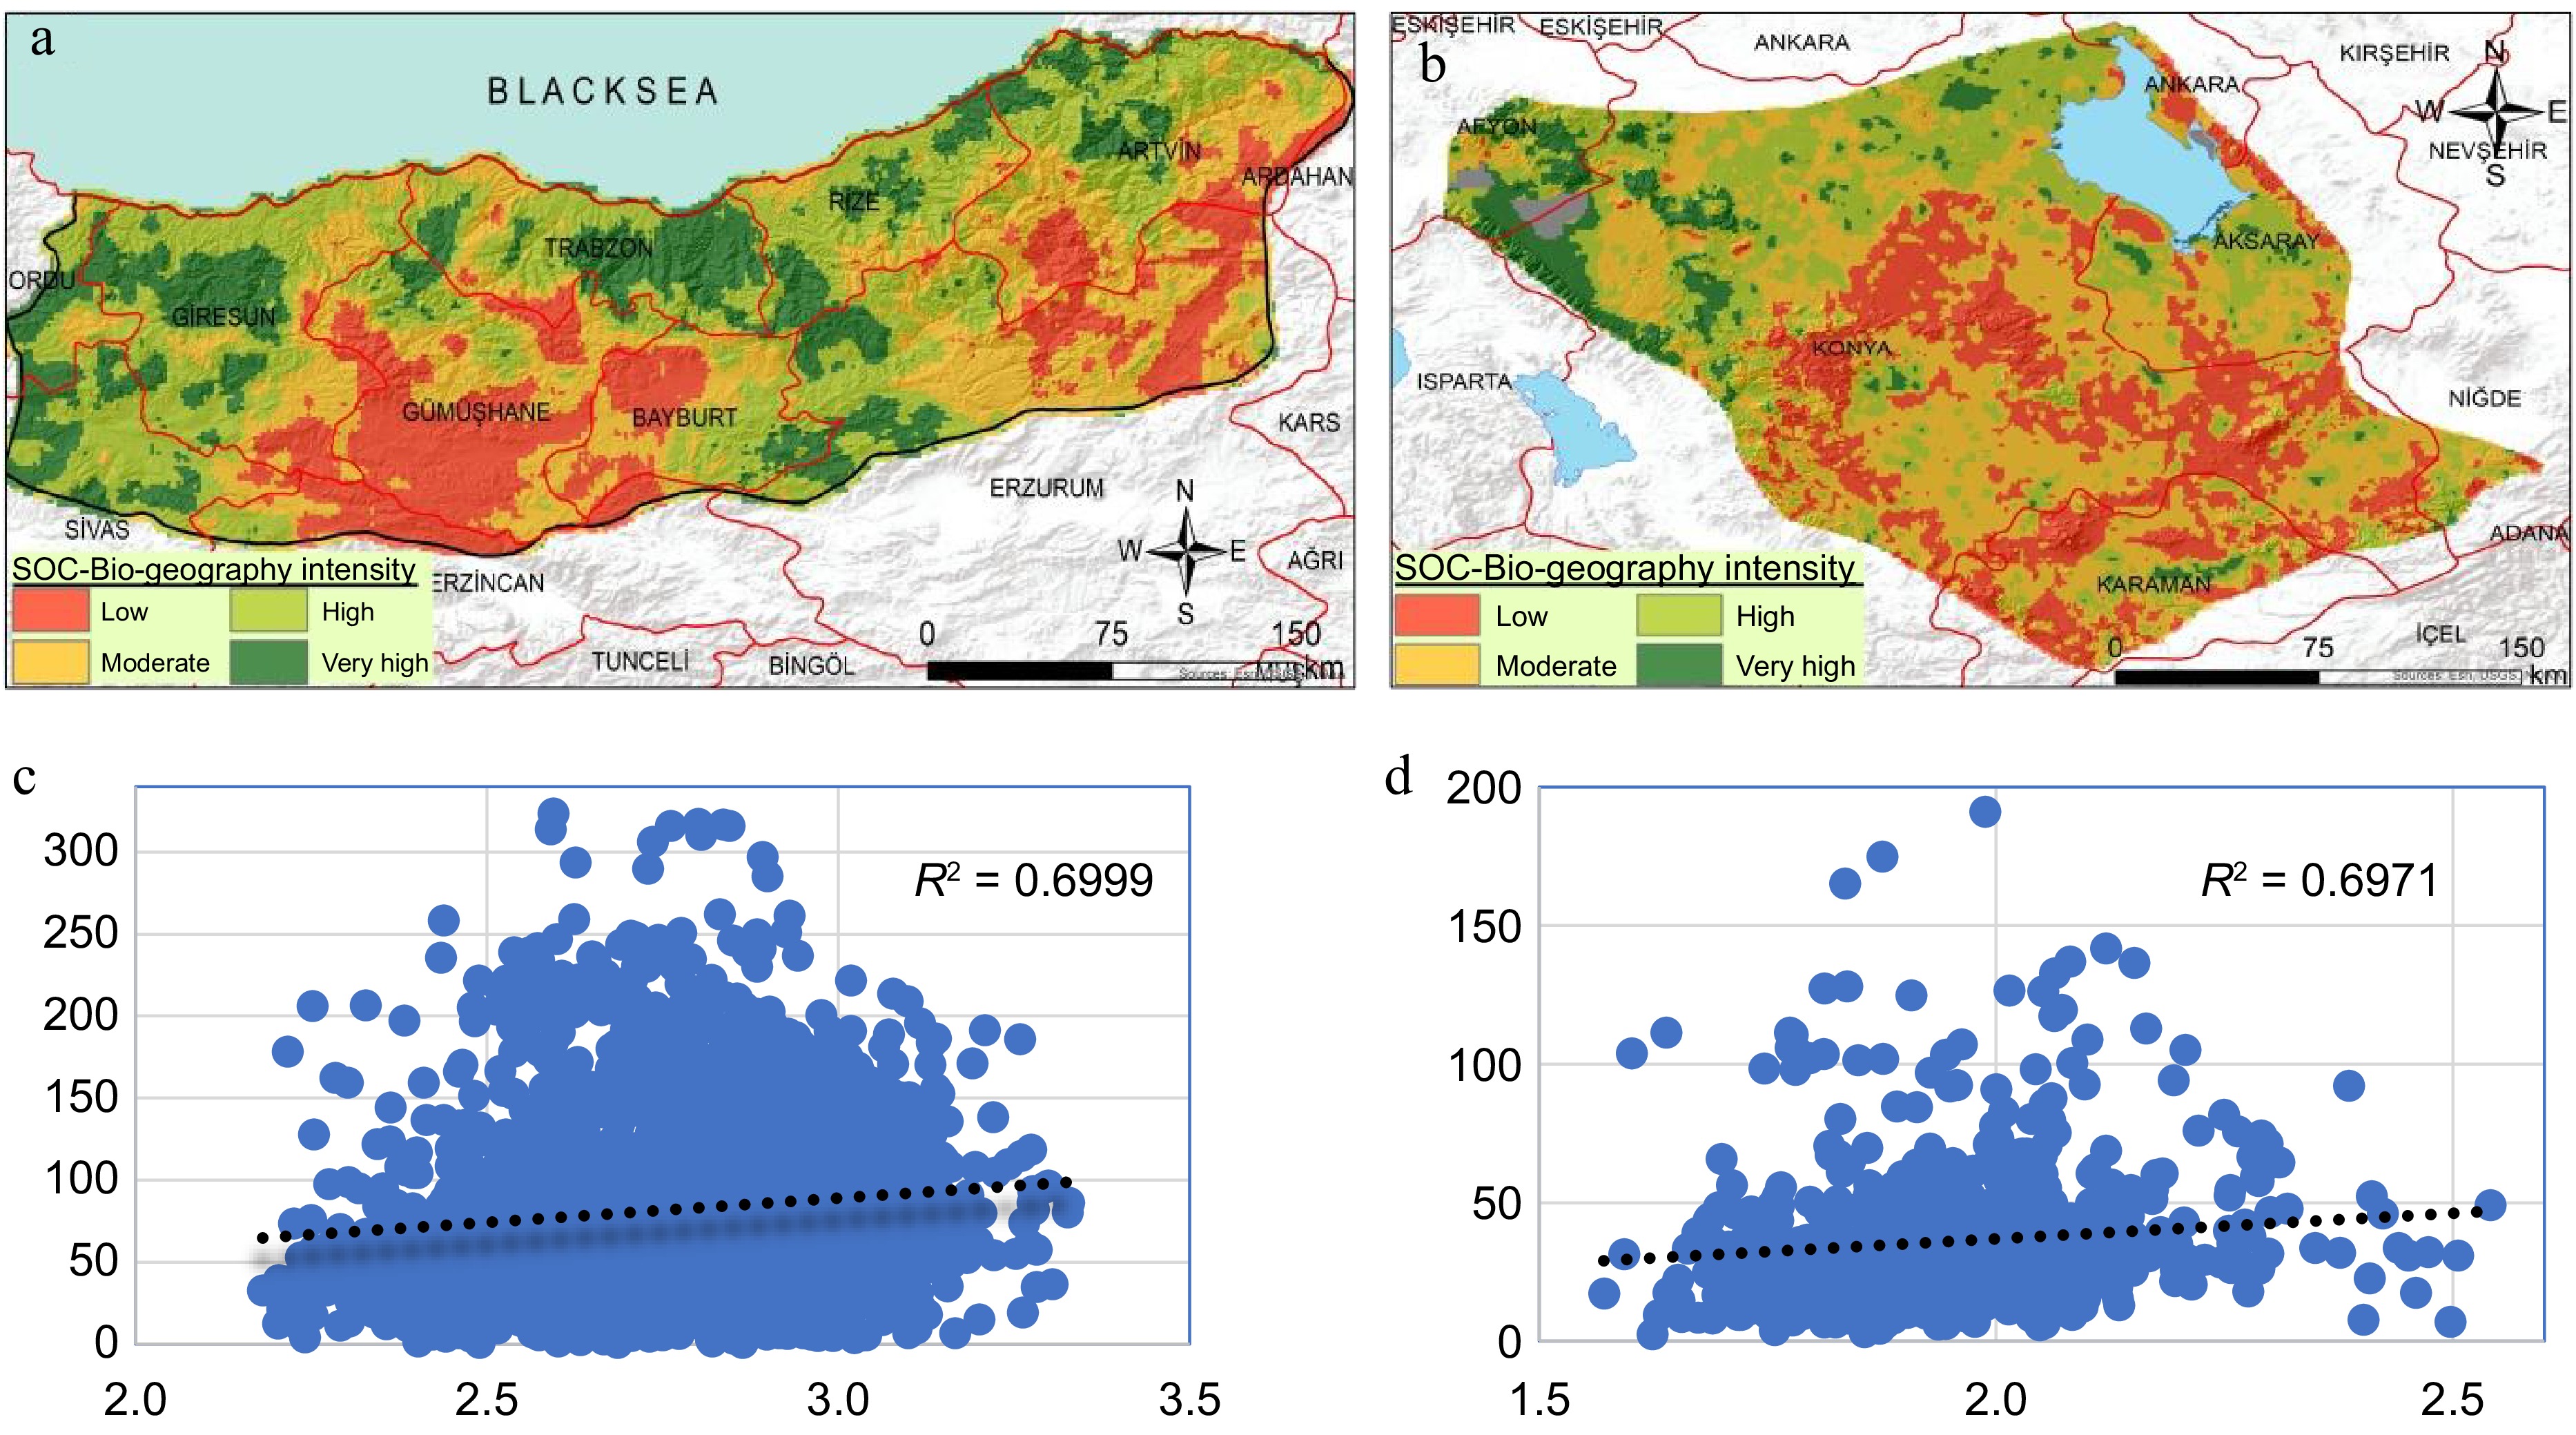
Figure 8.
Geographical distribution patterns of the SOC-based biogeographical intensity levels for (a) the Eastern Black Sea Sub-Region along with the (c) R2 value, and (b) the Konya Sub-Region along with the (d) R2 value.
-
Land use/land cover Area (ha) Ratio (%) Land use/land cover Area (ha) Ratio (%) Continuous urban fabric 36.0 0.1 Complex cultivation patterns 2,794.0 5.8 Discontinious urban fabric 239.0 0.5 Land principally occupied by agriculture with 4,614.0 9.7 Industrial or commercial units 27.0 0.1 Broad-leaved forest 4,279.0 9.0 Roas ans rail networks and associated land 22.1 0.0 Coniferous forest 4,914.0 10.3 Port areas 1.0 0.0 Mixed forest 5,438.0 11.4 Airports 1.0 0.0 Natural grasslands 2,043.0 4.3 Mineral extraction sites 40.0 0.1 Transitional woodlans/shrub 5,560.0 11.6 Dump sites 0.2 0.0 Beaches, dunes, sands 22.0 0.0 Construction sites 25.0 0.1 Bare rocks 1,789.0 3.7 Sport and leisure facilities 0.1 0.0 Sparsely vegetated areas 7,023.0 14.7 Non-irrigated arable land 2,335.5 4.9 Inland marshes 18.0 0.0 Permanently irrigated arandla land 895.0 1.9 Annual crops associated with permanent crop 0.1 0.0 Fruit trees and berry plantations 4,434.0 9.3 Water bodies 209.0 0.4 Pastures 1,008.0 2.1 Total 47,767.0 100.0 Table 1.
Proportional distribution of land use/ land cover map of the Eastern Black Sea Sub-Region.
-
Land use/Land cover Area (ha) Ratio (%) Land use/Land cover Area (ha) Ratio (%) Continuous urban fabric 33.0 0.1 Complex cultivation patterns 1,063.0 2.4 Discontinuous urban fabric 826.0 1.9 Land principally occupied by agriculture with
significant areas natural vegetation2,241.0 5.2 Industrial or commercial units 222.0 0.5 Broad-leaved forest 365.0 0.8 Road and rail network and associated land 4.0 0.0 Coniferous forest 318.0 0.7 Airports 22.0 0.1 Mixed forest 107.0 0.2 Mineral extraction sites 65.0 0.1 Natural grasslands 6,009.0 13.8 Dump sites 10.0 0.0 Sclerophylous vegetation 94.0 0.2 Construction sites 28.0 0.1 Transitional woodlans/shrub 3,167.0 7.3 Green urban areas 4.0 0.0 Beaches, dunes, sands 4.0 0.0 Sport and leisure facilities 6.0 0.0 Bare rocks 261.0 0.6 Non-irrigated arable land 3,530.0 8.1 Sparsely vegetated areas 7,019.0 16.1 Permanently irrigated land 7,880.0 18.1 Inland marshes 543.0 1.2 Rice fields 8.0 0.0 Salt marshes 2,536.0 5.8 Vineyards 41.0 0.1 Salines 89.0 0.2 Fruits trees and berry plantations 270.0 0.6 Water bodies 2,456.0 5.6 Pastures 4,276.0 9.8 Total 43,497 100.0 Table 2.
Proportional distribution of land use land-cover map of the Konya Sub-Region.
-
Parameter Unit Procedure Ref. Texture
(clay, silt, and sand)% Hydrometer method Bouyoucos, 1951 pH 1:1 Soil-water suspension (w:v) Soil Survey Staff, 1992 EC dS m−1 Soil-water suspension (w:v) Soil Survey Staff, 1992 CaCO3 % Calcimetric method Soil Survey Staff, 1992 Organic matter % Walkley-Black method Nelson & Sommers, 1982 BD g cm−3 Undisturbed condition Blacke & Hartge, 1986 Table 3.
Methods applied for the analysis of soil physical and chemical properties.
-
Class Index C1. Climate C1.1. Annual Aridity Index 0.20−0.50 (semi-arid) 1 0.50−0.65 (dry-subhumid) 2 0.65−1.0 (semi-humid) 3 > 1.0 (humid and very humid) 4 C1.2. Annual average number of rainy days 50−80 (low) 1 80−10 (moderate) 2 110−140 (high) 4 140−170 (very high) 3 C1.3. Dry period (May to September) average number of rainy days 13−26 (low) 1 26−39 (moderate) 2 39−52 (high) 3 52−65 (very high) 4 C1.4. Annual average maximum air temperature (°C) 13.5−15.0 (cool) 3 15.0−16.5 (warm) 4 16.5−18.0 (hot) 2 18.0−19.5 (very hot) 1 C1.5. Warm period (May to September) average maximum air temperature (°C) 22−24 (warm) 4 24−26 (very warm) 3 26−28 (hot) 2 28−30 (very hot) 1 C2. Geo-topography C2.1. Parent material - Alluvial deposits 1 - Basic-ultrabasic magmatics, melange, ophiolitic and serpentine, shale, metamorphic rocks such as schist, phyllite clay stone, marl. 2 - Siltstone, mudstone, conglomerate, travertine, limestone, dolomite, marble 3 - Acid magmatic, cherty, gneiss, dunes, volcanic ashes, tuff, agglomerate, breccia, evaporates, pebble stone, sand stone 4 C2.2. Slope (%) 0−5 4 5−15 3 15−35 2 35−+ 1 C2.3. Aspect East 1 South 2 West 3 North 4 C2.4. Elevation (m) 0−250 4 250−750 3 750−1,500 2 1,500−+ 1 C3. Vegetation C3.1. Land use / Land cover Artificial areas 1 Agriculture 2 Pasture 3 Forest 4 C3.2. Vegetation intensity (%) < 25 (very low) 1 25−50 (low) 2 50−75 (moderate) 3 75+ (very high) 4 C4. Soil C4.1. Soil depth (cm) 0−20 1 20−50 2 50−90 3 90−+ 4 C4.2. Organic matter (%) < 1 1 1−2 2 2−3 3 > 3 4 C4.3. Erosion (ton/ha/year) 0−5 4 5−10 3 10−20 2 20−+ 1 C4.4. pH 6.5−7.5 Slightly acid or alkaline 4 5.5−6.5 Slightly to moderate acid 3 7.5−8.5 Slightly to moderate alkaline 2 < 5.5 − > 8.5 Strong acid or alkaline 1 C4.5. Lime content - CaCO3 (%) 0−5 (low) 2 5−10 (moderate) 4 10−20 (high) 3 > 20 (very high) 1 C4. 6. Bulk density (g cm3) 1.00−1.20 (low) 4 1.21−1.40 (moderate) 3 1.41−1.55 (high) 2 > 1.55 (very high) 1 C4.7. Soil texture Fine (C < %45, CL, SiL, SCL) 4 Very fine (fC > %45, SiCL, SC) 3 Medium (L, Si, SiL, fSL) 2 Coarse (S, SL, LS) 1 Table 4.
Main criteria, sub criteria, and their index values.
-
Criteria Mean SD CV Variance Min. Max. Skewness Kurtosis BD (g cm−3) 1.41 0.12 1.49 0.01 0.82 2.31 −1.17 3.68 OM (%) 3.44 2.17 14.64 4.71 0.02 14.66 1.13 1.56 Clay (%) 22.57 12.54 69.44 157.45 1.81 69.44 0.39 −0.14 Sand (%) 47.00 17.93 87.37 321.69 5.01 87.37 −0.62 0.52 Silt (%) 25.53 10.27 71.76 105.59 1.10 71.76 −0.22 1.26 pH 4.84 2.74 8.50 7.50 3.14 8.50 −0.78 −0.72 CaCO3 (%) 3.82 7.45 64.98 55.6 0.01 64.98 2.75 8.50 C (ton ha−1) 81.68 53.99 350.92 2914.97 0.46 351.38 1.27 2.10 BD: Bulk density, SD: standard deviation, CV: coefficient of variation, Min: Minimum, Max: Maximum. Table 5.
Descriptive statistics for physico-chemical properties of soils in the Eastern Black Sea Sub-region.
-
Criteria Mean SD CV Variance Min. Max. Skewness Kurtosis OM (%) 1.70 1.12 9.71 1.27 0.09 9.80 2.33 8.69 Clay (%) 30.37 13.51 77.32 182.71 3.62 80.94 0.62 0.41 Sand (%) 40.34 16.65 90.76 277.55 1.38 92.14 0.32 0.13 Silt (%) 29.28 10.59 68.44 112.21 1.59 70.03 0.34 0.88 BD (g cm−3) 1.34 0.14 0.71 0.02 1.10 1.81 0.35 −0.56 pH 7.51 0.31 2.27 0.10 6.76 8.43 −0.46 1.57 CaCO3 (%) 26.27 17.71 84.50 313.86 0.01 84.50 0.50 −0.47 C (ton ha−1) 36.33 26.63 266.56 709.16 2.12 268.66 2.88 12.52 BD: Bulk density, SD: standard deviation, CV: coefficient of variation, Min: Minimum, Max: Maximum. Table 6.
Descriptive statistics for physico-chemical properties of soils in the Konya Sub-Region.
-
Interpolation models Semivariogram models RMSE value Eastern Black
Sea Sub-RegionKonya
Sub-RegionInverse Distance Weighting (IDW) IDW−1 0.233 0.480 IDW-2 0.231 0.474 IDW-3 0.230 0.512 Radial Basis Functions (RBF) TPS 0.236 0.626 CRS 0.235 0.476 SWT 0.236 0.479
KrigingOrdinary Gaussian 0.103 0.487 Exponential 0.104 0.485 Spherical 0.104 0.487 Simple Gaussian 0.105 0.485 Exponential 0.106 0.485 Spherical 0.104 0.484 Universal Gaussian 0.105 0.487 Exponential 0.106 0.487 Spherical 0.106 0.486 TPS: Thin Plate Spline, CRS: Completely Regularized Spline, SWT: Spline with Tension. Bold numbers are the lowest values of RMSE. Table 7.
Interpolation models and RMSE of soil criteria.
Figures
(7)
Tables
(7)